






Key Points
- Gold plunges below $4,000 on 22 October, reaching its lowest level in more than two months despite escalating US–Iran tensions.
- Rising energy costs and persistent US inflation have complicated the outlook for interest rates.
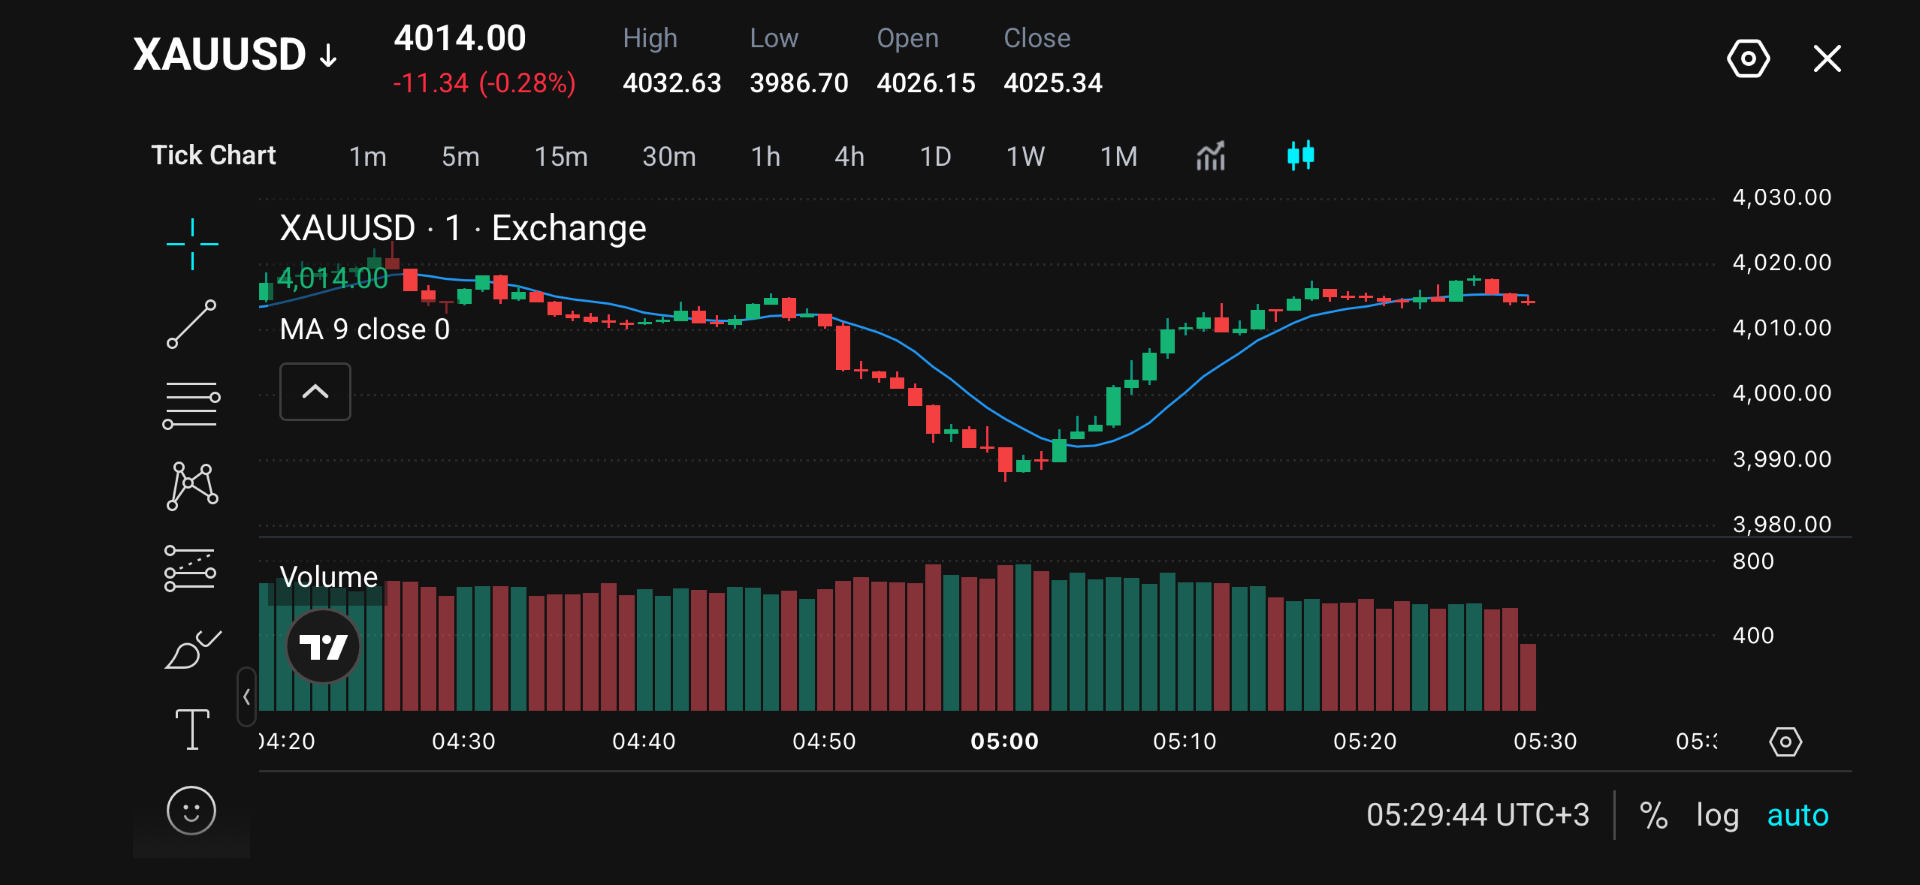
- The latest session shows XAUUSD trading at $4,014, following a decline to $3,986.70 and a recovery above $4,000.
- Immediate chart resistance sits around $4,018–$4,020, followed by $4,032.63. The broader $4,075–$4,100 area remains a recovery reference.
- The 27–28 October Federal Reserve meeting, US–Iran developments, oil prices and Treasury yields are the main catalysts ahead.
Market Move
Gold (XAUUSD) plunged approximately below $4,000 per ounce on 22 October, reaching its lowest level in more than two months despite escalating US–Iran tensions.
Now, gold is trading around $4,014 after buyers responded to the dip. In the latest trading session, gold reached a low of $3,986.70 and a high of $4,032.63, easing into consolidation near $4,014.
Price is hovering near its nine-period moving average, while the latest candles suggest the initial rebound has lost momentum.
Why Traders Are Watching
Escalating US–Iran tensions have lifted oil prices and inflation concerns, offsetting gold’s safe-haven appeal. September US CPI rose 0.6% month on month and 3.7% year on year, up from 3.4% in August, while producer prices increased 1.3%.
Persistent inflation could keep Federal Reserve policy restrictive, pressuring gold through higher interest rates and a stronger dollar. Higher rates increase the opportunity cost of holding gold, while dollar strength makes it more expensive for overseas buyers.
Gold’s decline alongside equities also suggests investors may be reducing exposure or raising cash. Geopolitical risk alone may therefore be insufficient to support a recovery.
Key Trading Levels
| Level | Role | Significance |
| $4,075–$4,100 | Broader recovery resistance | Wider reference zone from the supplied outlook; outside the visible chart range. |
| $4,050 | Psychological resistance | Round-number reference above the displayed trading range. |
| $4,032.63 | Upper resistance reference | High displayed in the chart header. |
| $4,018–$4,020 | Immediate resistance | Area containing the recent rebound peak and earlier price congestion. |
| $4,010 | Initial support reference | Nearby consolidation and pause area within the rebound. |
| $4,000 | Main psychological support | Round-number threshold crossed during both the sell-off and recovery. |
| $3,986.70–$3,990 | Lower support zone | Combines the displayed low with the base of the visible rebound. |
The $4,018–$4,020 range contains the rebound peak and earlier congestion, making it the immediate resistance zone. The displayed high of $4,032.63 provides a separate upper reference, while $4,050 is the psychological resistance. Above that, $4,075–$4,100 represents a broader recovery zone from the market outlook.
On the downside, $4,010 is the initial support reference. Below that, $4,000 is the main psychological support, particularly after prices crossed it during both the decline and recovery. The $3,986.70–$3,990 zone identifies the base where buying interest emerged.
Bullish and Bearish Setups
| Scenario | Confirmation | Potential Levels in Focus | Invalidation |
| Bullish rebound | A sustained break above $4,018–$4,020, followed by a successful retest. | $4,032.63, then $4,050. A broader recovery could bring $4,075–$4,100 into view. | Failure to retain the breakout, followed by a loss of $4,010. |
| Bearish continuation | A sustained move below $4,000, with an unsuccessful attempt to reclaim it. | $3,990, followed by $3,986.70. Further downside would require support references from a wider chart. | A recovery above $4,010, followed by renewed strength through $4,020. |
The bullish case depends on gold breaking above $4,018–$4,020 and holding this area during a pullback, which would suggest buyers are establishing support above recent resistance. This could support a recovery towards $4,032.63, followed by $4,050. A stronger advance could bring $4,075–$4,100 into focus, although a failed breakout followed by a drop below $4,010 would weaken the rebound outlook.
The bearish case strengthens if gold falls below $4,000 and fails to reclaim this psychological level, suggesting sellers remain in control. Attention would then shift to $3,990 and the recent low of $3,986.70.
Disclaimer
The price levels and market scenarios above reflect the author’s interpretation of the supplied 15-minute chart at the time of writing and do not represent financial advice or an official recommendation from VT Markets. Traders should conduct their own analysis and manage risk carefully.
Gold Prediction: Market Drivers
The Federal Reserve’s 27–28 October meeting is the next major catalyst. Traders will assess both the decision and the accompanying guidance for evidence of how officials intend to balance inflation risks against economic weakness.
Gold could recover if the Fed signals less urgency for further tightening, Treasury yields decline or the dollar weakens. Geopolitical uncertainty could also support demand if investors seek protection without raising their expectations for interest rates. Gold could extend its decline if oil prices rise further and reinforce inflation concerns, encouraging a more restrictive policy outlook. Renewed dollar strength or broader demand for cash could add pressure.
US–Iran developments carry major implications for gold. Escalation may encourage defensive buying, but accompanying energy shock could strengthen inflation concerns currently weighing on the market.
Explore Gold Trading with VT Markets
VT Markets provides access to gold CFDs through MetaTrader 4, MetaTrader 5 and the VT Markets app, allowing traders to speculate on rising or falling prices without owning physical bullion.
For access beyond traditional weekday sessions, explore XAUUSD247, which offers gold CFD trading including weekends, subject to product availability and trading conditions.

Learn more about trading gold with VT Markets.
Frequently Asked Questions
Why is gold falling despite rising US–Iran tensions?
Geopolitical uncertainty can support gold, but higher oil prices can also increase inflation concerns. Expectations of restrictive interest rates and a stronger dollar may outweigh safe-haven demand.
What does the latest gold chart show?
The chart shows XAUUSD at $4,014, with a displayed low of $3,986.70 and high of $4,032.63. Prices recovered above $4,000 before consolidating below $4,020.
Has gold already fallen below $4,000?
Yes, it reached a low of $3,986.70. The next question is whether buyers can sustain the recovery above $4,000 or whether another decline leads to a retest of that low.
Where is gold’s immediate resistance?
The nearest visible resistance is around $4,018–$4,020, followed by the displayed $4,032.63 high. $4,075–$4,100 is a broader recovery reference.
What could move gold next?
The Federal Reserve’s October meeting, developments involving the US and Iran, oil prices, Treasury yields and the US dollar could all influence gold’s next move.
Start trading now — click here to create your real VT Markets account.



