






Key Points
- USOUSD loses its seven-session streak as traders assessed the potential return of additional Russian fuel supplies.
- President Donald Trump’s decision to waive sanctions and tariffs on Russia has raised expectations of increased global oil availability.
- Tanker attacks near the Strait of Hormuz and Ukrainian strikes on Russian oil infrastructure continue to threaten supply.
- Stronger US import prices have reinforced inflation concerns ahead of the Federal Reserve’s interest rate decision.
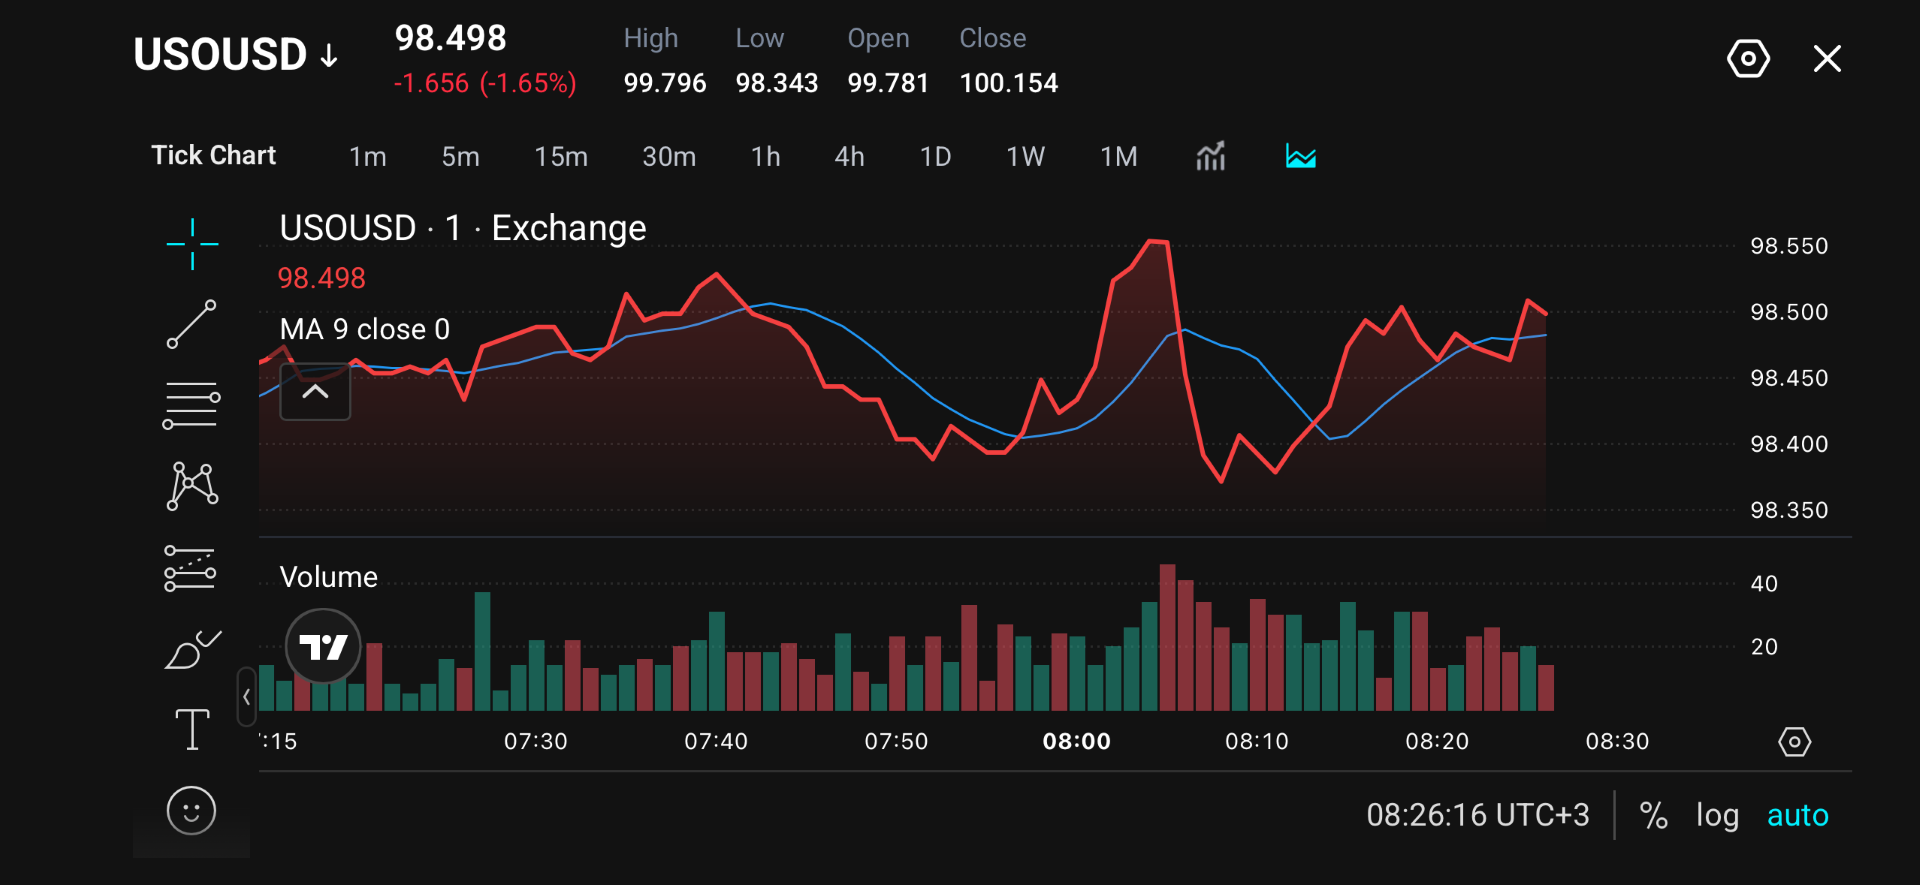
- Resistance sits around 98.500–98.550, while support near 98.400 and 98.350 could determine the next short-term move.
Market Move
US crude oil prices retreated on Monday, 19 October, ending a seven-session winning streak as traders reassessed global supply conditions following Washington’s decision to ease restrictions on Russian energy exports.
West Texas Intermediate (WTI) was trading near a price of 98.498 in the latest session. It experienced sharp intraday swings, including a brief advance towards 98.550 followed by a rapid decline towards 98.370. Prices subsequently recovered towards 98.500, suggesting that buyers have returned at lower levels despite the broader session’s losses.
Why Traders Are Watching
The decline followed President Donald Trump’s decision to temporarily waive sanctions and tariffs on Russia, potentially allowing more Russian fuel to enter international markets. The policy shift has eased some immediate concerns about supply shortages, particularly as Turkey prepares to absorb additional Russian diesel exports. However, attacks on tankers near the Strait of Hormuz and Ukrainian drone strikes targeting Russian oil infrastructure have kept supply risks elevated.
US monetary policy is also another piece of the puzzle. September import prices rose more than expected, partly because of higher energy costs, reinforcing concerns about persistent inflation. If the Fed decides to add another rate hike, it would further weigh on oil prices.
Traders are monitoring the upcoming Federal Open Market Committee meeting, PCE inflation figures and developments affecting Russian and Middle Eastern energy supplies for signals on future price direction.
Key Trading Levels
| Level | Price (USD) | Technical significance |
| Resistance 2 | 98.55 | Recent intraday peak and upper resistance |
| Resistance 1 | 98.5 | Immediate resistance and repeated rejection area |
| Current price | 98.498 | Latest quoted price |
| Support 1 | 98.45 | Near-term support and consolidation zone |
| Support 2 | 98.4 | Previous reaction low and psychological support |
| Support 3 | 98.370–98.350 | Intraday recovery zone and lower support |
USOUSD faces immediate resistance at 98.500, where recent attempts to extend recovery have struggled to gain traction.
On the downside, 98.450 provides the first area of support. A move below this level could expose 98.400, followed by the 98.370–98.350 zone where buyers previously emerged.
The nine-period moving average remains close to the current price, suggesting limited directional conviction. With prices fluctuating around 98.500, traders may look for a sustained breakout or breakdown before assessing the next short-term direction.
Bullish and Bearish Setups
| Scenario | Trigger | Potential target | Market implication |
| Bullish recovery | Price holds above 98.500 | 98.55 | Buyers regain short-term control |
| Bullish breakout | Sustained move above 98.550 | Further upside, unconfirmed | Stronger recovery momentum |
| Bearish rejection | Price fails to hold 98.500 | 98.45 | Selling pressure returns |
| Bearish breakdown | Price falls below 98.400 | 98.370–98.350 | Downward momentum strengthens |
A bullish scenario could develop if USOUSD establishes support above 98.500. This would suggest that buyers are overcoming immediate selling pressure, potentially allowing prices to retest 98.550. A sustained move beyond that resistance could support further gains.
Conversely, a bearish scenario could emerge if prices fail to maintain the recovery near 98.500. A decline below 98.450 would bring 98.400 into focus.
Disclaimer
The price levels and market scenarios above reflect the author’s assessment at the time of writing. They do not represent financial advice or an official recommendation from VT Markets. Traders should conduct their own analysis and manage risk carefully.
USOUSD Prediction: What’s Next?
Though the US sanctions waiver has introduced a potential source of additional fuel supply, markets are still uncertain over the execution and stability of the waiver. Attacks affecting the Strait of Hormuz and Russian energy infrastructure also limit the downside as any disruption to shipping or export facilities may renew buying interest in crude oil.
US inflation and interest rate expectations will also influence the outlook. If the Federal Reserve maintains a restrictive policy outlook, a firmer US dollar and weaker demand expectations could weigh on crude prices. However, any easing in inflation concerns could support market sentiment.
Trade USOUSD with VT Markets
Traders can access USOUSD through VT Markets and monitor crude oil price movements using the VT Markets App, MetaTrader 4 and MetaTrader 5.
Oil prices can respond quickly to changes in global supply expectations, geopolitical developments, inventory data and shipping disruptions. These factors can influence price momentum and create periods of increased market volatility.
With VT Markets’ charting and market-analysis tools, traders can monitor price momentum, identify key support and resistance levels, and assess potential USOUSD setups.
Start trading energy CFDs with VT Markets. Start a live account and discover daily market insights and more.
Frequently Asked Questions
Why is USOUSD falling today?
USOUSD declined as the US temporarily waived sanctions and tariffs on Russia, raising expectations of increased Russian fuel exports. The prospect of additional supply has weighed on crude prices despite continuing geopolitical disruptions.
What are the key USOUSD support and resistance levels?
Immediate resistance is located near 98.500 and 98.550. Support is around 98.450 and 98.400, followed by the lower 98.370–98.350 zone.
Could oil prices rise despite increased Russian exports?
Yes. Further attacks on energy infrastructure, restrictions affecting the Strait of Hormuz or disruptions to shipping routes could tighten available supplies and support prices.
How could the Federal Reserve affect USOUSD prices?
Higher interest rates may strengthen the US dollar and weaken expectations for economic activity and oil demand. A less restrictive monetary policy outlook could provide support, although physical supply conditions remain important.
What should traders watch next for USOUSD?
Traders may monitor developments in Russian fuel exports, Middle Eastern shipping disruptions, US inflation data and the upcoming Federal Reserve meeting.
Start trading now — click here to create your real VT Markets account.



