






Key Points
- Brent crude oil has climbed to approximately $114 per barrel following escalating US–Iran tensions.
- Renewed geopolitical uncertainty in the Middle East has increased fears of potential disruptions to oil production.
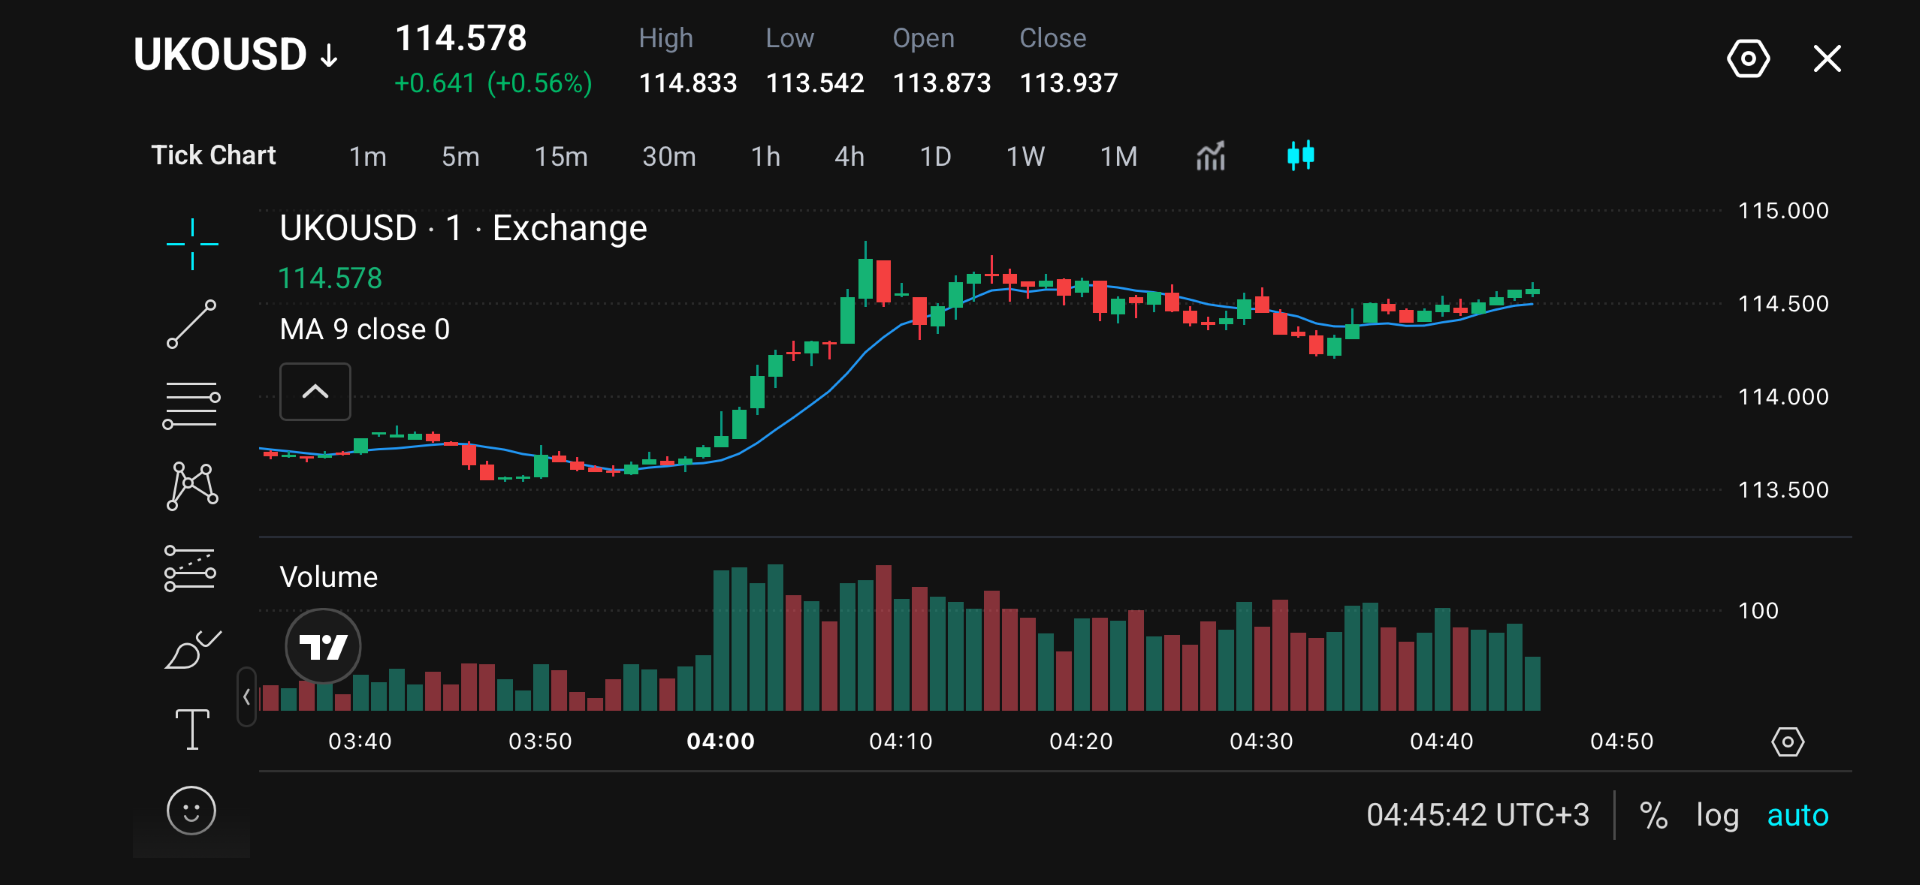
- Initial support sits around $114.20–$114.30, with resistance near $114.833–$115.00.
- The psychological $120 level could attract attention if further escalation supports a sustained rally.
- Traders are assessing whether the recent rally is driven by temporary geopolitical fears or the possibility of sustained supply disruptions.
Market Move
Brent oil has climbed above $114, with the latest session showing a sharp advance from $113.60–$113.80 before prices consolidated near $114.50. Buyers then recovered from a pullback towards $114.20–$114.30, leaving the latest price at $114.578, slightly above the nine-period moving average.
The advance comes amid renewed concern over US–Iran tensions and the security of energy shipments.
For oil traders, the key question is whether heightened shipping risks will translate into lasting supply losses. Geopolitical uncertainty can lift prices quickly, but maintaining those gains may require evidence that fewer barrels are reaching buyers.
Why Traders Are Watching
The Strait of Hormuz remains central to the outlook as it connects major Gulf producers with global markets. Roughly 20 million barrels per day passed through the strait in 2024, equivalent to around 20% of global petroleum liquids consumption. This baseline illustrates the potential impact of disruption to the route.
Higher crude prices also drive up inflation. More expensive fuel can raise transport and production costs, while a persistent increase could influence inflation expectations. These expectations then affect the monetary policy response to oil shocks.
A sustained energy rally could therefore complicate the case for lower US interest rates. At the same time, higher fuel bills could weaken household spending and business activity, leaving policymakers to assess both inflation pressure and growth risks.
Key Trading Levels
| Level | Role | Significance |
| $120.00 | Psychological reference | Broader upside level if the rally extends materially beyond $115. |
| $114.833–$115.00 | Main near-term resistance | Combines the displayed high with the next round-number barrier. |
| $114.60–$114.70 | Nearby resistance | Upper area of the consolidation following the initial surge. |
| $114.20–$114.30 | Initial support | Recent pullback zone where buyers returned. |
| $114.00 | Intermediate support | Round-number reference within the earlier advance. |
| $113.54–$113.70 | Lower support zone | Includes the displayed low of $113.542 and the base preceding the rally. |
UKOUSD is holding near the upper part of the visible range, although buyers have yet to establish a fresh breakout. Sustained trading above $114.60–$114.70 would bring the displayed high of $114.833 and the $115.00 barrier into closer focus.
On the downside, $114.20–$114.30 marks the most recent area where selling attracted renewed demand. Losing this zone would suggest a deeper retracement towards $114.00, with the earlier $113.54–$113.70 base becoming relevant if selling continues.
Bullish and Bearish Setups
| Scenario | Confirmation to Watch | Potential Levels |
| Bullish continuation | A sustained break above $114.70, followed by a test of $114.833–$115.00 | $115 initially; $120 becomes relevant if a broader advance develops |
| Bearish retracement | A break below $114.20 and a failed attempt to reclaim $114.20–$114.30 | $114.00, followed by $113.70–$113.54 |
The bullish scenario depends on UKOUSD breaking above $114.70 and holding that level, which would suggest buyers are gaining control after the recent consolidation. A sustained move beyond $115 could support a broader advance, with $120 becoming a longer-range reference if supply concerns intensify. A failed breakout followed by a decline below $114.20 would weaken this outlook.
The bearish scenario would gain strength if UKOUSD falls below $114.20 and struggles to recover above $114.20–$114.30. This would suggest the recent support zone is turning into resistance, potentially exposing $114.00.
Disclaimer
The price levels and market scenarios above reflect the author’s interpretation of the supplied 15-minute chart at the time of writing and do not represent financial advice or an official recommendation from VT Markets. Traders should conduct their own analysis and manage risk carefully.
UKOUSD Prediction: What’s Next?
UKOUSD could extend its advance if US–Iran tensions intensify, shipping delays worsen or confirmed damage reduces oil production and exports. Prices could retreat if negotiations improve, shipping conditions stabilise or supply proves more resilient than feared. An unexpected increase in US crude inventories could also weigh on sentiment, particularly if accompanied by signs of weaker fuel demand.
The next catalysts are developments involving the US and Iran, evidence of changes in physical oil flows and upcoming US inventory data. The EIA normally releases its Weekly Petroleum Status Report on Wednesdays at 10:30 a.m. US Eastern time, so traders should closely monitor this as well.
Trade UKOUSD with VT Markets
Oil markets remain sensitive to geopolitical developments, energy supply changes and economic data. For traders following UKOUSD, monitoring these developments alongside technical price levels can help provide context for changing market conditions.
With VT Markets, traders can access oil CFDs and respond to market movements through both long and short positions, depending on their market outlook.
VT Markets provides access to trading platforms including MetaTrader 5 (MT5), Web Trading and the VT Markets App, alongside charting tools and market analysis resources.
Start a live account with VT Markets and explore oil CFDs today.
Frequently Asked Questions
What is UKOUSD?
UKOUSD is a Brent crude oil cash CFD quoted in US dollars. It provides exposure to Brent price movements without ownership or delivery of physical oil.
Why is Brent oil trading above $114?
The latest chart shows UKOUSD at $114.578, against a backdrop of heightened US–Iran tensions and concern over the reliability of Middle East oil shipments.
Could UKOUSD reach $120?
Further escalation or sustained supply losses could support additional gains. However, buyers first need to overcome $114.833–$115.00. The $120 level remains a conditional psychological reference.
What support levels should traders watch?
Initial support sits around $114.20–$114.30, followed by $114.00 and the lower $113.54–$113.70 zone.
What could cause oil prices to fall?
Diplomatic progress, more reliable shipping, stronger supply or weaker demand could reduce upward pressure. Inventory data could also change expectations for market tightness.
Start trading now — click here to create your real VT Markets account.



