

Key Takeaways:
- A momentum indicator that compares an asset’s closing price to its high-to-low range over a set period, usually 14.
- It moves on a scale of 0 to 100. Readings above 80 are seen as overbought and readings below 20 as oversold.
- Two lines do the work: the %K line (the main line) and the %D line (its three-period average, also called the signal line).
- Traders watch it for crossovers, divergence, and possible turning points, not for exact tops or bottoms.
It is a built-in tool on MetaTrader 4 and MetaTrader 5, so it works on forex, gold, indices, and other CFD markets. Every price chart tells a story about momentum. The stochastic oscillator is one of the oldest and simplest tools for reading that story. It was built to answer a single, practical question: is the price closing near the top or the bottom of its recent range?
So what does a stochastic oscillator tell you? In plain terms, it measures the speed and strength behind a price move, not the price itself. When momentum starts to fade, the indicator often turns before the price does. That early hint is why so many CFD traders keep it on their charts.
This guide breaks the tool down from the ground up. You will learn how it works, how to read it, the best settings to start with, and how it stacks up against other popular momentum indicators. A few short calculations are included so the maths never feels heavy.
What Is The Stochastic Oscillator?
The stochastic oscillator is one of the most widely used momentum tools in technical analysis. The sections below cover what it is, what it measures, who created it, and whether it leads or lags the market.
What is it in Simple Terms?
It is a momentum indicator that compares an asset’s closing price to its high-to-low price range over a chosen number of periods. The result is plotted as a number between 0 and 100. Since it always stays within that range, it is known as a bounded oscillator.
The core idea is easy to grasp. A reading near 100 means the price is closing close to the top of its recent range. A reading near 0 means it is closing near the bottom. The tool does not measure the price level itself. It measures where that price sits inside its range.
What does it Measure?
The indicator measures closing momentum. The reasoning behind it is straightforward and still holds today:
- In an uptrend, prices tend to close near the high of the range.
- In a downtrend, prices tend to close near the low of the range.
- When that pattern starts to break, momentum may be shifting before the trend does.
So, a rising reading suggests buyers are in control. A falling one suggests sellers are taking over. It is a read on pressure, not a price forecast.
Who Developed It?
The indicator was developed by George Lane in the late 1950s. Lane, a technical analyst and trader, refined and popularised it, and his name is still tied to it in trading circles today.
One quick myth to clear up. The word “stochastic” here refers to the position of the current close within its recent range. It does not refer to statistical randomness, which is a common point of confusion for new traders.
Is it a Leading or Lagging Indicator?
It is generally treated as a leading indicator. Since it tracks momentum, it can flag a possible reversal before that reversal shows up clearly in price. That is its main appeal.
This is the opposite of a lagging indicator such as a moving average, which confirms a move only after it is under way. The trade-off is simple to remember:
- Leading indicators give earlier signals, but produce more false ones.
- Lagging indicators give later signals, but tend to be more reliable once they trigger.
How The Stochastic Oscillator Works
The stochastic oscillator looks complex at first, but the mechanics are simple once broken down. We’ll go through below how it works, the formula behind it, and the two lines you read on the chart.
How Does it Work?
It works by taking a look-back window, usually 14 periods, and finding the highest high and lowest low in that window. It then checks where the current close sits between those two extremes.
If the close is exactly halfway between the high and the low, the reading is 50. If it sits at the very top, the reading is 100. At the very bottom, it is 0. The line you see on your chart is simply that position, recalculated on every new candle.
What is the Formula?
The formula has two parts. The first builds the %K line, and the second smooths it into the %D line:
- %K = ((Current Close − Lowest Low) ÷ (Highest High − Lowest Low)) × 100
- %D = the three-period simple moving average of %K
A short worked example makes this clear. Imagine EUR/USD over the last 14 periods:
- Highest high: 1.1200
- Lowest low: 1.1000
- Current close: 1.1150
Plug those into the formula:
%K = ((1.1150 − 1.1000) ÷ (1.1200 − 1.1000)) × 100 = (0.0150 ÷ 0.0200) × 100 = 75
A reading of 75 tells you the close is sitting in the upper part of its range, but not yet in overbought territory. The %D line would then be the average of the last three %K values, giving a smoother signal line to compare against.
What are the %K and %D Lines?
These two lines are the heart of the indicator:
- The %K line is the main, faster line. It reacts quickly to price and can look choppy.
- The %D line is the slower signal line. It is a moving average of %K, so it smooths out some of the noise.
What is the Difference between the %K and %D Lines?
The simplest way to see the difference is side by side:
| Feature | %K line | %D line |
| Role | Main line | Signal line |
| Speed | Faster, more reactive | Slower, smoother |
| Built from | The raw formula | 3-period average of %K |
| Used for | Spotting momentum shifts early | Confirming and filtering signals |
When traders talk about a crossover, they usually mean the moment the %K line crosses the %D line. More on that shortly.
How To Read The Stochastic Oscillator
Reading the stochastic oscillator means combining a few simple signals rather than relying on any single one. The following breaks down the levels, the overbought and oversold zones, crossovers, and divergence.
How do You Read It?
Reading the indicator comes down to three things: the level of the lines, the way they cross, and how they line up against price. Most traders start with the level, because it is the easiest to spot.
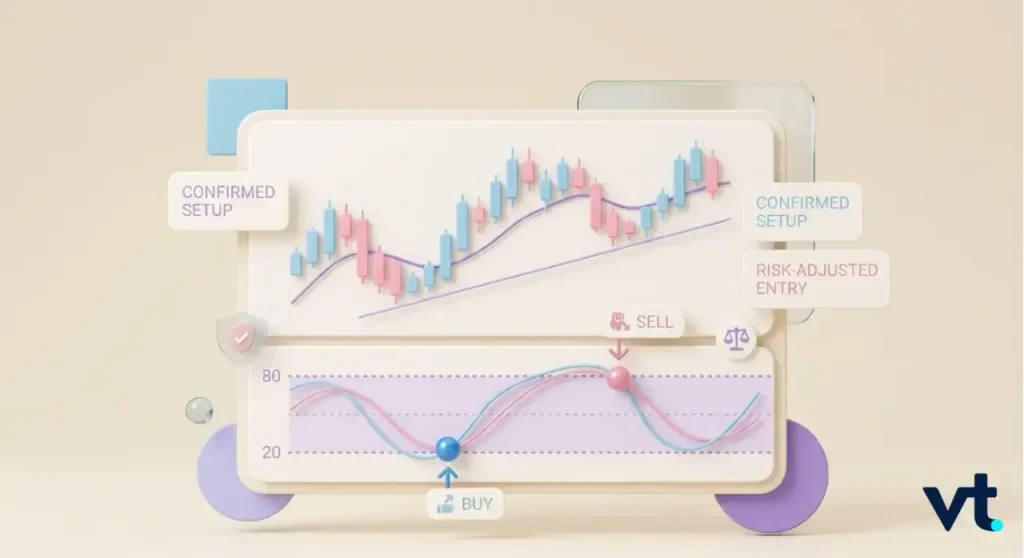
- Above 80: the market may be overbought.
- Below 20: the market may be oversold.
- Between 20 and 80: momentum is neutral, with no extreme reading.
What do Overbought and Oversold Mean?
Overbought does not mean “sell now,” and oversold does not mean “buy now.” They describe pressure, not instructions:
- Overbought (above 80) means price has risen quickly and may be due for a pause or pullback.
- Oversold (below 20) means price has fallen quickly and may be due for a bounce.
In a strong trend, the reading can stay overbought or oversold for a long time. That is why these zones are best used as alerts, not triggers on their own.
What do the 80 and 20 Levels Mean?
The 80 and 20 lines are the standard thresholds drawn on the indicator. They mark the edges of “normal” momentum. Some traders tighten them to 70 and 30 for more frequent signals, or widen them in very volatile markets to cut down on noise.
What is a Crossover?
A crossover happens when the %K line crosses the %D line. It is one of the most common signals traders watch for:
- A bullish crossover is when %K crosses above %D, often near the oversold zone.
- A bearish crossover is when %K crosses below %D, often near the overbought zone.
Crossovers that happen at an extreme tend to carry more weight than those that happen in the middle of the range.
What is Stochastic Divergence?
Divergence is one of the strongest signals the indicator offers. It appears when price and the lines disagree:
- Bullish divergence: price makes a lower low, but the indicator makes a higher low. Selling momentum may be fading.
- Bearish divergence: price makes a higher high, but the indicator makes a lower high. Buying momentum may be fading.
Divergence does not give exact timing, but it often warns that a trend is running out of steam.
Stochastic Oscillator Settings Explained

The stochastic oscillator has a few adjustable settings, and the right choice depends on your market, time frame, and trading style rather than any single best option. Let’s find out below the standard settings, the difference between the fast, slow, and full versions, and how to match the indicator to your timeframe.
What are the Standard Settings?
The default setting is 14, 3, 3. That means a 14-period look-back, a 3-period %K smoothing, and a 3-period %D. So what is the best setting for stochastic? For most beginners, the honest answer is to leave it on the default and learn how it behaves first.
- 14, 3, 3: the classic, balanced setting that suits most markets and time frames.
- 5, 3, 3: faster and more sensitive, which gives more signals and more noise.
- 21, 5, 5: slower and smoother, which suits longer-term charts.
What is the Difference between Fast, Slow, and Full Stochastic?
There are three versions of the indicator. They share the same idea but smooth the data differently:
| Type | How it behaves | Best suited to |
| Fast stochastic | Raw %K, very reactive and choppy | Experienced scalpers |
| Slow stochastic | Smoothed %K, fewer false signals | Most traders |
| Full stochastic | Fully adjustable smoothing | Traders who want to fine-tune |
The slow stochastic is the most widely used because it strikes a sensible balance between speed and reliability.
Which Time Frame Works Best?
There is no single best time frame. It depends on your trading style:
- Lower time frames (1-minute to 15-minute): more signals, more noise, suited to day trading.
- Higher time frames (4-hour to daily): fewer but cleaner signals, suited to swing trading.
A common pro-tip is to check the indicator on a higher time frame first to judge the wider trend, then drop to a lower one to time your entry.
How To Use The Stochastic Oscillator In Trading
The practical use of stochastic oscillator in practice means turning its signals into a repeatable workflow, from spotting a setup to managing the trade. The sections below cover the basic process, how to read buy and sell signals, and how to trade divergence.
How do you Use it in Trading?
Most charting platforms make the indicator easy to apply. On VT Markets, it is built into both MetaTrader 4 and MetaTrader 5, so you can add it to forex, gold, or index CFDs in a couple of clicks. The basic workflow looks like this:
- Add the indicator to your chart and keep the default 14, 3, 3 setting to start.
- Identify the wider trend on a higher time frame before looking for signals.
- Wait for the lines to reach an extreme zone, then look for a crossover to confirm.
- Always pair the signal with a stop-loss and a clear risk plan.
How do you Identify Buy and Sell Signals?
A clean signal usually combines a level and a crossover, ideally in the direction of the trend:
- Potential buy: %K crosses above %D while the lines are below 20 (oversold).
- Potential sell: %K crosses below %D while the lines are above 80 (overbought).
Signals that agree with the larger trend tend to be more reliable than those that fight it. A buy signal during an uptrend is stronger than a buy signal during a clear downtrend.
Here is a quick example:
Say gold (XAUUSD) is in a broad uptrend on the 4-hour chart. Price dips, the lines fall below 20, and then %K crosses back above %D at a reading of 18. That combination, an oversold reading plus a bullish crossover in the direction of the trend, is the kind of clean setup many traders wait for. A pro-tip is to ignore the opposite signals (overbought crossovers) while the higher-time-frame trend stays up, as they tend to be the weakest.
How do you Trade Stochastic Divergence?
Trading divergence takes patience, because it is an early warning rather than a precise trigger. A simple approach:
- Spot the divergence between price and the indicator.
- Wait for confirmation, such as a crossover or a break of a short-term level.
- Enter in the direction of the new momentum, with a stop just beyond the recent swing.
Used this way, divergence becomes a filter that improves the quality of your entries rather than a standalone signal.
Stochastic Oscillator Vs Other Indicators
The stochastic oscillator works best when you understand how it differs from other momentum tools and where each one has an edge. Compare it with the RSI, show how the two can work together, and look at how it pairs with the MACD.
Stochastic vs RSI: What is the Difference?
The stochastic oscillator vs RSI debate is one of the most common in technical analysis. Both are momentum oscillators bounded between 0 and 100, but they measure different things:
| Feature | Stochastic | RSI |
| Measures | Close vs high-low range | Speed of price change |
| Default period | 14, 3, 3 | 14 |
| Overbought / oversold | 80 / 20 | 70 / 30 |
| Best in | Ranging markets | Trending markets |
| Signal style | Crossovers and divergence | Level breaks and divergence |
In short, the stochastic often shines in range-bound conditions, while the RSI is frequently favoured in trends.
Can you use it alongside the RSI?
Yes, and many traders apply it with Relative Strength Index (RSI). Since they measure momentum slightly differently, they can confirm each other:
- When both point to the same condition, the signal is stronger.
- When they disagree, it is often a sign to stay out and wait for clarity.
The key is to avoid stacking too many indicators that say the same thing. Two complementary tools beat five overlapping ones.
Read more :What is RSI Divergence and How It Works
How does it compare to MACD?
A popular pairing is a stochastic oscillator and macd strategy, because the two tools complement each other well. The Moving Average Convergence Divergence (MACD) reads trend and momentum from moving averages, while the stochastic reads where price sits in its range.
- Use the MACD to confirm the direction of the wider trend.
- Use the stochastic to time entries within that trend.
Combining a trend-following tool with a range-based one is a classic way to filter out weak signals.
Limitations Of The Stochastic Oscillator
The stochastic oscillator is a valuable tool, but knowing where it falls short is what keeps it useful. Let’s look at how reliable it really is, its main limitations, and why it sometimes produces false signals.
Is it Reliable?
The indicator is a useful tool, but it is not a crystal ball. It is most reliable in ranging markets and least reliable in strong trends, where it can stay pinned at an extreme for long stretches. No single indicator should be used alone.
What are its Limitations?
It pays to know where the tool struggles:
- It can give false signals in strong, sustained trends.
- Overbought does not mean a top, and oversold does not mean a bottom.
- It works best when combined with trend analysis or another indicator.
- Very fast settings produce a lot of noise that can mislead beginners.
Why does it Give False Signals?
False signals usually appear when momentum stays strong. In a powerful uptrend, the reading can sit above 80 for a long time, firing repeated “sell” hints while price keeps climbing. The fix is to trade signals in the direction of the trend and to wait for confirmation rather than acting on the first reading.
Is The Stochastic Oscillator Right For You?
The stochastic oscillator suits a wide range of traders, but whether it fits you depends on your experience and trading style.
Is it Good for Beginners?
Yes. It is one of the friendlier indicators to learn, because its logic is visual and intuitive. A good way to start is on a risk-free demo account, where you can watch how the lines behave before committing real capital. VT Markets offers a demo environment for exactly this kind of practice.
Is it Good for Day Trading or Swing Trading?
It suits both, with a small tweak to the approach:
- Day traders often use faster settings on lower time frames for quick signals.
- Swing traders lean on the default settings on higher time frames for cleaner setups.
Whichever style you choose, the indicator works best as one part of a wider plan that includes trend context and disciplined risk management.
Frequently Asked Questions (FAQs)
What is the stochastic oscillator?
It is a momentum indicator that compares an asset’s closing price to its high-to-low range over a set period, usually 14. It plots a value from 0 to 100 and helps traders judge whether momentum is strengthening or fading.
What does the stochastic oscillator measure?
It measures where the current close sits within the recent trading range. A high reading means price is closing near the top of its range, while a low reading means it is closing near the bottom. This reflects the strength of buying or selling pressure.
What are the best settings for the stochastic oscillator?
The standard setting is 14, 3, 3, and it suits most markets and time frames. Faster settings like 5, 3, 3 give more signals with more noise, while slower ones like 21, 5, 5 smooth the line for longer-term charts. Beginners should start with the default.
What do overbought and oversold mean on the stochastic oscillator?
Overbought (above 80) means price has risen quickly and may pause or pull back. Oversold (below 20) means price has fallen quickly and may bounce. They are alerts to watch closely, not automatic buy or sell signals.
What is the difference between the stochastic oscillator and RSI?
Both are momentum oscillators, but they measure different things. The stochastic compares the close to its price range, while the RSI measures the speed of price changes. The stochastic often suits ranging markets, and the RSI suits trends.
Start Online CFD Trading with VT Markets Today
If you are ready to explore online trading, VT Markets provides access to tools and platforms to help you get started. Trade on powerful platforms like MetaTrader 4 (MT4) and MetaTrader 5 (MT5), designed for speed, reliability, and advanced trading features.
New to trading? You can practise risk-free with a VT Markets demo account before moving to a live CFD account. For ongoing support, our Help Centre offers educational resources and platform guidance to help you build confidence as you learn.
Open your account with VT Markets today and access secure, transparent, and competitive CFD trading across some of the world’s most popular markets.


