






Key Points
- WTI crude oil declined to $82.47 per barrel, its lowest level since late August, as rising US inventories raised concerns about weakening demand.
- US crude inventories increased by 3.4 million barrels, significantly exceeding expectations of just 58,000 barrels.
- Gasoline inventories rose by 5.2 million barrels, adding to concerns that petroleum supply is outpacing consumption.
- Rising Middle Eastern oil exports and expectations of a global supply surplus continue to weigh on crude prices, despite geopolitical tensions surrounding Iran and the Strait of Hormuz.
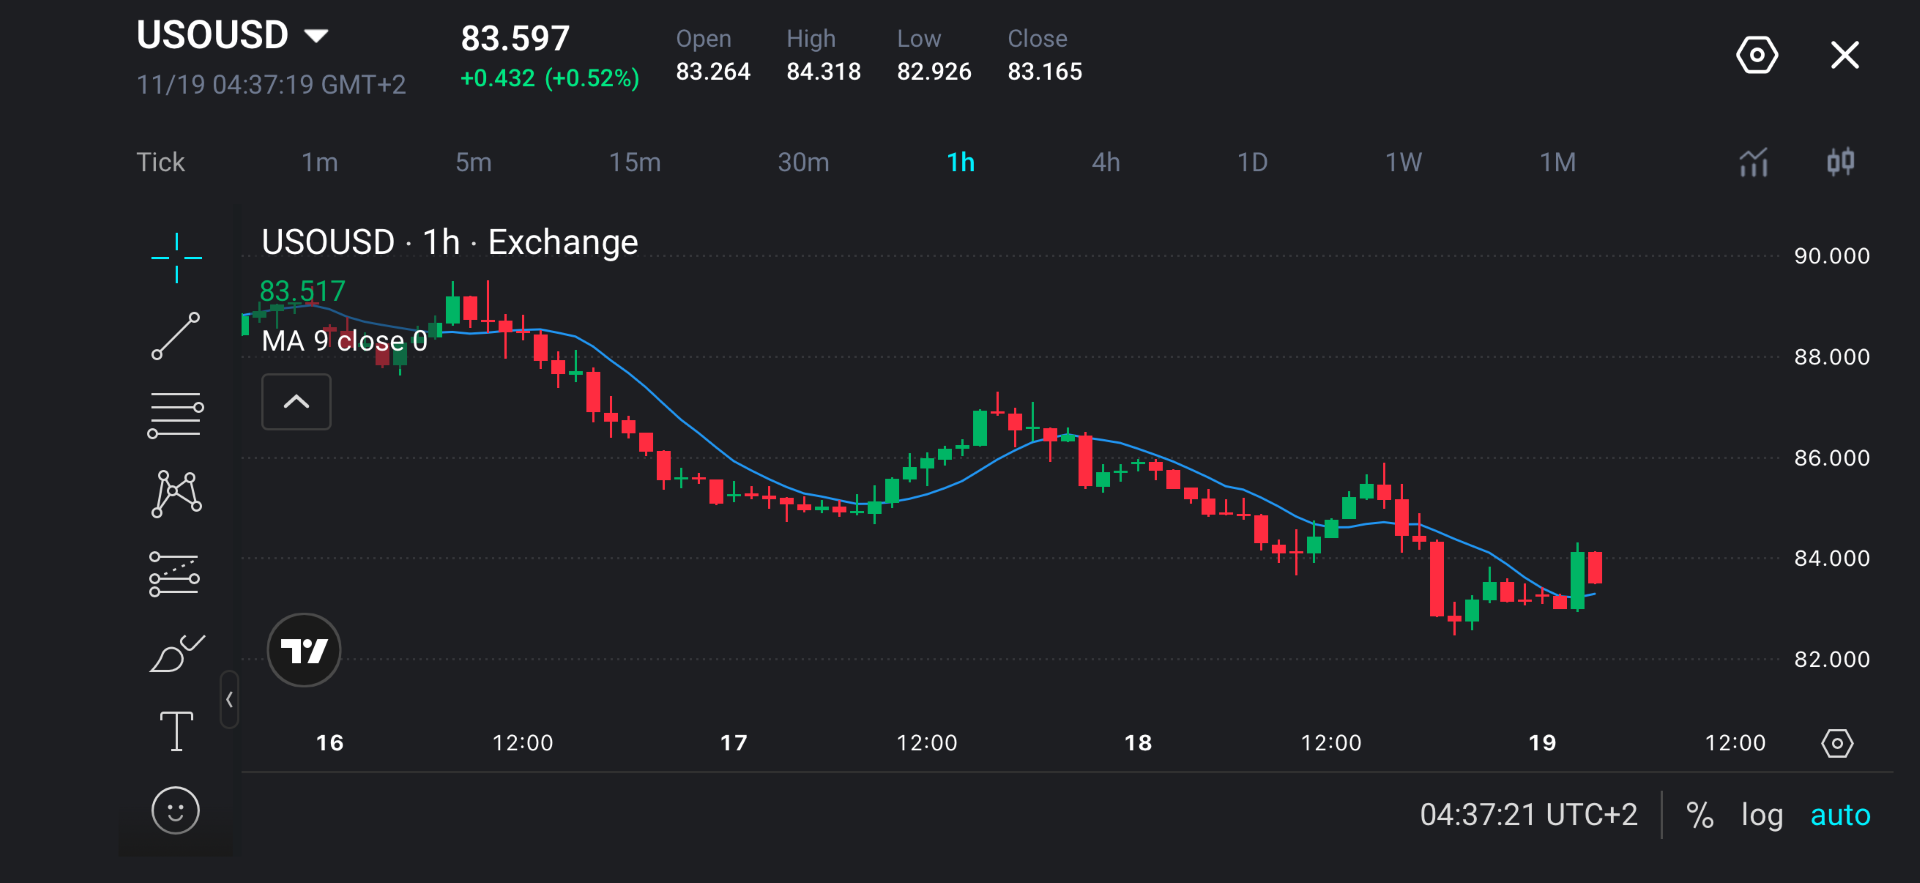
- USOUSD has recovered to approximately $83.60, according to the latest chart, but remains within a broader downtrend.
- Traders are watching support at $82.50–$83.00 and resistance around $84.00–$85.00.
Market Move
WTI crude oil fell to approximately $82.47 per barrel, extending its November decline as larger-than-expected US petroleum inventory builds intensified concerns about excess supply.
During its latest session, USOUSD is attempting a recovery, trading around $83.597, up 0.52%. Despite this, crude remains below earlier trading levels of $88–$89, suggesting that the broader downward trend has yet to reverse.
Why Traders Are Watching WTI Crude Oil’s Decline
The latest figures added to existing pressure from rising Middle Eastern oil exports. US crude inventories have increased by 3.4 million barrels, far exceeding market expectations of a 58,000-barrel rise. The unexpected build suggests that available crude supplies are accumulating faster than anticipated. Gasoline inventories also increased by 5.2 million barrels, reinforcing concerns about the balance between fuel consumption and available supply.
Geopolitical tensions involving Iran and the Strait of Hormuz continue to create uncertainty for global oil markets. Any disruption to tanker movements, regional exports or shipping infrastructure could restrict supply and push prices higher.
For now, oversupply concerns appear to outweigh the geopolitical risk premium.
Key Trading Levels
| Level | Significance |
| $86.00–$87.00 | Broader resistance zone associated with previous recovery highs. |
| $85.00–$85.50 | Secondary resistance near the earlier rebound and subsequent rejection area. |
| $84.00–$84.30 | Immediate resistance around the latest high of $84.318. |
| $83.00–$83.20 | Near-term support and potential retest area following the latest rebound. |
| $82.47–$82.93 | Recent downside support region, including the low. |
| $82.00 | Psychological support if selling pressure resumes. |
| $80.00 | Broader psychological downside target if the November decline extends. |
USOUSD is trading near $83.60, following a rebound from the $82.47–$82.93 region. The latest recovery has brought prices back towards the nine-period moving average, but the broader hourly structure continues to show lower highs and lower lows.
Bullish and Bearish Setups
| Scenario | Confirmation | Potential Outlook |
| Bullish recovery | USOUSD breaks above $84.00–$84.30 and establishes higher lows above the nine-period moving average. | Prices could recover towards $85.00–$85.50, with $86.00–$87.00 becoming a broader upside target. |
| Bearish continuation | USOUSD falls below $82.47 as selling pressure strengthens. | Prices could extend towards $82.00, followed by the psychological $80.00 level. |
A bullish recovery would require USOUSD to establish support above $83.00–$83.20 and develop a sequence of higher lows. A sustained break above $84.00–$84.30 could signal improving short-term momentum and open a recovery towards $85.00–$85.50. Further gains towards $86.00–$87.00 would require stronger buying momentum and a shift away from the prevailing pattern of lower highs.
The broader bearish outlook remains intact while USOUSD trades below its previous recovery highs. A break below $82.47 would indicate renewed downside pressure and increase the likelihood of a move towards $82.00. If sellers maintain control below this level, the psychological $80.00 threshold could become the next major downside target.
Disclaimer
The price levels and market scenarios above reflect the author’s assessment at the time of writing. They do not represent financial advice or an official recommendation from VT Markets. Traders should conduct their own analysis and manage risk carefully.
USOUSD Prediction: What’s Next?
Further inventory builds, rising OPEC+ production and stronger Middle Eastern exports could weigh on USOUSD. Additional signs of weaker fuel consumption or slowing economic activity in major oil-importing economies could also pressure prices.
Traders should monitor upcoming US Energy Information Administration (EIA) inventory reports, OPEC+ production announcements and International Energy Agency (IEA) demand forecasts. Changes in US dollar strength and Federal Reserve interest-rate expectations could also influence oil prices.
The next EIA weekly petroleum report is scheduled for 25 November 2026, providing another test for crude oil.
Trade USOUSD with VT Markets
Oil prices can react sharply to inventory reports, OPEC+ production decisions and geopolitical developments.
With VT Markets, traders can access oil CFDs and respond to market movements through both long and short positions, depending on their market outlook.
VT Markets provides access to trading platforms including MetaTrader 5 (MT5), Web Trading and the VT Markets App, alongside charting tools and market analysis resources.
Start a live account with VT Markets and explore oil CFDs today.
Frequently Asked Questions (FAQs)
Why did WTI crude oil prices fall?
WTI crude oil declined as larger-than-expected US crude and gasoline inventory builds reinforced concerns about excess supply and weakening demand.
Did US crude inventories exceed market expectations?
Yes. US crude inventories increased by 3.4 million barrels, exceeding the market forecast of just 58,000 barrels.
Are gasoline inventories also rising?
Yes. US gasoline inventories increased by 5.2 million barrels to 215.9 million barrels, exceeding expectations for a 1.6-million-barrel build.
Could geopolitical tensions push oil prices higher?
Yes. Disruptions to oil production or shipping routes, particularly the Strait of Hormuz, could restrict global supply and support higher crude prices.
Start trading now — click here to create your real VT Markets account.



