




Key Points
- All three major US stock indices fell more than 2% on Thursday. The Dow Jones Industrial Average declined 2.19%, the S&P 500 lost 2.02% and the Nasdaq Composite dropped 2.25%.
- US stock futures extended their losses overnight.
- Anthropic’s Nasdaq debut attracted strong investor interest, but its performance contrasted with weakness across the broader technology sector.
- Semiconductor stocks faced additional selling pressure. Nvidia declined more than 3%, extending its losing streak to six sessions, while AMD fell nearly 8% following allegations from short-seller Hunterbrook.
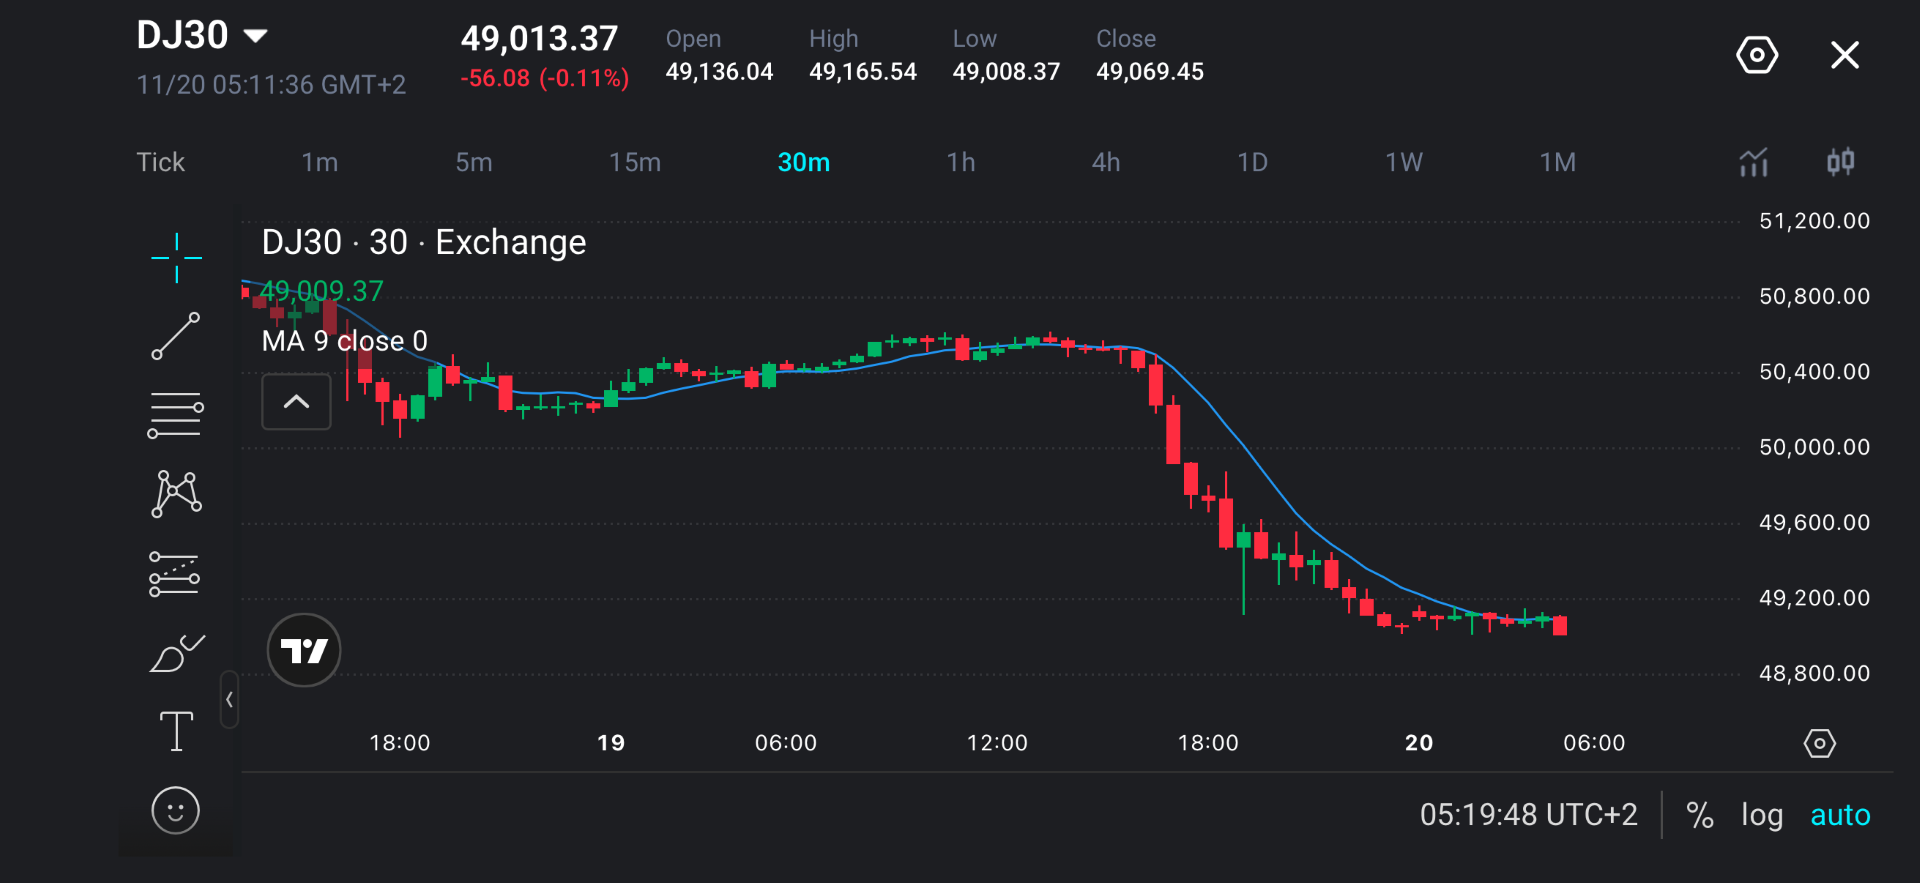
- The DJ30 is approaching the psychological 49,000 level, with its recent session showing a sustained decline, lower highs and limited buying momentum.
Market Move
US stocks fell sharply on Thursday as selling pressure spread across Wall Street, dragging the Dow Jones Industrial Average, S&P 500 and Nasdaq Composite more than 2% lower.
The Nasdaq Composite led the decline, losing 550 points as technology stocks faced another round of selling. The Dow Jones and S&P 500 also recorded substantial losses, reflecting weakness beyond the semiconductor sector.
| Index | Daily Change | Closing Level |
| Dow Jones Industrial Average | -2.19% | 49,097.06 |
| S&P 500 | -2.02% | 7,175.83 |
| Nasdaq Composite | -2.25% | 23,879.20 |
The sell-off continued into overnight futures trading, suggesting that investors remained cautious ahead of the next US trading session.
Why Traders Are Watching
The decline comes despite Anthropic’s much-anticipated Nasdaq debut, which attracted high interest in newly listed artificial intelligence companies. However, that enthusiasm did not extend across the technology sector.
Nvidia shares fell more than 3%, marking a sixth consecutive losing session despite the company’s recent upbeat revenue forecast. Advanced Micro Devices also declined nearly 8% after short-seller Hunterbrook disclosed a short position and raised concerns about the company’s business exposure in China.
The recent fall is not confined to AI-related stocks. The Dow Jones, which has a different sector composition from the technology-heavy Nasdaq, also fell more than 2%.
With all three major indices moving lower, the DJ30 provides a useful reference for assessing broader market sentiment. Its latest technical structure shows whether buyers are beginning to stabilise prices or whether the sell-off could extend into the next session.
Key Trading Levels
| Level | Significance |
| 50,400–50,500 | Major resistance near the previous consolidation area before the sell-off. |
| 50,000 | Major psychological resistance and potential recovery target. |
| 49,400–49,500 | Secondary resistance around an earlier consolidation area. |
| 49,150–49,200 | Immediate resistance near the declining nine-period moving average and recent lower highs. |
| 49,000–49,010 | Immediate support around the latest 30-minute lows. |
| 48,800 | Next downside reference if 49,000 fails to hold. |
| 48,500 | Broader psychological downside target if selling accelerates. |
The DJ30 is trading around 49,013, following a sharp decline from the 50,500–50,600 region.
The latest chart shows a sustained bearish structure, with consecutive lower highs and lower lows. The nine-period moving average has turned downward, while recent candles remain close to the session lows.
Although selling momentum has slowed near 49,000, there is little evidence of a sustained reversal, the declining nine-period moving average and the sequence of lower highs indicate that sellers retain control of the near-term trend.
Bullish and Bearish Setups
| Scenario | Confirmation | Potential Outlook |
| Bullish Recovery | DJ30 regains 49,150–49,200 and establishes higher lows. | A recovery towards 49,400–49,500 becomes possible, with 50,000 representing a broader upside target. |
| Bearish Continuation | DJ30 breaks below 49,000 and selling pressure strengthens. | Prices could extend towards 48,800, followed by 48,500 if broader market weakness persists. |
A bullish recovery would require the DJ30 to regain 49,150–49,200 and establish a sequence of higher lows. If buyers maintain the recovery, DJ30 could advance towards 49,400–49,500, where previous price activity may create resistance. A stronger reversal would require the index to regain 50,000, although the broader bearish structure would remain a concern until higher highs begin to develop.
The bearish outlook remains dominant while the DJ30 trades below its declining nine-period moving average. A sustained break below 49,000 would establish another lower low and suggest that selling pressure remains intact. Such a move could expose 48,800, followed by 48,500 if losses accelerate across the broader US equity market.
Disclaimer
The price levels and trade scenarios above reflect the author’s view at the time of writing and do not represent financial advice or an official recommendation from VT Markets. Traders should conduct their own analysis and manage risk carefully.
DJ30 Prediction: What Could Drive Prices Next?
Nvidia and AMD remain important stocks to monitor following their recent declines. Stronger semiconductor earnings expectations, renewed AI infrastructure spending commitments and improving investor confidence could support a recovery in the Nasdaq and S&P 500. However, concerns about the profitability of AI investment, elevated valuations and slowing demand for chips could extend the technology sell-off.
Investors will monitor Federal Reserve commentary and upcoming US economic releases for further guidance on interest rates. Minutes from the Fed’s October meeting emphasized concerns about inflation, while recent consumer and producer price data indicated persistent price pressures.
Upcoming corporate earnings, retail sales figures and manufacturing indicators could influence expectations for US economic growth. Resilient consumer spending and stronger corporate guidance may support the Dow Jones.
Trade DJ30 with VT Markets
The latest US stock market sell-off has brought renewed attention to the Dow Jones, S&P 500 and Nasdaq as traders assess changing market sentiment. With the DJ30 approaching important technical levels, traders can monitor price movements and explore opportunities across different market conditions.
VT Markets offers DJ30 through index CFDs, allowing traders to take positions on rising or falling prices without owning the underlying shares.
Gain access to global indices alongside forex, commodities, shares and other CFD markets through platforms including MetaTrader 5, Web Trading and the VT Markets App.
Explore DJ30 and other index CFDs with VT Markets.

Frequently Asked Questions (FAQs)
Why is the US stock market falling?
US stocks are declining amid concerns about AI investment returns, semiconductor valuations and the outlook for Federal Reserve interest rates. Selling pressure has spread across major sectors, pushing the Dow Jones, S&P 500 and Nasdaq lower.
How much did the Dow Jones fall?
The Dow Jones Industrial Average fell 2.19%, or 1,101 points, closing at 49,097.06 on Thursday.
Why is the Nasdaq falling despite Anthropic’s IPO?
Anthropic’s strong trading debut failed to offset selling pressure in established technology companies. Nvidia and AMD recorded substantial losses as investors reassessed semiconductor valuations and AI-related spending.
Is the S&P 500 also declining?
Yes. The S&P 500 declined 2.02% to 7,175.83, extending its losing streak to six consecutive sessions.
What could trigger a US stock market recovery?
Stronger corporate earnings, stabilising semiconductor stocks, lower Treasury yields and reduced expectations for further Federal Reserve tightening could support a recovery across major US stock indices.





