




Key Points
- New Zealand unemployment rose to 5.7% in Q3, its highest since 2015, while employment fell 0.1% from the previous quarter.
- The RBNZ held its Official Cash Rate at 2.75% in October, leaving traders to assess how labour-market weakness could affect its next decision.
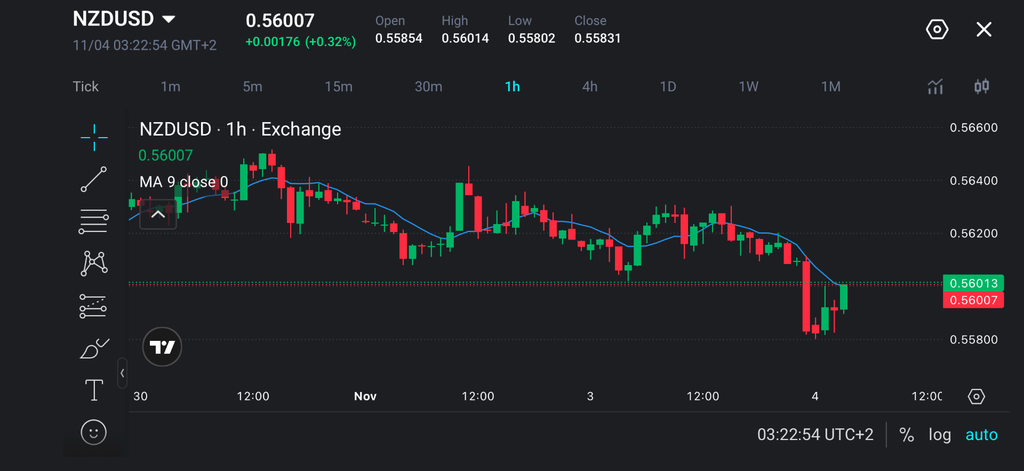
- NZDUSD recovered towards 0.5600 after testing 0.5580. A sustained recovery faces resistance at around 0.5620, followed by 0.5640–0.5655.
- Changes in RBNZ rate expectations, upcoming US ADP employment and ISM Services data are the next major market drivers.
Market Move
NZDUSD traded near 0.5600 on 4 November, recovering to around 0.56007 following an early decline. However, the pair continued to form lower highs, leaving the short-term trend bearish despite the rebound.
The move followed the Reserve Bank of New Zealand’s (RBNZ) decision to hold its Official Cash Rate at 2.75% in October. Attention has since shifted to whether incoming economic data will support further tightening in December.
Why Traders Are Watching
New Zealand’s unemployment rate rose to 5.7% in the September quarter, from 5.6% previously and above the 5.5% forecast. The increase pointed to continued labour-market weakness rather than the improvement economists had expected.
Employment contracted 0.1% quarter-on-quarter, while labour-force participation slipped to 70.4% from 70.6%. Unemployment therefore increased even as a smaller share of the population participated in the workforce, reinforcing signs of softer hiring conditions.
Annual private-sector wage growth, measured by the labour cost index excluding overtime, also slowed to 2.0%. Together, weaker employment and easing wage pressures could temper expectations for further RBNZ rate increases, potentially limiting support for the New Zealand dollar.
Key Trading Levels
| Level | Role | Significance |
| 0.5640–0.5655 | Major resistance | Previous highs form a broader barrier to a sustained recovery. |
| 0.5625–0.5630 | Intermediate resistance | Recent rebounds stalled around this area before selling resumed. |
| 0.562 | Initial recovery threshold | Reclaiming this level would recover part of the latest decline. |
| 0.5600–0.5602 | Immediate pivot | The rebound is testing this area near the nine-period moving average. |
| 0.5580–0.5585 | Immediate support | Contains the latest trough and the first area buyers need to defend. |
| 0.5565 | Lower support | A downside reference from the brief if the recent low gives way. |
NZDUSD experienced a sequence of lower highs, with price rebounding towards a declining nine-period moving average. That leaves 0.5600–0.5602 as the first test of whether buyers can sustain the bounce.
Holding above this area could open a move towards 0.5620. A stronger improvement would require a break through 0.5625–0.5630, while a loss of 0.5580–0.5585 would expose lower support.
Bullish and Bearish Setups
| Scenario | Trigger | Potential Levels |
| Bullish recovery | Sustained break above 0.5602, followed by support holding around 0.5600 on a retest. | 0.5620, then 0.5625–0.5630 |
| Bullish extension | Break above 0.5630, with higher lows developing. | 0.5640, then 0.5655 |
| Bearish rejection | Failure around 0.5600–0.5602, followed by a break below 0.5590. | 0.5585, then 0.5580 |
| Bearish continuation | Sustained break below 0.5580 and failure to reclaim the area. | 0.5570, then 0.5565 |
A bullish recovery could develop if NZDUSD sustains a break above 0.5602 and holds 0.5600 as support on a retest. This would suggest buyers are gaining control, potentially opening a move towards 0.5620, followed by 0.5625–0.5630. A further break above 0.5630, supported by higher lows, would strengthen the recovery and bring 0.5640 and 0.5655 into focus.
A bearish rejection could emerge if NZDUSD fails to clear 0.5600–0.5602 and then breaks below 0.5590. This would suggest the rebound is losing momentum, exposing 0.5585 and 0.5580. If selling continues below 0.5580 and the pair cannot reclaim that level, the decline could extend towards 0.5570, followed by 0.5565.
Disclaimer
The price levels and market scenarios above reflect the author’s assessment at the time of writing. They do not represent financial advice or an official recommendation from VT Markets. Traders should conduct their own analysis and manage risk carefully.
NZDUSD Prediction: What Could Drive the Pair Higher or Lower?
For NZDUSD, any reduction in expected New Zealand interest rates relative to US rates could weigh on demand for the kiwi. A recovery would become more likely if traders maintain expectations for tighter RBNZ policy while US rate expectations soften.
Upcoming US ADP employment and ISM Services data provide the next tests for the dollar. Stronger readings could support US yields and limit NZDUSD’s rebound, while weaker results could offer relief.
Trade NZDUSD with VT Markets
NZD/USD is among the major forex pairs available for trading with VT Markets. Traders can access currency markets through the VT Markets App, MetaTrader 4, MetaTrader 5 and other supported trading platforms.
With access to real-time charts, technical indicators and market analysis tools, traders can monitor movements in NZD/USD and assess how economic releases, interest rate expectations and central bank decisions influence currency prices.
Start a live trading account today and explore Forex pairs, gold and more.

Frequently Asked Questions (FAQs)
Why is NZDUSD under pressure?
Weaker New Zealand employment and slower wage growth could reduce expectations for further RBNZ tightening. If expected New Zealand rates fall relative to US rates, the kiwi could face additional selling pressure.
What is New Zealand’s latest unemployment rate?
New Zealand’s unemployment rate rose to 5.7% in Q3 2026, from 5.6% in the previous quarter, reaching its highest level since 2015.
What is the RBNZ’s current Official Cash Rate?
The RBNZ held its Official Cash Rate at 2.75% at its October decision.
What could push NZDUSD higher?
Weaker US data, softer US rate expectations or renewed expectations for RBNZ tightening could support the pair. A sustained recovery above 0.5620–0.5630 would strengthen the technical case.
Which US releases should NZDUSD traders watch?
ADP employment and ISM Services data are the next releases highlighted in the economic calendar. Surprises could affect the dollar through changes in US growth and interest-rate expectations.





