



Key Points
- IBM shares fell more than 25% after the company issued preliminary second-quarter results below market expectations.
- The stock closed near $217.07, marking its largest single-day decline in at least 58 years.
- IBM guided for second-quarter revenue of $17.2 billion, below analyst expectations near $17.86 billion.
- CEO Arvind Krishna said clients shifted spending towards servers, storage and memory, delaying software and mainframe-related deals.
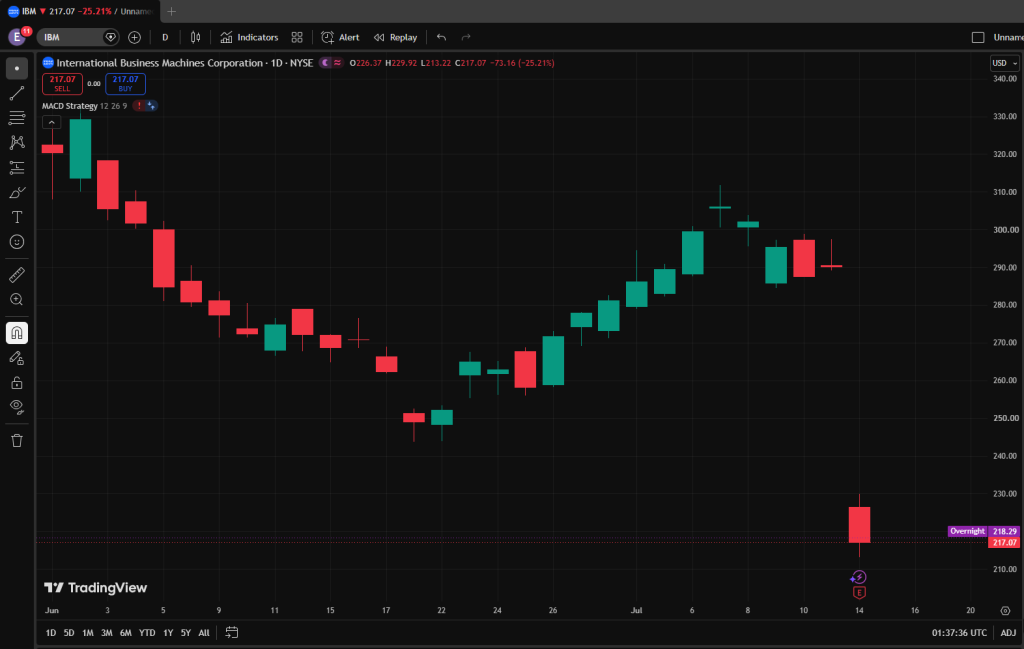
- The IBM daily chart places immediate resistance near $230, while $213 is the first support level to monitor.
IBM shares plunged on Tuesday after the company released preliminary second-quarter results that fell short of analyst expectations.
The stock closed near $217.07, down more than 25% on the day. The move erased roughly $69 billion to $70 billion in market value and marked IBM’s largest single-day decline in at least 58 years.
The sell-off came after IBM forecast second-quarter revenue of $17.2 billion, below analyst expectations of about $17.86 billion. Adjusted earnings are expected at $2.93 per share, also below estimates near $3.02.
The warning raised concerns that IBM’s turnaround has hit a major setback, especially as corporate technology budgets shift towards AI-related infrastructure.
Why Traders Are Watching IBM
Traders are watching IBM because the warning points to more than one weak quarter.
CEO Arvind Krishna said clients shifted spending towards servers, storage and memory purchases, partly to secure supply-constrained infrastructure ahead of expected price increases.That left less budget available for software and IBM’s mainframe-related infrastructure deals.
This matters because IBM has been trying to strengthen its higher-margin software business, including Red Hat, hybrid cloud and enterprise technology services. A weaker software outlook may raise questions about the durability of that strategy.
The market reaction also shows how sensitive technology shares have become to AI-related spending patterns. When corporate budgets move towards hardware and data-centre infrastructure, software companies may face delayed deal closures and weaker near-term demand.
AI Spending Shift Pressures Software Sentiment
IBM’s warning added to concerns that the AI boom is changing how companies allocate technology budgets.
AI adoption is increasing demand for chips, servers, storage and networking equipment. At the same time, some clients may delay spending on software, consulting and other enterprise technology projects.
Large deals also failed to close on expected timelines, driving much of the shortfall. IBM also pointed to rapidly evolving cybersecurity concerns, which distracted clients during the quarter.
This does not mean IBM’s software business is being replaced by AI. The more direct issue is budget reprioritisation. Clients are spending heavily on AI infrastructure, while some software and services decisions are being pushed back.
Broader Tech Shares Come Under Pressure
IBM’s warning also affected sentiment across the software and IT services sector.
Several software and IT services shares fell after IBM’s preliminary results missed expectations. Traders reassessed whether AI infrastructure spending could pressure broader enterprise software demand.
The sector reaction matters because IBM is a major enterprise technology company. When a large company reports delayed deals and changing client spending patterns, traders may apply similar concerns to other software, cloud and IT service names.
For IBM, the next question is whether the second-quarter warning reflects a short-term timing issue or a deeper shift in enterprise technology budgets.
Key Trading Levels
| Price Level | What Traders Are Watching |
| $300 | Wider recovery area before the earnings warning |
| $290 | Pre-warning close and major gap resistance |
| $270 | Mid-gap resistance if recovery improves |
| $250 | Psychological recovery level and former support area |
| $230 | Immediate resistance near the latest session high |
| $220 | Short-term recovery level above current price |
| $217 | Current chart area |
| $213 | Latest session low and immediate support |
| $210 | Round-number support below the current range |
| $200 | Deeper psychological downside level |
The IBM daily chart shows the stock trading near $217.07 after opening around $226.37. The latest session high stood near $229.92, while the low was approximately $213.22.
The chart shows a sharp gap lower from the previous trading range, with price failing to recover above $230 during the session.
Immediate resistance is located near $230, which aligns with the latest session high. A recovery above this level could bring $250 into focus.
A stronger rebound would require IBM to reclaim $250 and hold above it. That could shift attention towards $270, followed by the wider gap area near $290.
On the downside, $213 is the first support level to monitor. A break below this area could expose $210.
Bullish and Bearish Setups
| Setup | Trigger | Potential Market Reaction |
| Stabilisation Attempt | Hold above $213 to $210 | IBM may consolidate after the sharp sell-off |
| Bullish Recovery | Move above $230 | Stock may retest $250 |
| Recovery Extension | Break above $250 | Attention may shift towards $270 |
| Gap Recovery | Daily close above $270 | Wider gap area near $290 may come into focus |
| Bearish Continuation | Fall below $213 | IBM may retest $210 |
| Deeper Breakdown | Break below $210 | Downside may extend towards $200 |
The bullish recovery depends on IBM reclaiming $230 and holding above that level. This would suggest that selling pressure is starting to stabilise after the sharp earnings-warning sell-off.
A confirmed move above $250 would strengthen the recovery setup and bring $270 into focus. A wider recovery towards $290 would likely require stronger confidence in IBM’s full second-quarter results and management guidance.
The neutral scenario is consolidation between $213 and $230. This would suggest that traders are waiting for more detail from IBM’s upcoming second-quarter earnings release.
The bearish scenario strengthens if IBM falls below $213. A confirmed break could bring $210 into focus, followed by the psychological $200 level.
Disclaimer
The price levels and market scenarios above reflect the author’s view at the time of writing and do not represent financial advice or an official recommendation from VT Markets. Traders should conduct their own analysis and manage risk carefully.
Trade IBM CFDs With VT Markets
IBM remains active when earnings expectations, AI spending trends, software demand, infrastructure investment and broader technology sentiment move at the same time.
With VT Markets, traders can access IBM share CFDs alongside other US shares, forex, gold, oil, indices, ETFs and global CFD markets from one platform. This allows traders to follow IBM price action while also monitoring related moves in technology stocks, AI infrastructure names and broader equity sentiment.
Use VT Markets’ charting tools to monitor support, resistance, moving averages and breakout behaviour as the next IBM setup develops.
Create a live VT Markets account today to access our platform features, including market insights and educational content.
Why Trade IBM as a CFD?
IBM CFDs allow traders to take a view on rising or falling price movements without owning the underlying shares.
That flexibility can be useful when the stock reacts sharply to earnings warnings, analyst revisions, AI spending trends, software demand and broader technology sector sentiment.
If IBM breaks above resistance, traders can watch for a recovery setup. If price loses support, traders can monitor downside continuation as momentum weakens.
With VT Markets, traders can follow IBM price action in real time and compare it with other major CFD markets through one account.
What to Watch Next
IBM’s full second-quarter results will be the next major focus. Traders will look for more detail on software revenue, infrastructure demand, mainframe performance and delayed deal closures.
Management commentary will also be important. If IBM frames the shortfall as a short-term timing issue, the stock may attempt to stabilise. If the company signals a longer-lasting budget shift away from software, pressure may remain.
AI infrastructure spending is another key theme. Strong demand for servers, storage, memory and chips may support hardware suppliers, but it could continue to pressure software and IT services names if corporate budgets remain constrained.
Analyst revisions may also influence the next move. Downgrades, lower price targets or reduced earnings forecasts could keep IBM under pressure, while signs of confidence in the long-term turnaround may help limit downside.
For now, $213 to $230 is the main short-term range. A break above $230 could bring $250 into focus, while a move below $213 may expose $210 and $200.
Frequently Asked Questions
Why did IBM shares fall?
IBM shares fell after the company issued preliminary second-quarter results that missed analyst expectations. The company also warned that clients shifted spending towards servers, storage and memory, affecting software, infrastructure and mainframe-related deals.
How much did IBM stock fall?
IBM closed near $217.07, down more than 25% on the day. The move marked its largest single-day decline in at least 58 years.
What were IBM’s preliminary second-quarter figures?
IBM expects second-quarter revenue of $17.2 billion and adjusted earnings of $2.93 per share, both below analyst expectations.
How is AI connected to IBM’s warning?
The AI connection is mainly about spending priorities. Clients are allocating more budget towards AI infrastructure, including servers, storage and memory, which may delay spending on software and other enterprise technology projects.
What are the main IBM levels to watch?
Immediate resistance is near $230, followed by $250 and $270. Immediate support is near $213, followed by $210 and $200.
What could help IBM recover?
IBM may recover if full second-quarter results show that the shortfall is temporary, delayed deals close in later quarters, software demand stabilises or broader technology sentiment improves.










