




The US dollar retained much of its recent advance on Wednesday after stronger-than-expected US inflation shifted attention towards tighter Federal Reserve policy. Higher Treasury yields supported the currency as investors reassessed December’s interest-rate outlook, including the possibility of a larger increase. The sharp rebound has given way to a narrow consolidation, leaving traders watching whether buyers can sustain the recovery and retest the recent high.
Key points
- The US Dollar Index held onto its recent gains as rising Treasury yields and expectations of tighter Federal Reserve policy supported demand for the currency
- October US CPI rose 0.4% month-on-month, exceeding the 0.3% Reuters consensus forecast and strengthening expectations of a December Fed rate hike.
- Immediate resistance sits near 102.30, with 102.00 the main downside threshold and 103.00 a wider psychological upside reference.
Why worth watching
The dollar offers a broad view of how investors are pricing US monetary policy relative to other economies. Inflation above expectations can encourage markets to anticipate higher interest rates, increasing the appeal of dollar-denominated interest-bearing assets when expected returns rise relative to overseas alternatives. October’s report reinforced that concern, despite headline monthly inflation slowing from September. The Wall Street Journal reported that markets were considering a half-percentage-point December increase, while the 10-year Treasury yield traded around 5% during Tuesday’s bond sell-off.
The implications extend beyond the currency index. Continued dollar strength could pressure EURUSD and GBPUSD, although both also depend on domestic economic conditions and central bank expectations. Gold may face an additional headwind when a stronger dollar coincides with rising yields, increasing its cost for overseas buyers and the opportunity cost of holding a non-yielding asset. For USDX, the immediate focus is whether consolidation above 102.00 can provide a base for another test of 102.30.
Key trading levels
- At 103.00: A wider psychological reference if the rally extends. This level lies outside the supplied chart.
- At 102.30: Immediate resistance, rounded from the displayed high of 102.296.
- At 102.13: The approximate location of the 9-period EMA at the snapshot. This is a moving reference rather than fixed support.
- At 102.00: A psychological threshold within the recent recovery.
- At 101.60–101.65: An approximate chart-derived area around the consolidation preceding the sharp upward acceleration.
Use VT Markets’ tools to monitor support, resistance and momentum as the next USDX setup develops.
Technical analysis
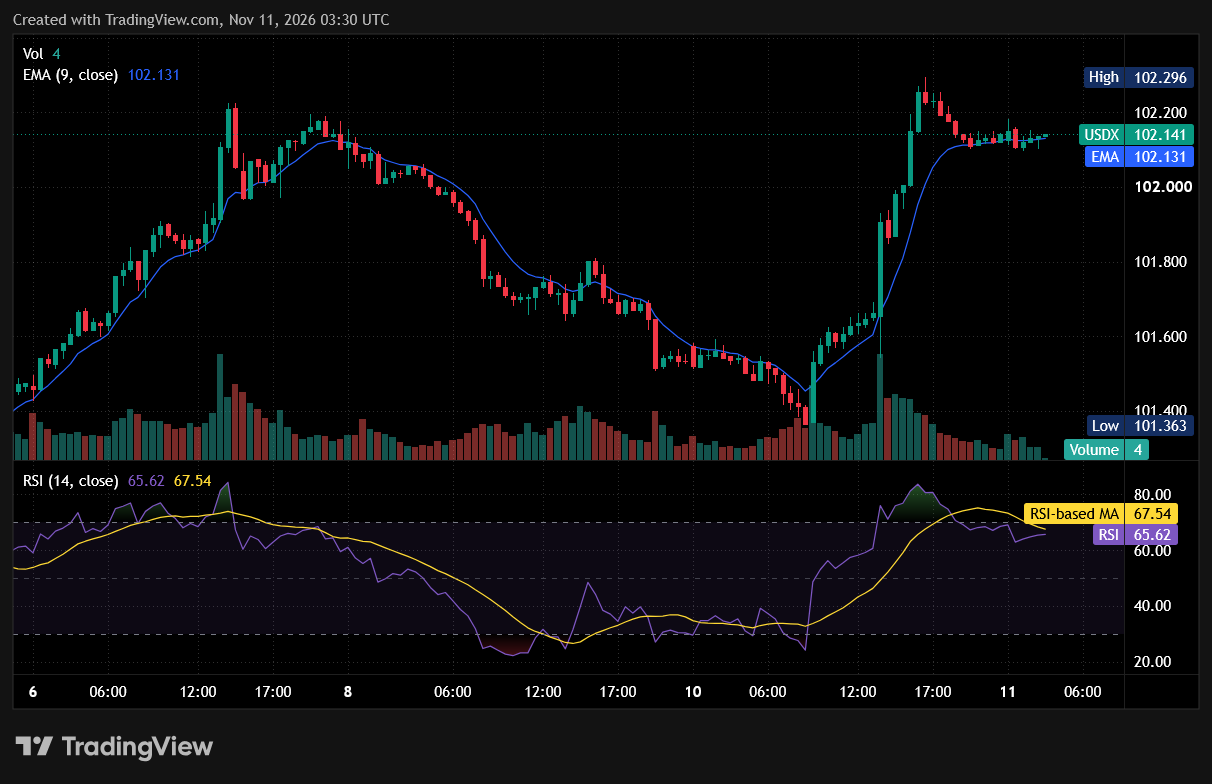
USDX recovered sharply from the lower part of the displayed range, reached 102.296 and then settled near 102.141. The latest candles are smaller and clustered around the short-term moving average, indicating a pause following the upward impulse.
Price remains marginally above the 9-period EMA at 102.131. However, the EMA is flattening, suggesting the initial acceleration has slowed. Its proximity to price means the separation alone provides limited evidence of renewed buying strength.
RSI (14) stands at 65.62, below its smoothing line at 67.54. Momentum remains above the neutral 50 level but has cooled from an earlier reading above 70. This is consistent with consolidation after a strong rally and does not, by itself, confirm a reversal.
The immediate technical range sits between 102.00 and 102.30. Acceptance above the upper boundary would suggest renewed upward momentum, while a loss of the lower boundary would indicate a deeper retracement of the recovery.
- Bullish scenario: A 30-minute close above 102.30, followed by sustained trading above that level or a successful retest, would strengthen the continuation case. The wider psychological reference would then be 103.00, rather than an immediate chart-derived target.
- Bearish scenario: A 30-minute close below 102.00, followed by an unsuccessful attempt to reclaim it, would weaken the recovery structure. Attention would shift towards the approximate 101.60–101.65 pre-acceleration area.
The price levels and trade scenarios above reflect the author’s view at the time of writing and do not represent financial advice or an official recommendation from VT Markets. Traders should conduct their own analysis and manage risk carefully.
What to watch next
The US Producer Price Index for October is scheduled for 13 November at 08:30 US Eastern Time. A stronger-than-expected report could reinforce concerns about persistent inflation, while softer data could temper tightening expectations. Traders will also monitor Treasury yields and Fed commentary for evidence that expectations of a larger December increase are strengthening or fading. Follow closely on our economic calendar.
Trade the US Dollar Index with VT Markets
VT Markets’ US Dollar Index CFD, identified as USDX, provides exposure to changes in the dollar index without ownership of the underlying currency basket. The instrument allows traders to follow broad dollar movements influenced by inflation, interest-rate expectations and relative economic performance.
Explore VT Markets’ index offering and check USDX specifications in the platform. Availability and trading conditions depend on the account and jurisdiction. CFDs use leverage, which can amplify losses as well as gains.
Tap for FAQ
What is happening to the US Dollar Index?
The dollar has strengthened as stronger-than-expected October inflation increased expectations of tighter Fed policy. The supplied USDX chart shows the rally pausing below 102.30.
What is the difference between the US Dollar Index and a USDX CFD?
The underlying index measures the dollar against a basket of currencies. USDX is the CFD label on the supplied VT Markets platform. Its quoted price can differ from other index feeds.
Can I trade the US Dollar Index with VT Markets?
VT Markets lists a US Dollar Index CFD, and the supplied platform identifies it as USDX. Check availability and contract conditions for your account and jurisdiction.
Explore all Index products at VT Markets
Trade US Dollar Index CFDs | Explore Shares CFDs | Open account today



