


Markets lived through a familiar yet no less jarring dance this April, as the Trump administration’s aggressive tariff announcement triggered a violent market selloff—only to retreat under pressure, once again reaffirming the existence of the so-called “Trump Put.” The term, drawn from the financial world’s “Fed Put” concept, refers to President Trump’s habit of reversing harsh policies once the stock market tanks hard enough to threaten political stability. April 2025 delivered perhaps the clearest and most dramatic modern example yet.
On April 2, 2025, the White House declared sweeping tariffs: a punishing 145% levy on Chinese imports affecting over $500 billion worth of goods, fresh taxes on imports from allies like Canada and Mexico, and vague but menacing threats toward European automakers. The market recoiled almost instantly. In just three trading days, the S&P 500 plunged by over 16%, collapsing from 6,090 down to 5,115. Months of bullish gains evaporated almost overnight
The fallout did not end there. Bond yields stayed elevated, with the 10-year U.S. Treasury stubbornly above 4.25%, flashing red lights across every risk dashboard. Retailers and manufacturers absorbed the brunt of the pain. Concerns of spiralling inflation and supply chain chaos sent shudders through every sector tied to consumer demand.
The pressure behind the scenes mounted just as quickly. Major CEOs, including those from Walmart, Target, and Home Depot, sounded alarm bells about impending empty shelves and higher prices. Treasury Secretary Scott Bessent urged President Trump to reconsider the sweeping measures, warning that economic instability could devastate election prospects. Meanwhile, consumers already feeling the pinch of rising prices stirred fears of political backlash.
Faced with cratering markets and political fire, the administration moved. On April 7, President Trump announced a 90-day delay on the majority of the new tariffs. By April 22, during a White House press conference, he confirmed that the 145% tariffs on Chinese goods would be “substantially” reduced—though not entirely eliminated. Treasury Secretary Bessent, in parallel remarks, acknowledged that the original tariff levels were unsustainable and predicted a slow de-escalation of trade tensions.
The reaction was immediate. The S&P 500 staged a sharp rebound, surging back 10% and stabilising around the 5,650 mark. The Volatility Index (VIX), which had shot up to a nerve-wracking 60 during the selloff, cooled down to 29 over the course of seven sessions. Even consumer confidence began to tick higher again, albeit cautiously.
The “Trump Put” narrative asserts itself most clearly when economic performance starts to sway political calculations. Market indices have long been cited by Trump as a scorecard for his presidency. This sensitivity, combined with a demonstrated willingness to adjust or delay policies that spook investors, builds a credible pattern traders can track. Investor expectations of a Trump Put have now become self-reinforcing, encouraging market participants to anticipate policy softening after sharp declines.
Yet the Trump Put comes with its own set of limits. It does not guarantee a full reversal of harmful policies. Verbal de-escalations can temporarily stabilise sentiment, but a lack of follow-through can reintroduce volatility later. Traders must remain cautious. A market rally sparked by verbal relief might fade if structural economic damage persists.
Looking ahead, the cautious forecast suggests traders should stay nimble. A steep 10–15% market drop within a few days could trigger renewed intervention, particularly if policy missteps coincide with rising consumer anger or pressure from the business elite. Monitoring public statements from key Trump advisers remains critical. Treasury Secretary Scott Bessent and figures like Howard Lutnick represent market-friendly influences, while Peter Navarro and Stephen Miller often drive more hardline, nationalist positions. Shifts in whose advice gains favor offer clues about potential pivots.
Sentiment indicators, especially the VIX, offer another layer of warning. A spike above 50 typically precedes intervention attempts. Likewise, rebounds in stocks tied to retail and industrial sectors—especially giants like Walmart and Home Depot—could serve as early signs that the Trump Put is activating once more.
Despite the volatility, the Trump Put phenomenon remains a powerful psychological safety net for markets in 2025. However, it demands that traders walk a careful line: seize opportunity during rebounds but remain alert to the reality that not every softening leads to true policy reversals. In today’s environment, flexibility and discipline are more vital than ever.
Market Movements This Week
Markets entered this week looking tired, with consolidation patterns stretching across major assets as traders hesitated ahead of key U.S. data and central bank commentary. The price action tells a story of nervous energy bottled just beneath the surface, waiting for a catalyst to trigger the next major move.
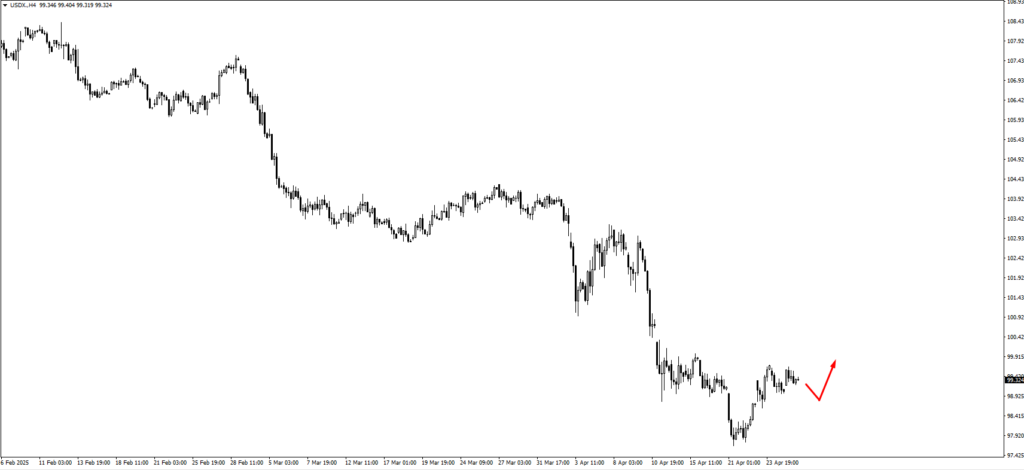
The U.S. Dollar Index (USDX) continues to consolidate. Traders are closely watching the lower bands at 98.80 and 98.50 for potential bullish setups if price softens. On the upside, 100.60 stands as a resistance zone to monitor if momentum returns to the greenback, particularly if the week’s economic prints undershoot expectations.
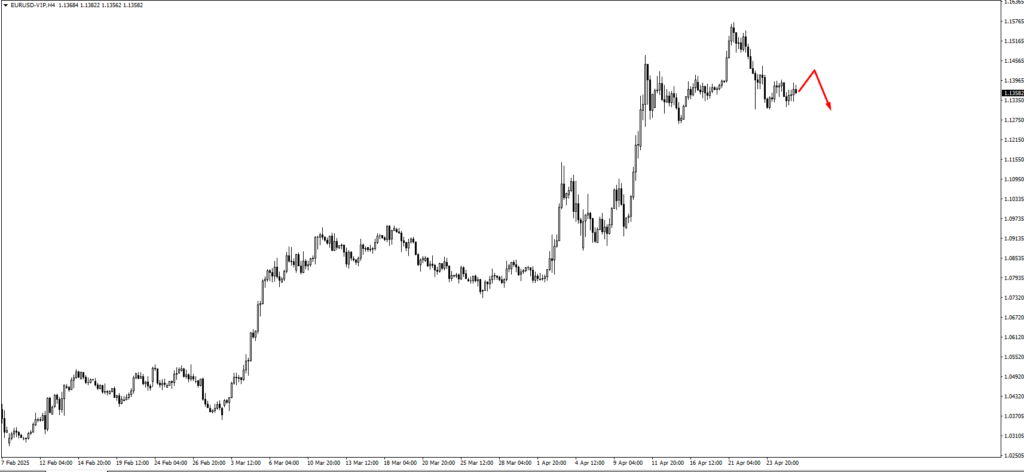
EUR/USD remains rangebound as well. Bears are ready at 1.1400 and 1.1470, levels where fresh selling could emerge if the euro tries to rally. On the downside, 1.1200 becomes the next target if growth data disappoints and risk sentiment weakens.
In the United Kingdom, GBP/USD is moving sideways, struggling to find direction. If price edges higher, traders are watching 1.3370 for potential selling pressure. On the other hand, a loss of momentum could drive a retest of the 1.3202 swing low, a key area where buyers may attempt to step back in.
The USD/JPY pair retraced slightly before moving higher but failed to reach the closely watched 141.95 level. If price resumes its climb, 144.60 will be the next resistance to test. However, if price consolidates or hesitates at 144.60, traders are preparing for a bearish response closer to 146.60.
USD/CHF rebounded from the 0.8235 support area earlier in the week. As it pushes higher, eyes are on 0.8380 for signs of exhaustion. Should price consolidate or falter there, another bearish wave could form toward 0.8530.
For the commodity currencies, AUD/USD has traded lower from the 0.6410 area. As the Aussie drifts downward, the focus shifts to 0.6295 for bullish setups. However, if price retraces back upward before testing 0.6295, bearish price action may reappear near 0.6460.
Similarly, NZD/USD is showing weakness after sliding from the 0.5990 area. If price moves lower, traders will look for buying opportunities at 0.5910 and 0.5870. If, instead, the kiwi rallies ahead of schedule, bearish setups may emerge around 0.6040.
USD/CAD is currently ranging, anchored around the 1.3830 support zone. If price climbs higher, watch for selling interest around 1.3910 and 1.3945. A breakdown, however, would put the 1.3755 area into play for possible bullish setups.
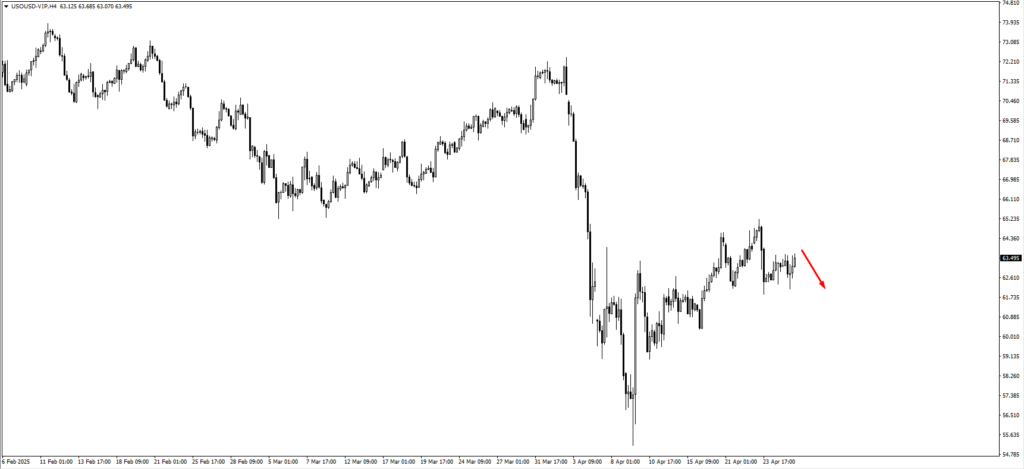
In commodities, U.S. Oil (USOil) is caught in a consolidation phase after recent volatility. Traders are monitoring 64.00 for bearish setups if price rallies, while 61.00 remains the key downside zone for bullish interest should oil weaken under renewed trade concerns.
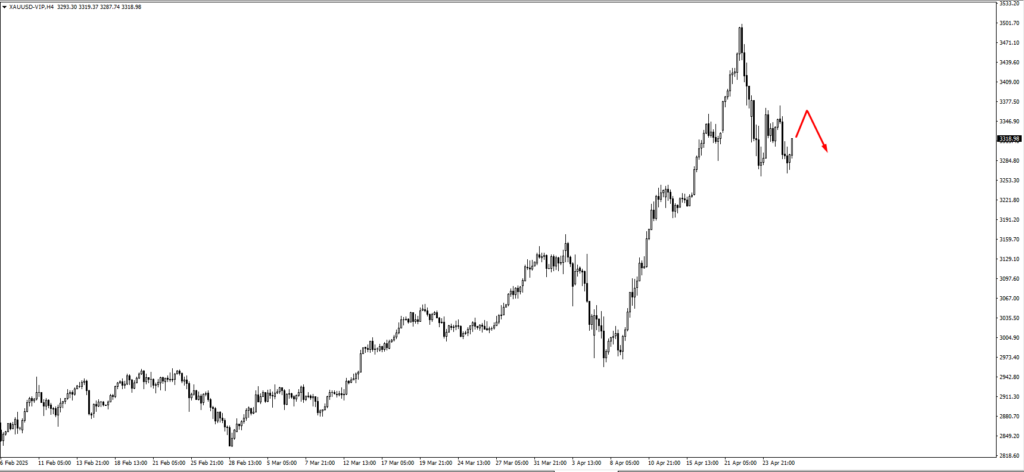
Gold (XAU/USD) has pulled back slightly after reaching the lower end of the 3390 monitored area. Price may consolidate further, but should gold rally again, 3350 and 3390 will serve as the next bearish checkpoints as traders gauge the balance between safe-haven demand and easing political tensions.
The S&P 500 remains precarious, even as it edges higher. 5610 is the next major resistance to watch. A failure to break above this could trigger renewed selling, particularly if incoming U.S. data—such as JOLTS openings or GDP growth—disappoints market expectations.
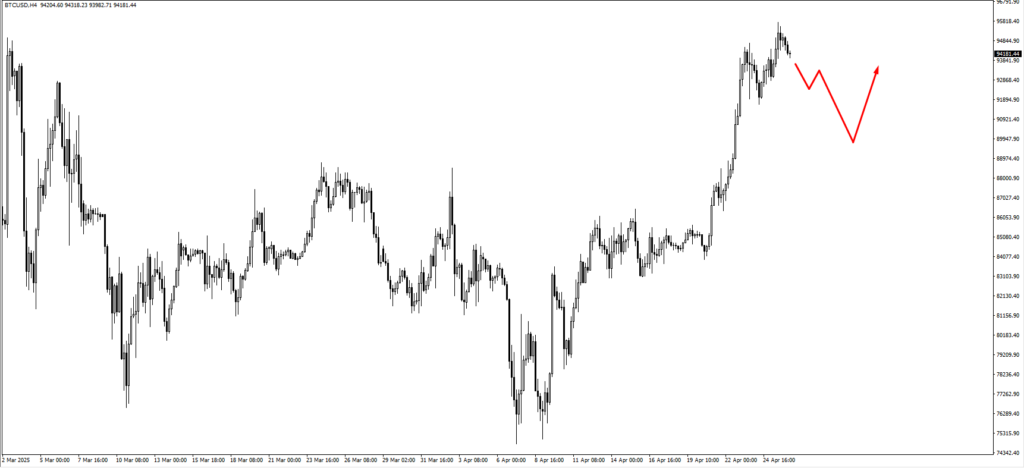
In the crypto space, Bitcoin remains choppy but resilient. If BTC forms a broader consolidation base, a bullish move toward 89,300 could materialize. Should momentum build, the next upside target would shift to 98,300, but only if broader market volatility stays contained.
Lastly, Natural Gas (Nat Gas) shows tentative strength after bouncing from the 2.80 zone. If the rally lacks conviction, traders are prepared to look for bullish entries again around 2.55, particularly if colder weather forecasts or storage data tighten supply expectations.
Key Events This Week
This week’s economic calendar may be lighter in volume but carries heavyweight risks for the market.
By Tuesday, April 29, focus shifts to the U.S. with the release of the JOLTS Job Openings report. Forecasts project openings at 7.48 million, slightly lower than the 7.57 million previously recorded. If job openings fall faster than expected, markets may interpret it as a signal that labour demand is cooling, fueling fresh bets on future Fed rate cuts and likely pressuring the USDX downward.
Wednesday, April 30, packs the most critical data cluster. Australia releases its CPI y/y, with inflation expected to dip to 2.3% from the previous 2.4%, reinforcing expectations that the RBA will remain cautious. Canada’s GDP m/m reading will also be scrutinized after a prior print of 0.4%, though structural factors mean traders will be more reactive to trend shifts than single data points. For the U.S., the spotlight falls squarely on the Advance GDP q/q, forecasted at a meager 0.4%, a dramatic slowdown from the previous 2.4% pace. Combined with a forecasted Core PCE Price Index m/m reading of just 0.1% versus the previous 0.4%, these reports could reignite recession fears and drag the dollar lower if confirmed.
Thursday, May 1, sees attention turn to Japan. The Bank of Japan’s Policy Rate decision is due, with no change expected. However, traders will be combing through the Bank’s language for any signs about when the next rate hike might come, especially as inflationary pressures slowly seep into Japan’s economy.
The week closes on Friday, May 2, with another major U.S. event—the release of Non-Farm Employment Change and the Unemployment Rate. Non-Farm Payrolls are forecast to print at 129,000, well below the previous 228,000, signaling a potential cooling in the labour market. The Unemployment Rate is forecast to hold steady at 4.2%, but any upside surprise could spark a sharp re-pricing of Fed policy expectations heading into mid-year.


