
For decades, the U.S. borrowed with confidence, backed by global demand for its bonds and trust in the dollar. But that confidence is starting to strain. With debt crossing $36 trillion and interest payments swelling fast, the cost of borrowing no longer hides in the background. It’s centre stage, and markets are taking notice.
The U.S. government now pays an average interest rate of 3.289% on its debt, a number that reflects a blend of short-term bills, medium-term notes, and long-dated bonds. That may not sound catastrophic on its own, but context changes everything. The national debt sits at $36.18 trillion, while GDP hovers around $29.18 trillion. Every 1% increase in interest rates now adds $361.8 billion to the annual cost of servicing that debt.
Interest payments aren’t a minor line item anymore; they’re starting to compete with major programs like defence and Medicare. In FY2024, interest costs already hit 3.0% of GDP, inching toward the modern-era peak of 3.2% set back in 1991. The Congressional Budget Office (CBO) expects these costs to climb to 4.1% by 2035 under current law. If average rates rise to 5.8% by 2054, the debt-to-GDP ratio could spike to 217%, which is 50 percentage points above the CBO’s baseline scenario.
That’s not just theoretical. If the 10-year Treasury yield holds above 6%, annual interest payments could hit $2.1 trillion—roughly 7% of GDP. Most economists agree that crossing the 5% threshold would be a red flag. At that point, interest costs start crowding out other spending, and the government may need to borrow just to keep up with its interest bill—a classic sign of a debt spiral.
Blast from the Past
Looking back helps frame the risk. In the 1980s, the Fed raised rates aggressively to combat inflation, and 10-year yields soared past 10%. But back then, debt levels were lower—just 30% of GDP—so the impact was manageable. By the 1990s, with debt rising to 50% of GDP, interest costs pushed political leaders to act. Budget deals followed, and discipline returned, at least temporarily.
From 2010 to 2021, record-low rates gave the illusion of safety. The U.S. could borrow more without obvious pain. But that illusion has now faded. As the Fed tightens, the real cost of America’s debt is coming into view, and the pressure is building fast.
Domestically, the U.S. still has options. About 70% of its debt is held by American investors, including the Federal Reserve. That offers some stability—but not without trade-offs. Relying too much on domestic buyers risks squeezing out private investment. If the Fed steps in to buy more Treasuries, it risks reigniting inflation and weakening the dollar. That strategy helped during COVID-19, but overusing it could erode credibility.
So what happens if yields keep rising? If the 10-year pushes past 5.5%, the pressure on fiscal policy becomes real. A future Trump administration, with voices like Scott Bessent behind it, could turn to spending freezes, tax shifts, or even debt restructuring. Stretching out maturities to lock in rates is one idea. So is using tariffs or capital repatriation to generate revenue. But these solutions come with risk—and rely heavily on market trust.
Bessent argues that strong GDP growth could save the day by boosting tax revenue. That’s true in theory, but growth alone won’t solve the problem if rates stay high or if inflation keeps biting. Markets will want to see real reform—not just hope.
Where Do We Go From Here?
All of this filters directly into markets. Rising yields make stocks less attractive by increasing the discount rate on future earnings. If interest costs exceed 5% of GDP, risk assets could face deeper pullbacks. Equity valuations will need to adjust to this new rate regime, especially in growth sectors that rely on cheap capital.
For the U.S. dollar, it’s a balancing act. Higher yields can attract capital in the short term, but if debt begins to look unsustainable, that flow could reverse. A weaker dollar would lift import prices and push inflation higher—exactly what the Fed wants to avoid.
The message is clear: the U.S. can still fund its debt, but the space to do so without consequence is shrinking. Fiscal responsibility is no longer a long-term debate—it’s a near-term market driver. And with core inflation data and GDP updates due later this week, the market is already lining up to test that theory.
Key Movements of the Week
Even as macroeconomic pressure from rising debt weighs on long-term sentiment, this past week’s price action tells a story of consolidation, breakout, and wary momentum across key assets.
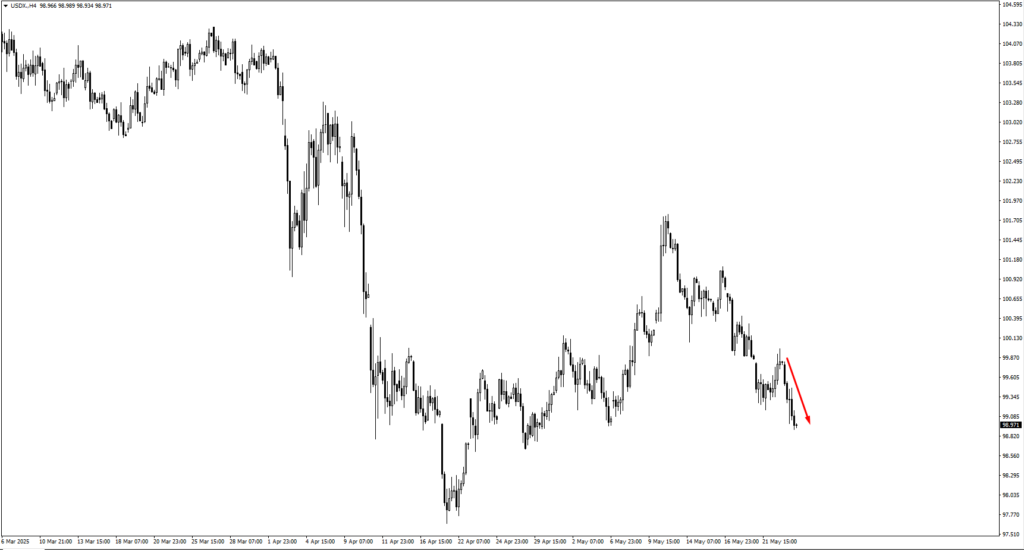
The US dollar index (USDX) continued to retrace from the 100.15 region, a monitored supply zone that has acted as resistance before. Prices pushed lower toward the 98.30 support level. With the dollar caught between yield appeal and structural doubts, a test of 98.30 may prove decisive. If support holds, the dollar could see a technical bounce. If broken, the path toward deeper correction would open, especially if bond yields soften or inflation surprises to the downside.
EUR/USD rallied cleanly from 1.1240, a key support area marked in the previous sessions. Traders will now be watching the 1.1470 level. Momentum remains cautiously bullish in the pair, with structural strength supported by weaker dollar expectations. However, further upside may require confirmation from Thursday’s U.S. GDP and Friday’s Core PCE release. A softer print could reinforce the breakout structure, while a surprise to the upside may introduce volatility.
GBP/USD extended its bullish move this week. As price climbs, attention turns to potential resistance zones at 1.3595 and 1.3670. Given the pair’s sensitivity to interest rate guidance, Friday’s speech by BOE Governor Bailey could trigger a technical reaction. Traders are advised to watch for signs of bearish reversal near these levels, especially if the dollar finds temporary support or if U.K. inflation commentary shifts tone.
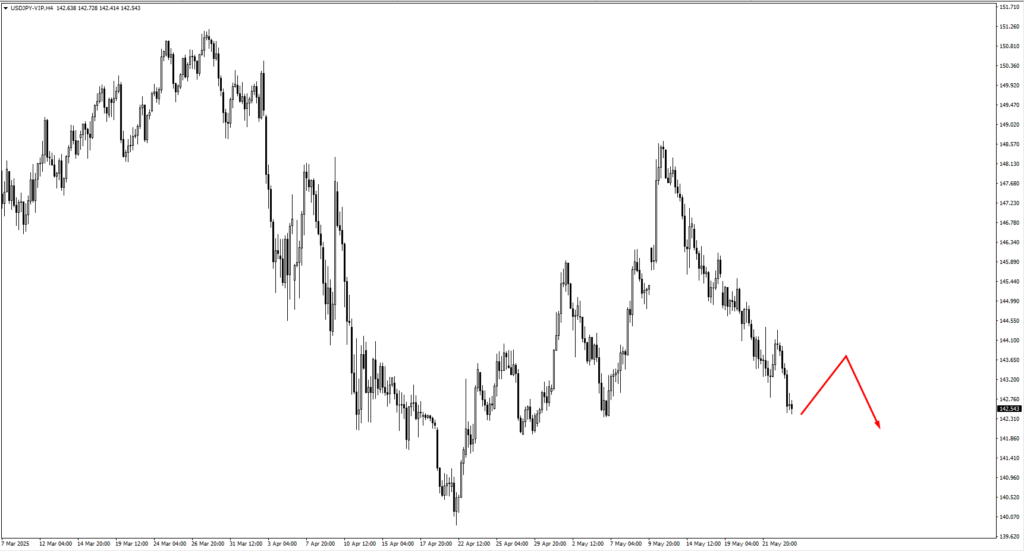
USD/JPY remains in a phase of consolidation. The pair has not made an impulsive move yet but is approaching resistance levels at 143.30 and 143.80. These zones will act as decision points. A slow crawl into them followed by bearish engulfing or evening star patterns could signal short setups. However, if the move into resistance is impulsive and backed by rising U.S. yields, sellers may want to remain patient.
USD/CHF has drifted downward but fell just shy of the 0.8330 support level. As it retraces upward, resistance is expected at 0.8255 and 0.8280. These could offer setups for bearish continuation if price stalls. However, the impulse into these levels will determine entry quality—if price moves up strongly, fade setups may lack edge.
AUD/USD is now trading near monthly highs. The pair has been supported by rising commodity demand and a broadly softer USD. If the market consolidates at these highs, the 0.6460 zone becomes important for fresh bullish price action setups. Bulls will want to see a controlled pullback into that region, followed by confirmation before reengaging.
NZD/USD has broken out from its range. If it pauses to consolidate, 0.5950 will be a level to watch for bullish price action. The Reserve Bank of New Zealand’s upcoming cash rate decision could inject volatility midweek. Traders should be cautious ahead of that release, especially if the pair trades aggressively into resistance without consolidation.
USD/CAD slid just beneath the 1.3920 resistance zone. If the pair retraces higher in coming sessions, 1.3810 becomes a likely area for bearish setups. The loonie remains sensitive to oil price dynamics, so crude movement may further influence the direction of this pair.
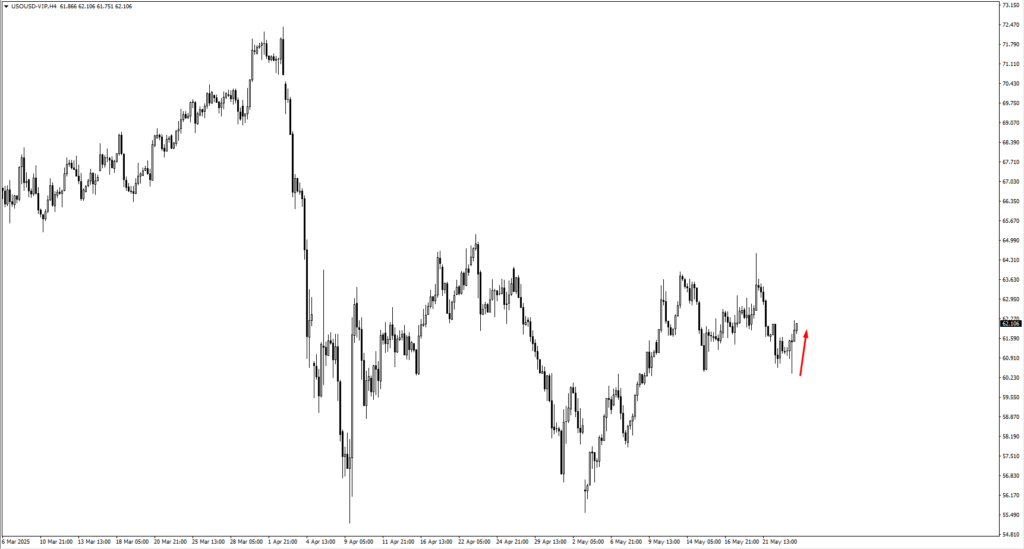
In commodities, crude oil (USOil) moved up impulsively from the 60.20 zone. Current structure suggests further upside is possible if price can break above the 64.534 level. A clean impulsive breakout would reinforce the trend. However, any sign of consolidation at this stage may imply exhaustion rather than strength. If price begins to stall beneath resistance, the odds of a deeper pullback increase.
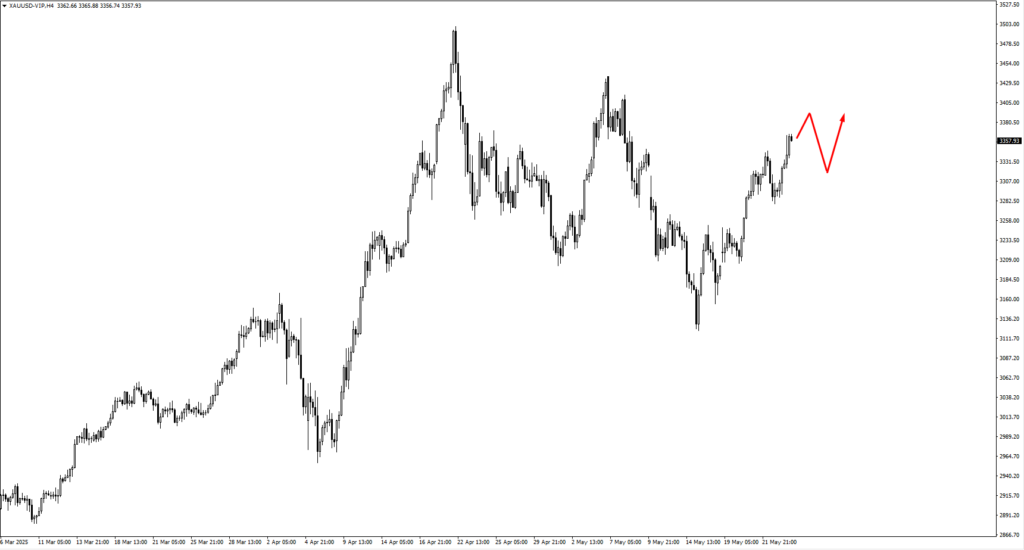
Gold climbed higher this week, ignoring the previously monitored 3220 level on its way up. Now, traders eye the 3400 resistance zone. If price reaches this level and begins to retrace, the 3305 area could provide a new staging ground for bulls to re-enter. Any retest of that level would need to show clear bullish price action, especially in response to inflation data on Friday.
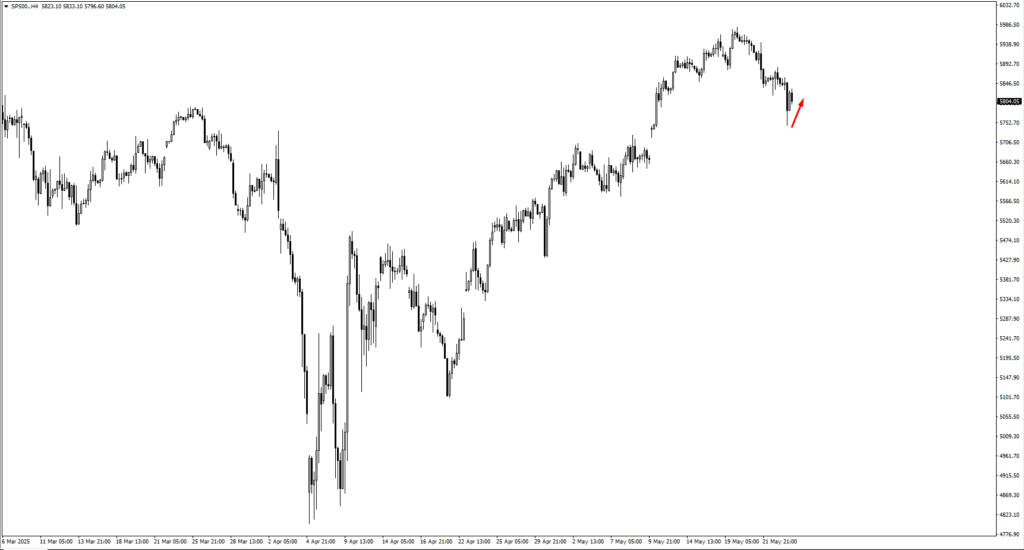
The S&P 500 continues to recover, pushing up from the 5740 zone. If price pulls back again, 5690 would be the key level to watch for fresh bullish setups. A clean move higher could bring 6100 into view as the next target. However, rising Treasury yields and policy noise could make gains harder to sustain. Traders should stay adaptive.
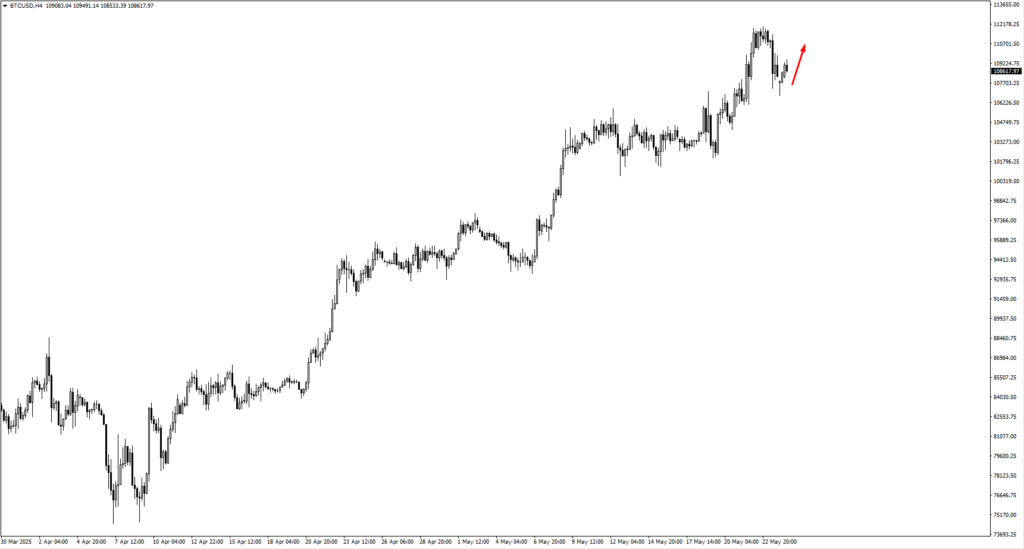
Finally, Bitcoin remains elevated. If price moves higher, the 113,500 and 123,000 zones will be important to monitor for resistance. Institutional demand and risk-on appetite remain in play, but given how overheated the crypto space has become, chasing new highs without confirmation could be risky.
This week will offer further clarity. GDP and inflation data from the U.S., along with central bank communication from both the RBNZ and BOE, may inject renewed volatility. While the structure in most assets remains technically sound, macro crosswinds remain active. Traders would do well to treat consolidation zones with care and avoid assuming directional conviction until key areas are tested with clean price action.
Key Events of the Week
Wednesday, May 28 brings the first real event of the week. The Reserve Bank of New Zealand is expected to cut its official cash rate from 3.50% to 3.25%. If NZD/USD hasn’t already broken the 0.60238 high earlier in the week, the release could spark a retracement. If the breakout is confirmed, however, a dovish tone from the RBNZ could accelerate the next leg lower. Either way, traders are watching closely for a clean reaction before stepping in.
On Thursday, May 29, attention turns to the U.S. Preliminary GDP data. Forecasts expect -0.3%, the same as last quarter. It won’t surprise the market, but internal details—especially consumer spending and business investment—could set the tone for Friday’s inflation print. Traders are likely to stay cautious, letting price digest the number before making big directional bets.
Friday, May 30 is the big one. Bank of England Governor Andrew Bailey speaks in the early session. With GBP/USD testing resistance near 1.3595–1.3670, his tone could make or break a breakout. A hawkish lean might push the pound higher, while a dovish or measured tone may send it back down into range.
Later, the U.S. Core PCE Price Index is released. Forecasted at 0.10%, up from 0.00%, the reading could rekindle concern about sticky inflation. If the number beats expectations, Treasury yields could rise again—and with them, the dollar. Equities, especially growth names, may struggle to hold gains into the weekend.
Finally, China’s Manufacturing PMI drops into the late session, with a forecast of 49.5, just above the previous 49.0. Still below the 50.0 expansion line, the data may weigh on sentiment if it underperforms. Traders watching AUD and NZD will be especially alert for any signs of a slowdown in Chinese demand.
It’s a week that starts slow and ends with pressure. For traders, patience will be key. The best opportunities may come late—after the dust settles from a data-heavy Friday.


