


The United States has maintained a confident borrowing stance for decades, underpinned by global trust in the U.S. dollar and robust demand for Treasury securities. This confidence is starting to display signs of strain. With the national debt exceeding $36 trillion and interest payments increasing significantly, the real cost of this debt is no longer merely a secondary issue; it has become a central focus of both economic policy and market attention.
The U.S. government pays an average interest rate of 3.289% on its debt. While that figure may not initially raise alarms, the broader context reveals significant strain. The national debt is $36.18 trillion, against a GDP of approximately $29.18 trillion. This means every 1% rise in interest rates now adds roughly $361.8 billion to annual interest expenses. Such payments are increasingly competing with essential budgetary allocations like defense and Medicare.
In fiscal year 2024, interest costs accounted for 3.0% of GDP—edging closer to the 3.2% peak in 1991. Projections from the Congressional Budget Office (CBO) suggest that the debt-to-GDP ratio could increase to 4.1% by 2035 if current policies remain unchanged. If average interest rates rise to 5.8% by 2054, the debt-to-GDP ratio may soar to 217%, which is 50 percentage points higher than baseline estimates. Furthermore, if 10-year Treasury yields stabilize above 6%, annual interest payments could exceed $2.1 trillion, or about 7% of GDP, heightening the risk of entering a classic debt spiral.
Back in time
Looking back helps frame the risk. The Federal Reserve aggressively raised interest rates to combat inflation, with 10-year Treasury yields soaring past 10%. But the debt levels were significantly lower, around 30% of GDP, making such moves more manageable. By the 1990s, as debt grew to 50% of GDP, rising interest costs forced political leaders into budgetary reforms.
Between 2010 and 2021, ultra-low interest rates created the illusion of fiscal safety, enabling the U.S. to expand its debt load with minimal apparent consequences. But that phase is ending. As the Federal Reserve tightens its policies, the true burden of debt is becoming apparent. Domestic ownership of U.S. debt offers some protection, as about 70% is held by American investors, including the Federal Reserve itself. However, relying too heavily on domestic buyers could crowd out private investment. If the Fed resumes large-scale Treasury purchases, there is a risk of inflation reemerging, which could undermine the credibility of the dollar. While this strategy was effective during the pandemic, it poses significant reputational and macroeconomic risks if used excessively.

If yields continue to rise, fiscal policy may come under increasing pressure. A future administration might consider speculative strategies such as extending bond maturities, implementing spending freezes, or imposing tariffs. However, the effectiveness of each of these solutions is significantly influenced by investor confidence and market trust.
While some, including economist Scott Bessent, suggest that robust GDP growth could resolve the debt issue by boosting tax revenue, growth alone may not be sufficient if interest rates remain high or inflation persists. In that case, only meaningful fiscal reform, not mere optimism, will satisfy markets.
Market Implications and Technical Outlook
The debt situation is not just an economic theory; it significantly impacts market dynamics. When yields rise, equities become less attractive because the discount rate on future earnings increases. If interest payments surpass 5% of GDP, riskier assets may face renewed downward pressure, especially in growth sectors that rely on low-cost capital.
The U.S. dollar faces a delicate balancing act. In the short term, higher yields attract capital inflows. But if the debt trajectory appears unsustainable, global investors may reduce dollar exposure. A weaker dollar would likely raise import prices and push inflation higher, further complicating the Fed’s policy path.
Ultimately, the message is clear: the U.S. can continue to fund its debt for now, but the margin for error is narrowing. Fiscal responsibility is no longer a long-term aspiration; it has become a present-day market catalyst. With key inflation data and GDP figures due this week, markets are poised to respond swiftly.
Key Technical Movements This Week
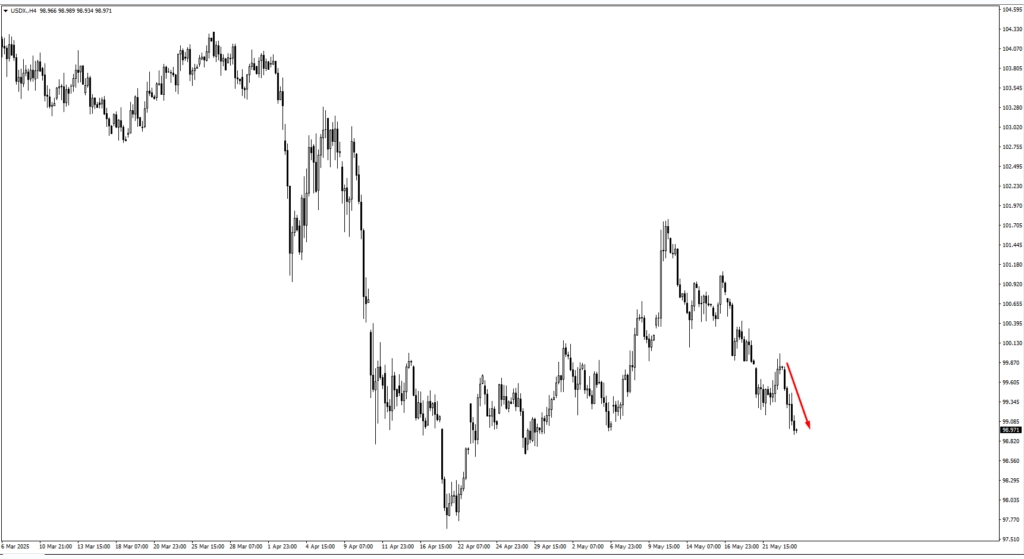
The US Dollar Index (USDX) is retreating from resistance near 100.15, with support tested around 98.30. A decisive move here may indicate broader sentiment shifts regarding U.S. fiscal stability.
EUR/USD has gained strength from the 1.1240 level and eyes 1.1470 as the next resistance. The direction will hinge on upcoming U.S. data releases.
GBP/USD continued upward momentum, with resistance zones at 1.3595 and 1.3670 in focus. BOE Governor Bailey’s speech on Friday may catalyze further movement.
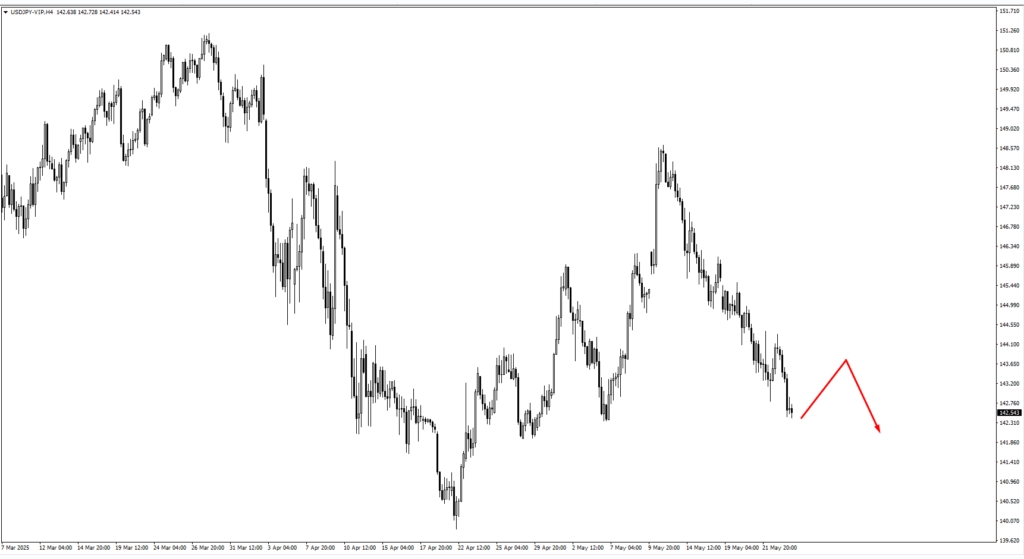
USD/JPY is consolidating near resistance at 143.30–143.80. A break higher could follow if U.S. yields rise; otherwise, reversal signals like evening star patterns may present shorting opportunities.
USD/CHF is retracing after nearing support at 0.8330. Resistance at 0.8255–0.8280 may provide short setups if upward momentum stalls.
AUD/USD is testing monthly highs, supported by commodity strength and a softer dollar. Bulls will watch the 0.6460 region for new entries.
NZD/USD has broken its range. The 0.5950 zone is now crucial for potential bullish setups ahead of the RBNZ decision midweek.
USD/CAD dropped below 1.3920 resistance. A retest of 1.3810 may set up bearish trades, especially with oil price movements in play.
Commodities and Indices

Crude Oil (USOil) showed an impulsive move from the 60.20 level. A clean breakout above 64.534 would signal continued strength, though stalling near resistance could imply exhaustion.
Gold advanced past the 3220 region and now approaches resistance near 3400. A pullback toward 3305 could provide new long opportunities if inflation data supports continued upside.
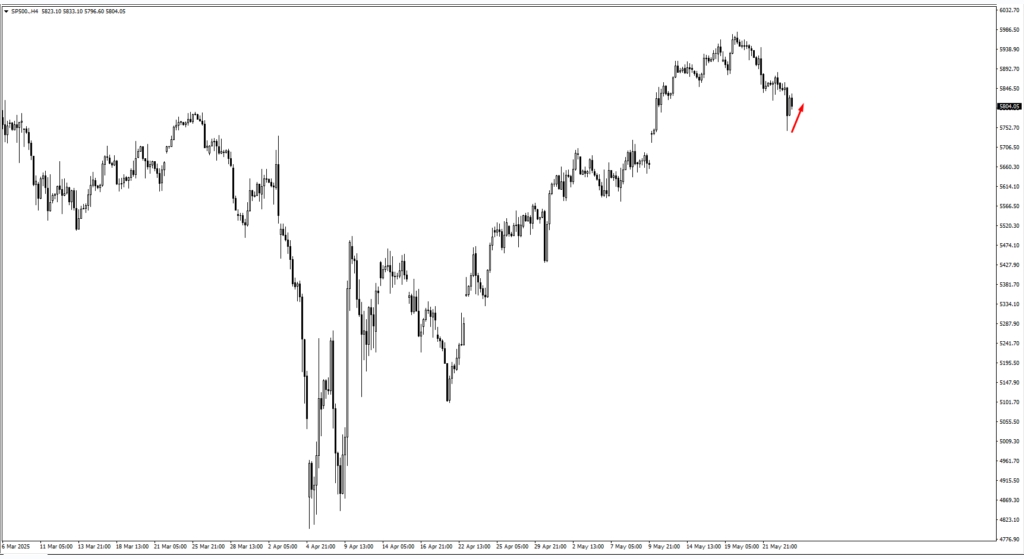
S&P 500 extended its rally from the 5740 zone, with 5690 as the next key support for bullish setups. However, higher Treasury yields may cap gains.
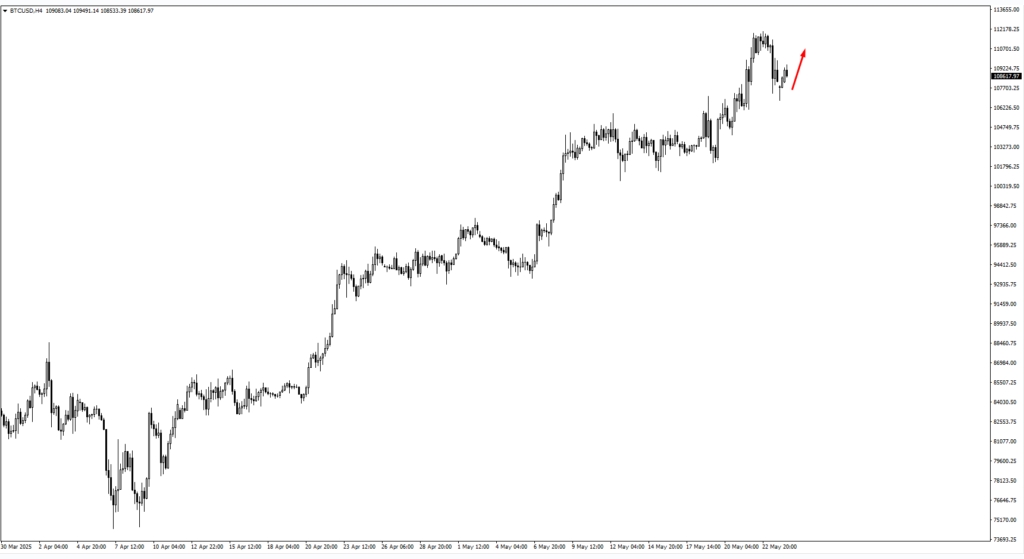
Bitcoin remains elevated. Resistance zones at 113,500 and 123,000 may act as inflection points. Traders should remain cautious given the overheated crypto sentiment.
Key Events to Watch This Week
The week starts quietly but ends with potentially high-impact economic data and central bank commentary.
Wednesday, May 28- Reserve Bank of New Zealand (RBNZ)
A potential rate cut from 3.50% to 3.25% is expected. If NZD/USD has not broken resistance at 0.60238, the announcement could trigger a pullback. A confirmed breakout, however, may accelerate the move.
Thursday, May 29- U.S. Preliminary GDP Data
Markets anticipate a -0.3% reading, unchanged from the prior quarter. While the headline may not surprise, internal components such as consumer spending will set expectations for Friday’s inflation data.
Friday, May 30- High-Impact Sessions
BOE Governor Andrew Bailey’s Speech: GBP/USD is approaching critical resistance. Bailey’s tone could determine whether the pair breaks higher or returns to range.
U.S. Core PCE Price Index: Forecasted at 0.10%, any upside surprise could reignite inflation fears and push Treasury yields higher, potentially weighing on equities.
China Manufacturing PMI: Forecasted at 49.5, still below the expansion threshold. A weaker-than-expected figure could weigh on AUD and NZD, as Chinese demand remains pivotal to both.
The week may start off slow, but it is expected to conclude with increased volatility as important economic data and central bank guidance influence market sentiment.
Create your live VT Markets account and start trading today.


