


A booming stock market typically signals strong economic momentum, but in 2025, that narrative doesn’t quite hold up. Instead of riding on corporate earnings or productivity, markets are floating on a wave of liquidity. That should give traders and investors a reason to look twice.
The Real Driver: Liquidity, Not Fundamentals
Markets are riding high: Bitcoin is surging, gold is gleaming, and equity indices remain resilient. However, this optimism is not necessarily grounded in strong economic data. Instead, the driving force behind asset price inflation is the abundance of liquidity, much of it a consequence of years of accommodative monetary policy.
Since 2020, the U.S. money supply measured by M2 has reached historic highs, thanks to the Federal Reserve’s aggressive quantitative easing and ultra-low interest rates. Originally designed to stabilize the economy during the COVID-19 crisis, this flood of cheap money has had a profound effect on risk assets.
When money is cheap and plentiful, it flows quickly bypassing traditional savings vehicles and finding its way into equities, real estate, precious metals, and increasingly, digital assets. Prices rise not because of fundamental strength, but because liquidity inflates demand.
A Pattern Repeating Itself
This isn’t the first time we’ve seen this playbook. Following the 2008 financial crisis, the U.S. embarked on a similar monetary expansion that fueled one of the longest bull runs in market history. Today’s liquidity-driven rally, however, is more aggressive and far-reaching.
Interestingly, this flood of money is not stimulating consumer spending in a significant way. Instead, it’s being absorbed by financial markets. As a result, asset prices continue to soar even while earnings growth falters and labor market indicators remain mixed.
Beyond printing money, the Fed has employed other tools like loosening the Supplementary Leverage Ratio to give banks more lending capacity. These tools provide short-term stability but also reflect how far central banks are willing to go to maintain market momentum.
The Danger of Overdependence
This dependency on liquidity is a double-edged sword. Should cracks emerge, such as stress in the commercial real estate sector or regional banks, the response may simply be to inject even more liquidity.
But history offers a cautionary tale. In the 1970s, prolonged easy policy and ballooning deficits led to runaway inflation. Gold surged from $35 to $850 per ounce, and the Fed eventually had to raise interest rates above 15%, triggering a severe recession.
Where Should Traders Look Now?
For equity investors, this may be the time to turn selective. Sectors with pricing power, such as energy, industrials, and defense, often fare better in inflationary environments. Defensive sectors like healthcare and consumer staples may also offer more resilience amid rising volatility.
Meanwhile, holding cash, especially in USD, may no longer be as safe as it seems. Despite its status as the world’s reserve currency, the U.S. dollar faces erosion from persistently high deficits, reduced demand for Treasuries, and a shift toward reserve diversification by other nations.
Seeking Safer Havens
In an environment where money loses value quietly, alternatives to cash may become more attractive. Precious metals like gold and silver are time-tested stores of value.
Treasury Inflation-Protected Securities (TIPS) offer inflation-linked returns, while commodities, particularly energy and agriculture, often benefit when the dollar weakens.
Traders looking for diversification may also consider foreign currencies such as the Swiss franc, Singapore dollar, or Norwegian krone. And for those comfortable with risk, digital assets like Bitcoin remain part of the modern hedge strategy, attracting institutional inflows despite their volatility.
At its core, this market rally is not built on strength but on liquidity. The ascent may feel smooth, but the descent could be swift if conditions change. For traders, staying agile and informed will be more critical than ever.
What the Charts Are Telling Us
Markets are testing critical levels this week. Some pairs are flirting with breakouts, while others look ready to revert. Here’s what we’re watching closely:
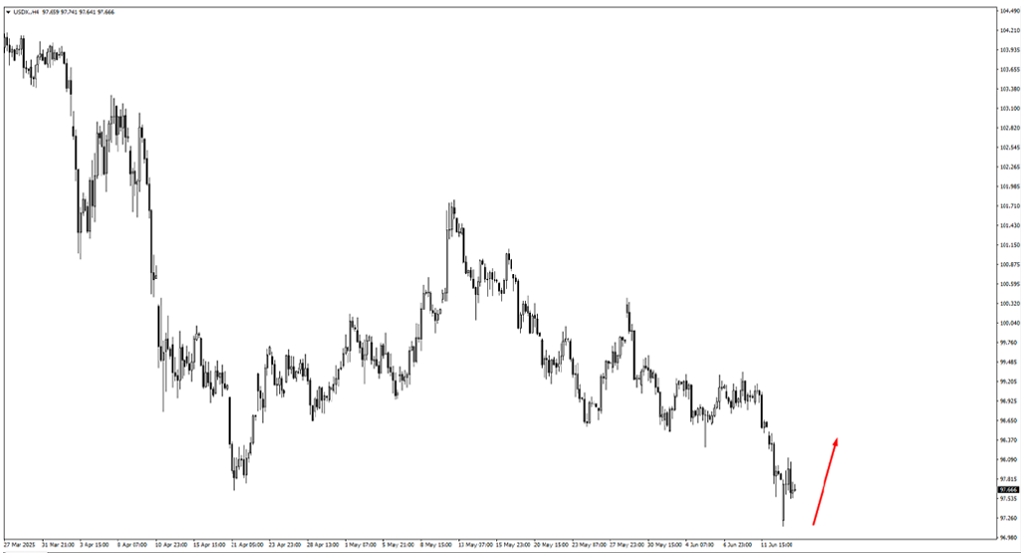
USDX is testing key resistance at 97.90, with the next targets near 98.30. A failure here puts 96.40 back into focus as support. Until the Fed provides direction, expect reactive moves.
EURUSD has stalled at 1.1485. If the pullback continues, 1.1420 could offer support. Upside zones to watch are 1.1675 and 1.1730, especially ahead of eurozone CPI data.
GBPUSD shows resilience above 1.35221. With resistance at 1.3670, Wednesday’s UK CPI will likely shape the pair’s direction.
USDJPY bounced from support near 142.785. Bulls may aim for 145.15, 145.75, and 146.55, depending on the BOJ’s tone this week.
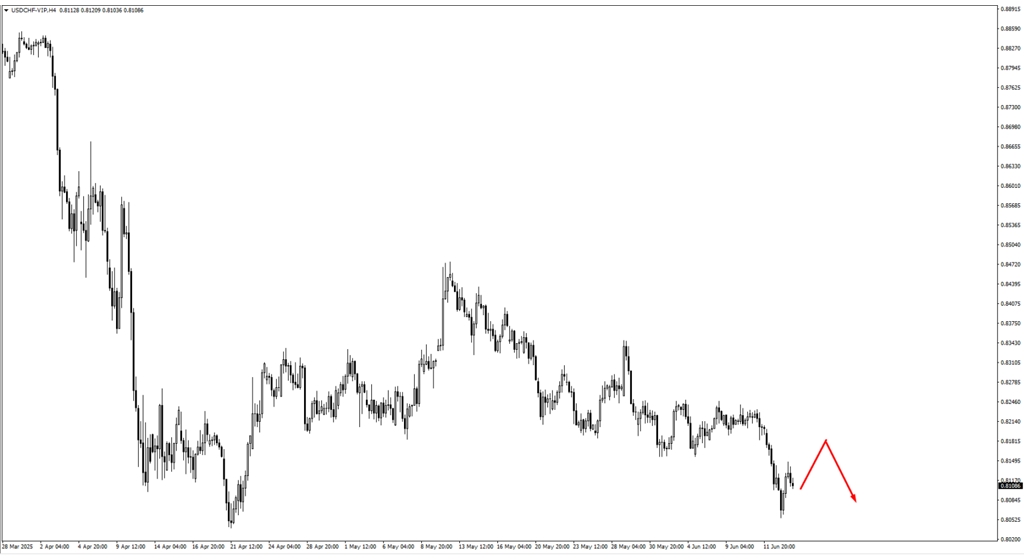
USDCHF is under pressure below 0.8195. If 0.80388 breaks, look for volatility, particularly if the SNB surprises with a rate cut.
AUDUSD remains range-bound but vulnerable. Resistance at 0.6575 could attract sellers, especially after downgraded employment projections.
NZDUSD clings to trendline support. A sweep below it might signal a deeper move unless reversed quickly. Limited data suggests it may mirror AUD sentiment.
USDCAD is testing the 1.3590 low. A break lower puts 1.3500 into focus, with oil prices possibly driving CAD strength.
USOil remains supported above 68.40, but momentum is headline-sensitive. A pullback to that zone could be a buying opportunity.
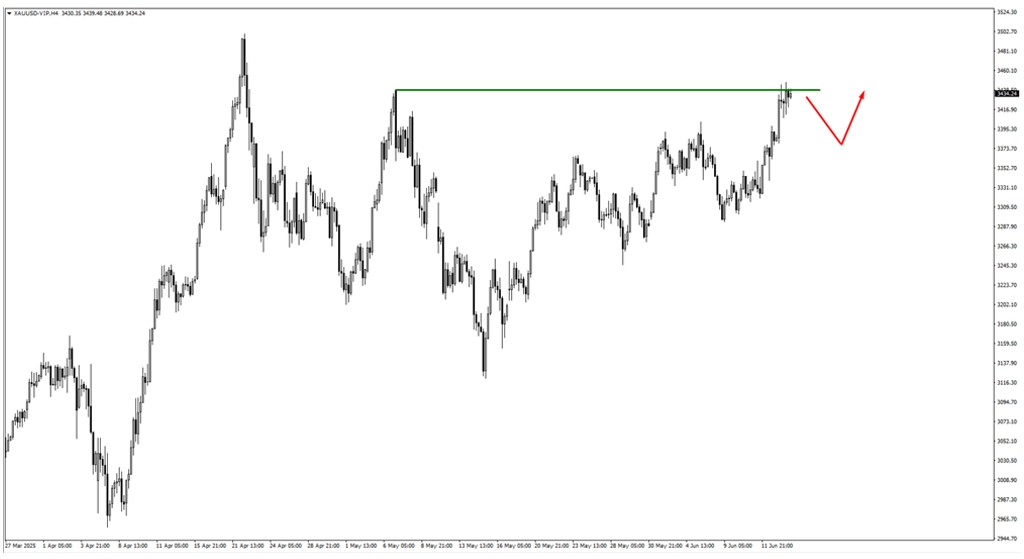
Gold has pushed above 3439, though further confirmation is needed. Supports at 3385 and 3355 may see renewed interest depending on inflation data.
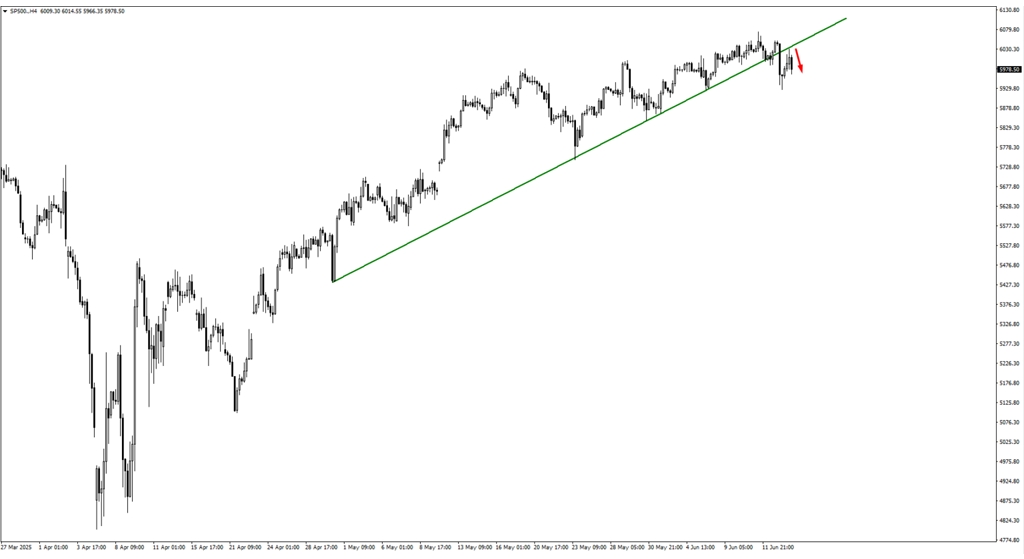
SP500 is stable above 6000. A pause may precede another leg higher unless earnings or Fed commentary trigger a correction.
Bitcoin is consolidating near 106,950. A move below 102,666 could deepen the correction, but continued consolidation may signal just a cooling-off period.
Natural Gas is pushing toward 3.52 after bouncing from 3.25. Bulls will want confirmation before entering new positions.
Key Events This Week
Tuesday—Bank of Japan Policy Decision
The BOJ is expected to hold its rate at 0.5%, but markets are keenly watching for any shift in tone from Governor Ueda. A hawkish tilt could send the yen soaring, impacting USDJPY significantly.
Wednesday—UK CPI Release
Forecast at 3.3% YoY, slightly below the previous 3.5%, this inflation print will be pivotal for GBPUSD. A higher reading could re-ignite rate hike speculation, while a softer figure may deflate recent gains.
Thursday—Major Central Bank Day
Federal Reserve: Expected to hold at 4.5%, but tone matters more. Hawkish hints could lift the dollar, while dovish language may spur risk-on sentiment.
Australia Employment Data: A sharp drop from 89K to 19.9K is projected. Weak results could weigh on AUDUSD.
Swiss National Bank: Markets anticipate a rate cut to 0.00%. Reaction depends on how dovish the SNB sounds about its outlook.
Bank of England: Expected to maintain rates at 4.25%. Any shift in tone on inflation or growth could drive significant movement in GBP pairs.
While no explosive surprises may be scheduled, the subtle signals from central banks and inflation data could be enough to shake markets. Liquidity remains the lifeblood of current rallies, but over-dependence on easy money is a risk in itself.
As always, stay informed, stay nimble, and be prepared to act. The markets are listening closely not just to the data but to the tone behind every decision.


