





Crude oil prices are the cost of one barrel of benchmark crude, quoted in US dollars and set by global supply and demand. Two benchmarks lead the quotes: the Brent crude oil price for internationally traded barrels, and the WTI crude oil price for North America. Most traders follow these prices through CFDs rather than buying physical barrels. This guide covers what moves crude oil prices, how to read a crude oil prices chart, and how to manage risk on MetaTrader 4 and MetaTrader 5.
Key Takeaways:
- Crude oil prices are set by global supply and demand, not by any single country or organisation.
- Two benchmarks dominate quotes: the Brent crude oil price for international barrels and the WTI crude oil price for North America.
- Ten recurring drivers explain most oil moves, from OPEC+ policy to US dollar strength and weekly inventory data.
- Oil is a high-volatility energy commodity, so position sizing and stop-loss orders matter more than forecasting.
Crude oil prices touch almost everything, from the fuel in your car to the inflation figure in the morning news. For traders, oil is one of the most active markets available, and one of the most misunderstood. Prices can swing several dollars in a session for reasons that seem invisible unless you know where to look.
This guide breaks the subject into four parts. First, we explain what crude oil prices actually represent and how they are quoted. Next, we work through the ten factors that move them. We then show how to read those forces on a chart. Finally, we cover the risk controls that keep a trading account intact when oil turns volatile.
What Crude Oil Prices Actually Represent
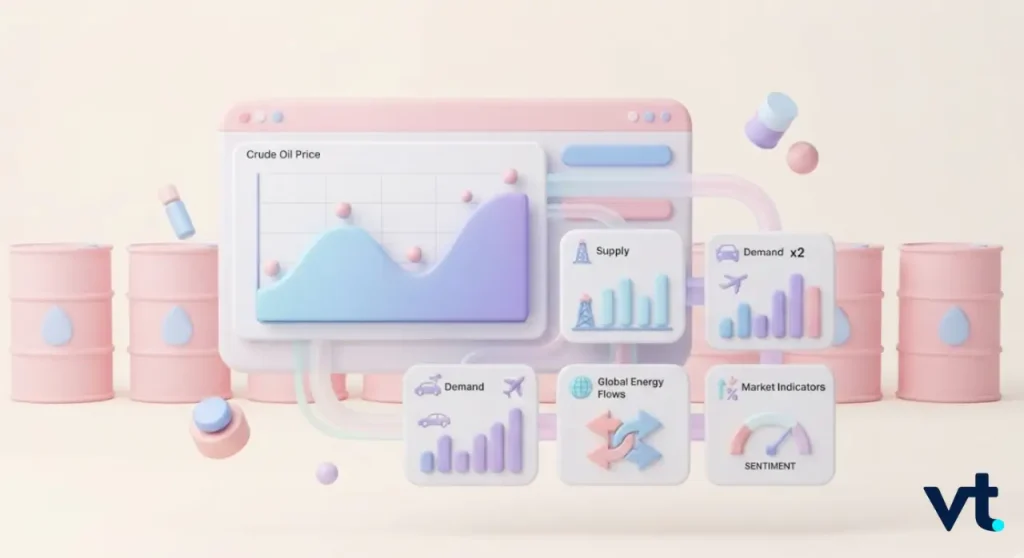
Crude oil is unrefined petroleum pulled from underground reservoirs. It is not a single product. Grades differ by density and sulphur content, and each grade carries its own value. Light sweet crude is easier and cheaper to refine, so it trades at a premium to heavier, higher-sulphur barrels.
What you see quoted in the news is not the price of every barrel on earth. It is the price of a benchmark grade, used as a reference point that other grades are priced against.
How Crude Oil Prices Are Quoted And Traded
Oil is quoted as a price per barrel in US dollars. One barrel equals 42 US gallons, or roughly 159 litres. When a headline says oil is at $80, it means one barrel of a benchmark grade costs eighty dollars.
Two prices circulate at once:
- The spot price, which reflects a barrel bought for near-immediate delivery.
- The futures contract price, which locks in a barrel for a set month ahead.
Most retail traders never touch a physical barrel. They trade derivatives that track the benchmark, which is why oil CFD trading has become the common route into this market.
Brent Vs WTI: Why Two Benchmarks Set Crude Oil Prices
The Brent crude oil price references barrels from the North Sea and is used to price the majority of internationally traded crude. The WTI crude oil price references West Texas Intermediate, settled at the Cushing hub in Oklahoma, and anchors the North American market.
The two usually move together, but a gap opens between them when a regional event hits one side harder than the other. The grades also differ on paper, with published differences in sulphur content and API gravity explaining part of the persistent price gap.
| Feature | Brent | WTI |
| Origin | North Sea | United States |
| Settlement point | Seaborne, waterborne cargoes | Cushing, Oklahoma |
| Typical role | International benchmark | US domestic benchmark |
| Sensitive to | Middle East and shipping disruption | US production and pipeline flows |
Illustrative example:
If Brent trades at $82.00 and WTI at $78.00, the spread is $4.00. A widening spread usually signals a supply problem concentrated in one region rather than a global shift.
What Moves Crude Oil Prices
The following ten drivers explain the majority of oil moves. They rarely act alone. In most sessions, two or three are pulling in the same direction while others push back. Learning to separate genuine drivers from noise is a skill in itself, and our guide to oil market signals covers what most headlines leave out.
1. Global Supply And Production Levels
Supply is the starting point. When producers pump more barrels than the world consumes, inventories build and prices soften. When output falls short, prices firm.
Supply shifts arrive through several channels:
- New fields coming online or mature fields declining
- Investment cycles, since drilling decisions made today affect output years later
- Unplanned outages from maintenance, storms, or technical faults
- Sanctions that remove a producer’s barrels from open markets
2. OPEC+ Production Decisions
The Organization of the Petroleum Exporting Countries and its allies coordinate output targets across a large share of global production. They do not set the price directly. Markets do that.
However, OPEC+ production cuts or increases change the supply balance, and traders reprice oil quickly around those announcements.
Watch three things: the headline quota decision, the compliance rate among members, and any signal about the next meeting.
3. Global Demand And Economic Growth
Demand tracks economic activity. Factories, freight, aviation, and petrochemicals all consume oil, so growth data feeds directly into oil consumption forecasts.
Key demand signals include:
- GDP growth and manufacturing activity in large consuming economies
- Air travel and road fuel consumption trends
- Industrial output and shipping volumes
- Central bank policy, since higher rates tend to cool growth and demand
4. Geopolitical Risk And Supply Routes
Oil travels through a small number of chokepoints. Any threat to those routes raises the risk of disruption, and markets price that risk before a single barrel is lost. This is where geopolitical risk premium comes from.
Conflict, sanctions, and shipping threats can lift prices even when current supply is untouched. This is because traders are pricing what might happen next.
5. The Strength Of The US Dollar
Oil is priced in US dollars worldwide. When the dollar strengthens, buyers using other currencies find oil more expensive, which can weigh on demand and prices. A weaker dollar tends to have the opposite effect.
This matters most during periods of stress, when the dollar tends to rise in uncertain markets at the same time as risk headlines are pushing oil around.
Illustrative example:
A buyer holding euros needs €80,000 to purchase 1,000 barrels at $80 when EUR/USD sits at 1.0000. If the euro strengthens to 1.2500, the same barrels cost roughly €64,000. Nothing changed in the oil market, yet the barrels became cheaper for that buyer.
6. Inventory And Stockpile Data
Weekly inventory reports are among the most reliable short-term catalysts in this market. The EIA crude inventory report and the industry figures released the day before show whether stockpiles are building or drawing down.
What matters is not the raw number but the surprise against expectations.
| Scenario | Expected | Actual | Market read |
| Bullish surprise | Build of 1.0m barrels | Draw of 3.0m barrels | Demand stronger than assumed |
| Bearish surprise | Draw of 2.0m barrels | Build of 2.5m barrels | Supply looser than assumed |
| Neutral | Build of 1.0m barrels | Build of 1.1m barrels | Little reaction |
Note: Figures above are illustrative only.
7. Spare Capacity And Supply Buffers
Spare capacity is the cushion of production that could be brought online quickly if supply is lost elsewhere. When that cushion is thick, the market shrugs off disruption. When it is thin, the same headline produces a much larger price reaction.
This explains why identical news can move oil by fifty cents one year and five dollars the next.
8. Seasonality And Weather
Demand follows the calendar. The northern hemisphere driving season lifts petrol consumption through summer, while winter raises heating fuel demand.
Weather also disrupts supply, since hurricanes can shut offshore platforms and refineries, and extreme cold can freeze wellheads.
Seasonal patterns are tendencies, not guarantees. They can be overwhelmed entirely by a larger driver.
9. Refining Capacity And Product Demand
Crude has no direct use until it is refined. Refinery outages, maintenance seasons, and processing bottlenecks change how much crude is actually being consumed.
Traders watch refinery margins, often expressed as the crack spread. It is because healthy margins encourage refiners to buy more crude while weak margins reduce their appetite.
10. Market Positioning, Speculation And Sentiment
Not everyone trading oil intends to take delivery. Funds, institutions, and retail traders all take positions based on expectations. That flow adds to oil price volatility, particularly when a crowded position unwinds and prices accelerate in one direction.
Sentiment also explains why oil sometimes fails to react to news that seems significant. If the market has already priced the outcome, the event itself passes quietly. The top factors that affect the price of oil is a useful cross-check if you want a second view on how these drivers interact.
Find out more about why crude oil prices swing erratically and how this information helps cfd traders.
How To Read A Crude Oil Prices Chart
A crude oil prices chart turns those ten factors into something you can actually trade. The chart will not tell you why price moved, but it does show where buyers and sellers have previously defended levels.
If you want to follow the market before opening an account, a live Brent crude oil chart is freely available to watch.
Start with structure before indicators. Identify the trend on the daily chart, mark obvious support and resistance, then drop to a lower timeframe for entries.
Building A Simple Oil Watchlist
Keep your screen focused. A workable oil watchlist contains:
- Brent and WTI, so you can monitor the spread between them
- The US Dollar Index, given oil’s dollar pricing
- An energy equity index or major producer, as a sentiment cross-check
- A safe-haven asset such as gold, which often reacts to the same geopolitical headlines
Timing Your Analysis Around Scheduled Events
Much of oil’s weekly volatility clusters around known events. Mark these in your calendar:
- Industry inventory estimates, typically released Tuesday
- Official government inventory data, typically Wednesday
- OPEC+ meetings and monthly market reports
- Major economic releases from large consuming economies
Pro tip: If your strategy is not built around news, consider standing aside for the ten minutes surrounding inventory data. Spreads can widen and slippage becomes more likely.
Managing Risk When Trading Crude Oil Prices
Oil rewards discipline more than prediction. You do not need to forecast the next OPEC+ decision to trade well. You need a position size that survives being wrong.
Position Sizing With A Worked Example
Assume an illustrative broker contract of 100 barrels per lot. A $1.00 move in oil is therefore worth $100 per lot.
Now apply a 2% risk rule to a $5,000 account:
| Step | Calculation | Result |
| Maximum risk per trade | $5,000 × 2% | $100 |
| Planned stop distance | Entry to stop | $2.00 |
| Risk per full lot | 100 barrels × $2.00 | $200 |
| Position size | $100 ÷ $200 | 0.5 lots |
The trade is sized to the stop, not the other way around. If the stop needs to be wider because volatility has increased, the position must get smaller. Running the numbers before you enter is the core of scenario analysis in CFD trading. It only takes less than a minute once the habit forms.
Placing Stops Around Volatility, Not Round Numbers
Oil regularly moves more than a dollar in a session. A stop placed twenty cents from entry will be triggered by ordinary noise. Use recent range or an average true range reading to set a distance the market must genuinely break to prove you wrong.
Common Mistakes To Avoid
- Trading oil with forex position sizes, ignoring the different contract value
- Holding leveraged positions through weekend geopolitical risk without reduced size
- Adding to a losing position because a headline “should” move price your way
- Using maximum available leverage simply because the platform offers it
- Ignoring overnight financing costs on positions held for weeks
Getting Started On An MT4 Or MT5 Platform
MetaTrader remains the standard workspace for oil traders because it combines charting, order management, and automation in one place.
What To Look For In A Broker
- Regulation and transparent, published trading conditions
- Competitive spreads on oil and clearly stated contract specifications
- Reliable execution during high-volatility news windows
- A demo account so you can test oil sizing before risking capital
- Genuine educational material rather than performance promises
VT Markets supports both MetaTrader 4 and MetaTrader 5, with oil available alongside forex, gold, indices, and shares.
A Practical First-Month Plan
- Week one: open a demo account and watch oil without trading. Note how it reacts to inventory data.
- Week two: define one setup on the daily crude oil prices chart and record every signal it produces.
- Week three: trade that single setup in demo, sized with the 2% rule.
- Week four: review your log. Check whether losses stayed within plan, then consider a small live size.
Pro tip: Keep a written trade journal from day one. Most traders discover their problem is not analysis but repeated deviation from their own rules.
Get more details on how to trade ETF crude oil like a seasoned cfd trader or how to trade oil effectively.
Frequently Asked Questions (FAQs)
Q1: What has the biggest influence on crude oil prices?
No single factor dominates permanently. Supply and demand set the underlying direction, while OPEC+ policy, geopolitical risk, and inventory data drive shorter-term moves. The dominant driver rotates depending on market conditions.
Q2: Why are Brent and WTI priced differently?
They reference different grades, produced and delivered in different regions. Brent is seaborne and internationally traded, while WTI settles inland in Oklahoma. Regional supply events therefore affect one benchmark more than the other, opening a spread between them.
Q3: Can crude oil prices fall below zero?
It has happened. In April 2020, WTI futures settled negative when storage capacity ran short near contract expiry and holders paid to avoid taking delivery. It is rare and specific to physically settled futures near expiry.
Q4: Do I need to buy physical barrels to trade oil?
No. Most retail traders access the market through CFDs or futures that track benchmark prices, so no physical delivery is involved.
Q5: Is oil suitable for beginner traders?
Oil is more volatile than most major currency pairs, so it demands strict position sizing. Beginners are better served by learning the market on a demo account first, then starting with reduced size.
Trade Crude Oil Prices With VT Markets
Crude oil prices will always move for unpredictable reasons. Wars begin, storms arrive, and policy shifts without warning. Comprehend the ten drivers above, read the chart with structure rather than hope, and size every position, so a single bad session never threatens your account.
Start on demo, keep a journal, trade one setup until it becomes second nature, and scale only when your results justify it.
With VT Markets, you can get MetaTrader 4 and MetaTrader 5 access and transparent trading conditions for trading oil with a plan rather than a guess.
Create a live VT Markets account today to access our platform features, including market insights and educational content.








