





Key Points
- The S&P 500 fell 14.41 points, or 0.19%, to close at 7,443.28 in the previous session.
- Investors balanced renewed Middle East tensions against reports of a possible de-escalation proposal.
- Attention is shifting towards earnings from Alphabet, Tesla and Intel as the second-quarter reporting season gathers pace.
- Markets expect S&P 500 earnings to grow 26% year on year for the second quarter, compared with an earlier estimate of 23.7%.
- Apple was the largest drag on the index, while Microsoft and Alphabet provided support.
The S&P 500 finished slightly lower as investors balanced Middle East developments against caution ahead of major corporate earnings.
The benchmark index lost 0.19% to close at 7,443.28. Wall Street’s three major indices ended lower as investors monitored efforts towards Middle East de-escalation and waited for major earnings releases.
The decline was relatively contained, but the session reflected investor hesitation as markets waited for greater clarity from both corporate results and geopolitical developments.
Why Traders Are Watching This
The S&P 500 enters a key earnings week, with major technology companies set to provide insight into corporate spending, artificial intelligence demand and broader US economic conditions.
Alphabet, Tesla and Intel are scheduled to report this week. Their results carry significant weight because large technology companies have a substantial influence on index performance.
Expectations remain elevated. LSEG data shows markets are forecasting 26% year-on-year second-quarter earnings growth, up from an earlier estimate of 23.7%. However, stronger earnings alone may not be enough, as investors will also focus on forward guidance and future growth expectations.
Meanwhile, geopolitical uncertainty continues to influence sentiment. Yemen’s Iran-aligned Houthi militants announced a maritime blockade targeting Saudi Arabia, increasing concerns around regional shipping routes.
These competing factors have left investors looking for clearer signals from earnings results and geopolitical developments.
Technology Stocks Shape the Index
Technology shares provided some support during the session, although the earlier recovery in semiconductor stocks weakened before the close.
The Philadelphia Semiconductor Index had fallen more than 20% from its late-June record by the end of the previous week. It gained almost 4% earlier in the session before finishing with a more moderate increase of 0.6%.
Alphabet gained 1.5%. The move followed reports that Google was developing its own AI-focused server chip to improve computing efficiency and reduce reliance on external suppliers.
The advance made Alphabet the third-largest positive contributor to the S&P 500 during the session, while Microsoft provided the largest points-based boost.
Apple moved in the opposite direction. Its shares declined 2%, making the company the largest drag on the benchmark index.
Key Trading Levels
| Level | What Traders Are Watching |
| 7,620 | Previous major swing high and broader breakout area |
| 7,600 | Key resistance zone |
| 7,560 | Secondary resistance from recent rebound attempts |
| 7,520 | Near-term resistance |
| 7,500 | Psychological pivot and immediate market reference |
| 7,486 | Current trading area |
| 7,440 | Immediate support near recent session low |
| 7,400 | Key psychological and technical support |
| 7,360 | Wider support zone |
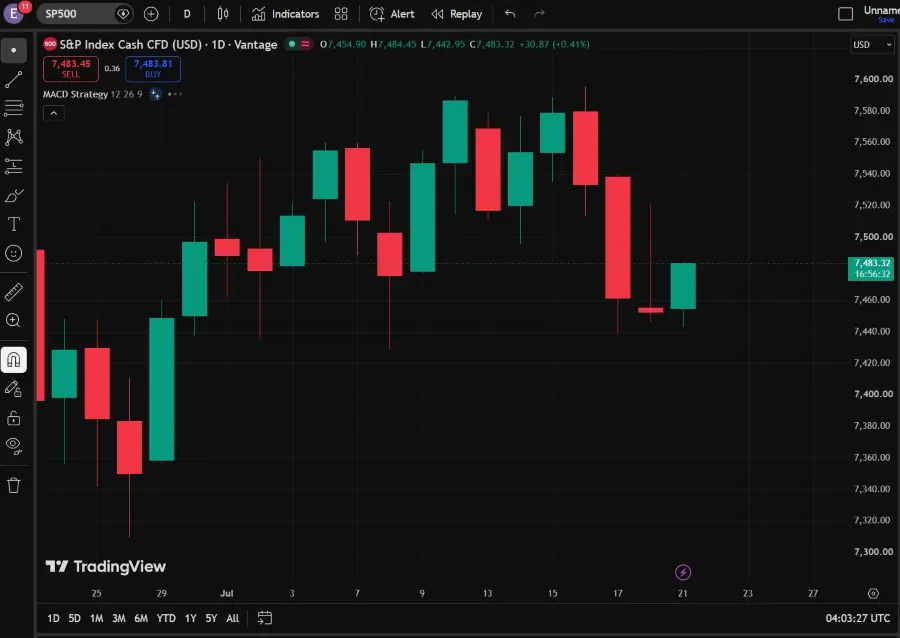
The 7,500 level remains an important psychological pivot. A sustained move above this level could improve short-term momentum and bring the next resistance zone into focus.
Immediate resistance is located near 7,520. A confirmed break above this level could open the path towards 7,560, followed by the broader resistance area around 7,600–7,620.
On the downside, 7,440 is the first support level to monitor. A break below this area could expose 7,400, followed by the wider support zone near 7,360.
Bullish and Bearish Setups
| Setup | Trigger | Potential Market Reaction |
| Bullish Hold | Remain above 7,440 | Buyers may attempt to reclaim 7,500 |
| Recovery Move | Break above 7,520 | S&P 500 may advance towards 7,560 |
| Bullish Breakout | Break above 7,560 | Momentum may extend towards 7,600–7,620 |
| Range Consolidation | Remain between 7,440 and 7,520 | Price may continue moving sideways within the current range |
| Bearish Break | Fall below 7,440 | Sellers may target 7,400 |
| Deeper Correction | Break below 7,400 | S&P 500 may weaken towards 7,360 |
The S&P 500 remains within a consolidation range, with 7,440 acting as the key support zone and 7,520 as the immediate resistance level.
The bullish scenario would depend on buyers regaining control above resistance, with a sustained move beyond 7,520 potentially opening the path towards 7,560 and the broader 7,600–7,620 resistance zone.
Meanwhile, the bearish scenario would strengthen if sellers push the index below 7,440, increasing the risk of a deeper pullback towards 7,400 and 7,360.
Disclaimer
The price levels and trade scenarios above reflect the author’s view at the time of writing and do not represent financial advice or an official recommendation from VT Markets. Traders should conduct their own analysis and manage risk carefully.
Trade SP500 CFDs With VT Markets
The S&P 500 remains closely watched during periods of technology-sector volatility, major economic releases and shifting Federal Reserve expectations.
With VT Markets, traders can access SP500 and other index CFDs alongside forex, gold, oil, share CFDs, ETF CFDs and other global markets through one platform.
This allows traders to monitor broad market movements while comparing developments across technology stocks, commodities, currencies and other major asset classes.
Use VT Markets’ charting tools to monitor support, resistance, moving averages and breakout behaviour as the next SP500 setup develops.
Learn more about trading Indices on VT Markets today.
Why Trade SP500 as a CFD?
SP500 CFDs allow traders to take a view on both rising and falling index movements without owning the underlying index or its constituent shares.
This flexibility can be useful during periods of changing market conditions, particularly when earnings reports, Federal Reserve expectations, Treasury yields and technology-sector trends influence equity markets.
If SP500 breaks above resistance, traders can monitor potential bullish continuation. If momentum weakens or selling pressure increases, traders can assess possible downside setups.
CFDs are leveraged derivative products, meaning relatively small market movements can magnify both gains and losses compared with the margin deposited.
With VT Markets, traders can follow SP500 price action in real time and compare it with other major CFD markets through one account.
What to Watch Next
Corporate earnings will remain the main scheduled catalyst for the S&P 500.
Results from Alphabet, Tesla and Intel may provide further insight into whether technology-sector momentum can continue, particularly around artificial intelligence demand, corporate spending and semiconductor recovery.
Geopolitical developments in the Middle East will also remain important. Progress towards a ceasefire could reduce concerns around energy markets and inflation, while further escalation may pressure risk-sensitive assets.
Market breadth will also be important to watch. The number of declining stocks compared with advancing stocks will help indicate whether market weakness is concentrated in specific companies or becoming broader across the index.
From a technical perspective, 7,500 remains the immediate pivot. A sustained move above 7,520 could bring 7,560 into focus, while a break below 7,440 may expose 7,400.
Frequently Asked Questions
Why did the S&P 500 fall?
The index declined as investors assessed Middle East developments and waited for major technology earnings. Apple’s share decline also weighed on the benchmark.
Why are technology earnings important for the S&P 500?
Large technology companies have significant weight within the index. Their earnings, guidance and investment plans can influence overall market sentiment and expectations for sectors linked to artificial intelligence and semiconductor demand.
What does the 26% earnings-growth estimate mean?
It means analysts expect combined S&P 500 earnings to be approximately 26% higher than the same quarter a year earlier. This is an estimate rather than a guaranteed result, and expectations may change as more companies report.
Is the recent decline a confirmed bearish trend?
Not on its own. The S&P 500’s decline was relatively limited, and further price movement would be needed to determine whether selling pressure is strengthening or whether the index is consolidating.
What should traders watch most closely?
The main factors are upcoming technology earnings, developments in the Middle East, oil-price movements, Federal Reserve expectations and whether the index can break above resistance or below key support levels.
Start trading now — click here to create your real VT Markets account.








