

Overview

Key Points
- The Fed is expected to hold rates at 3.50% to 3.75%, but the dot plot may reset expectations across USDX, gold, equities, and Bitcoin.
- CPI stands at 3.8%, while Core CPI remains at 2.8%, keeping pressure on the Fed to maintain a firm stance.
- Oil remains central to the inflation outlook, with traders watching whether any reopening of the Strait of Hormuz can pull crude prices towards the $65–$70 range.
- Key levels to watch include USDX 99.15 and 98.95, XAUUSD 4,330, USOil 76.778, SP500 7,560, and BTCUSD 65,000–66,500.
Kevin Warsh enters his first Federal Reserve meeting as Chair with little room for complacency. Sworn in on 22 May as the 17th Federal Reserve Chair, he inherits a challenging environment shaped by persistent inflation, elevated bond yields, and a divided policy committee.
CPI currently stands at 3.8%, its highest reading since May 2023 and well above the Fed’s 2% target. Core CPI remains elevated at 2.8%, while Brent crude has traded above $90 for the past four months. Together, these factors keep inflation concerns firmly at the centre of the Fed’s agenda.
The April FOMC meeting also highlighted growing divisions within the committee. Four officials dissented, marking the most fractured outcome in 34 years. Three members opposed even an easing bias, while one voted in favour of an immediate rate cut. Rather than stepping into a unified Federal Reserve, Warsh begins his tenure amid clear policy disagreements.
Meanwhile, the bond market has already responded. The 30-year Treasury yield remains above 5%, while the 10-year yield continues to trade above 4.5%. Traders have increasingly priced in a higher-for-longer rate environment, even before the Fed has formally adjusted its stance.
The rate hold looks certain.
The rate decision itself appears relatively straightforward. According to CME FedWatch, markets are pricing in a 97.4% probability that the Fed will leave rates unchanged at 3.50%–3.75% on 17 June. Few market participants expect either a rate cut or hike at this meeting.
The real focus lies beyond the decision itself.
Traders are looking for clues on whether the Fed believes holding rates is sufficient or whether policymakers are preparing markets for the possibility of future hikes.
By December 2026, markets are assigning a 42.3% probability to a move towards the 3.75%–4.00% range. In other words, at least one additional hike is approaching a coin-flip probability by year-end. Looking further ahead, early 2027 expectations continue to lean towards higher rates.
This is no longer a market focused on rate cuts. Instead, it is a market testing whether the Fed is ready to acknowledge that inflation risks have altered the policy path.
The dot plot takes centre stage.
The June meeting marks the first dot plot release of the Warsh era, and three key details could shape market sentiment throughout the week.
First, traders should pay close attention to whether any 2026 dot moves above the current 3.50%–3.75% range. As recently as April, no policymaker projected rates above the current range. Even a small number of hawkish projections would reinforce the view that discussions around further tightening are becoming increasingly serious.
Second, the 2026 median dot carries greater significance than usual. If the median shifts towards the 3.75%–4.00% range, markets could rapidly reprice expectations across the US dollar, gold, and equities.
Third, the 2027 median projection may offer insight into how long policymakers expect rates to remain elevated. A median around 3.75%–4.00% would suggest no rate cuts in 2026 and potentially leave the door open for additional tightening risks in 2027.
Warsh has previously expressed concerns about the dot plot as a communication tool, arguing that it can create a false sense of precision around an inherently uncertain outlook. However, removing or suspending the dot plot during his first meeting would likely create unnecessary market volatility.
The more probable outcome is straightforward: Warsh retains the dot plot for June while signalling that broader communication changes may be considered over time.
Politics, Inflation and Bonds Pull In Opposite Directions
While political pressure continues to favour lower interest rates, the latest inflation data provides Warsh with limited room to adopt a dovish tone.
CPI remains at 3.8%, Core CPI stands at 2.8%, PPI has climbed to its highest level since 2022, May payrolls increased by 172,000, and Brent crude continues to trade above $90. Together, these indicators leave little justification for an early policy pivot.
Since January, nearly every major economic release has reinforced the higher-for-longer narrative.
If Warsh appears overly relaxed about inflation, bond markets could respond negatively as investors demand a larger inflation risk premium. Such a move would tighten financial conditions without the Fed making any formal policy adjustment.
Oil remains an important variable in this equation.
Should the Strait of Hormuz reopen and crude prices fall towards the $65–$70 range, the inflation premium currently embedded in energy markets may begin to fade. Under that scenario, Core CPI could gradually decline towards 2.5% over the next two to three quarters, potentially reigniting calls for future rate cuts.
For now, however, the data provides the Fed with sufficient justification to maintain a firm stance. Warsh can comfortably leave rates unchanged without appearing disconnected from economic conditions, although that flexibility may narrow if inflation and energy prices begin to ease later in the year.
Banks Have Shifted Away From Cuts
Wall Street’s outlook has changed significantly over the past six months.
At the start of 2026, most major institutions expected two to three rate cuts before year-end. Today, many of those same institutions have shifted towards a prolonged hold or even the possibility of future hikes.
- Goldman Sachs now expects rates to remain unchanged throughout 2026, while acknowledging the possibility of a hike.
- JPMorgan also forecasts a hold through 2026, with a hike becoming possible in 2027.
- BNP Paribas expects three rate hikes beginning in December 2026.
- Morgan Stanley forecasts a hold through 2026 followed by a single rate cut in late 2027.
- Rabobank sees either a hold or a hike as the most likely outcomes, with multiple hikes still possible.
Citigroup remains the notable outlier, continuing to forecast three rate cuts in 2026 alongside further easing beyond that period.
The divergence highlights how dramatically market expectations have shifted from the rate-cut narrative that dominated the beginning of the year.
Base Case For Wednesday
The most likely outcome remains a hawkish hold.
Scenario Analysis
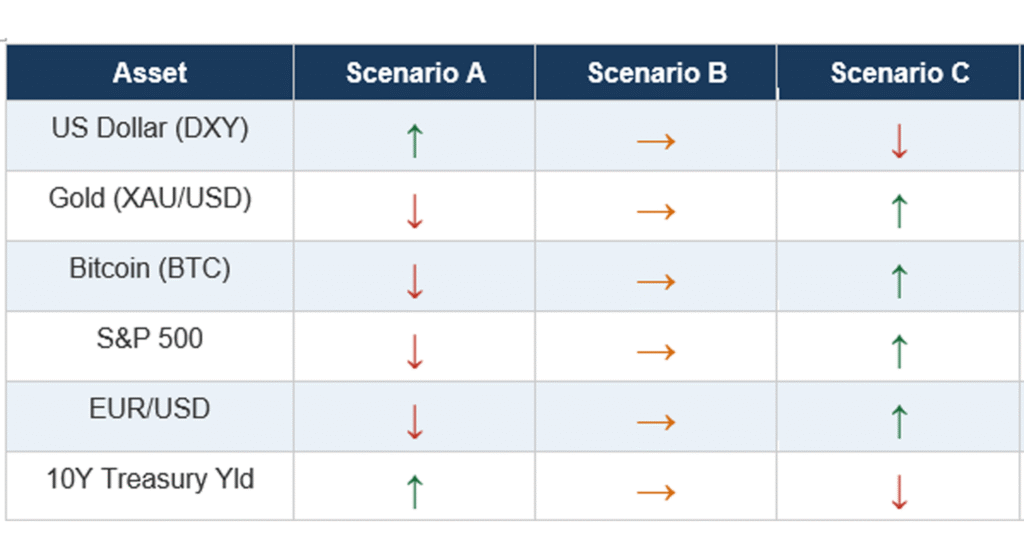
| Scenario A – Hawkish Hold | 55% | The Fed leaves rates unchanged, removes its easing bias, displays more hawkish dots, and Warsh adopts a firm and independent tone. This would likely support the US dollar and Treasury yields while creating pressure on gold, Bitcoin, SP500, and EURUSD. |
| Scenario B – Neutral Hold | 40% | The statement remains balanced, the dot plot shows limited changes, and Warsh avoids sending a strong policy signal. Markets may remain range-bound as traders await additional inflation and labour market data. |
| Scenario C – Dovish Surprise | 5% | Warsh downplays inflation concerns or hints at future rate cuts. This scenario would likely weaken the US dollar, support gold, lift Bitcoin and equities, and push Treasury yields lower. |
For now, Scenario A remains the most probable outcome, with markets increasingly expecting the Fed to maintain a firm stance in response to persistent inflation pressures.
Key Symbols to Watch
USDX | XAUUSD | USOil | SP500 | BTCUSD
Upcoming Events
| 16 Jun | JPY | BOJ Policy Rate | 1.00% | 0.75% | A hike would support JPY and increase focus on USDJPY near 160.716. |
| 16 Jun | AUD | RBA Press Conference | N/A | N/A | Watch guidance on future rate management and AUDUSD near 0.70776. |
| 17 Jun | GBP | CPI y/y | 3.00% | 2.80% | A higher reading could support GBP ahead of the policy summary. |
| 18 Jun | USD | FOMC Press Conference | N/A | N/A | The dot plot and Warsh’s tone are expected to drive USDX, XAUUSD, and SP500. |
| 18 Jun | GBP | Monetary Policy Summary | N/A | N/A | Watch for clues on future rate management and GBPUSD’s reaction near 1.3465. |
Key Movements of the Week
USDX
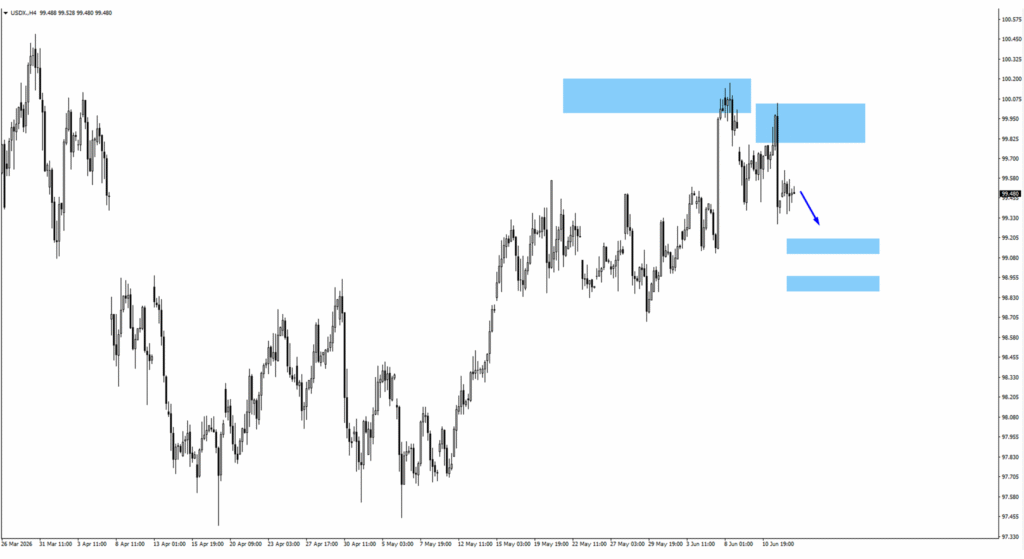
USDX traded lower last week, bringing the 99.15 level into focus as the first key support area.
A hawkish Fed hold could help stabilise the dollar and encourage a rebound, while a more neutral outcome may keep pressure on both the 99.15 and 98.95 support levels.
Traders should monitor 99.15 initially, followed by 98.95 if selling pressure continues. A stronger recovery would likely require either a more hawkish dot plot or renewed strength in Treasury yields.
Key Levels
- Support: 99.15
- Secondary Support: 98.95
- Resistance Zone: 99.90 – 100.00
XAUUSD (Gold)
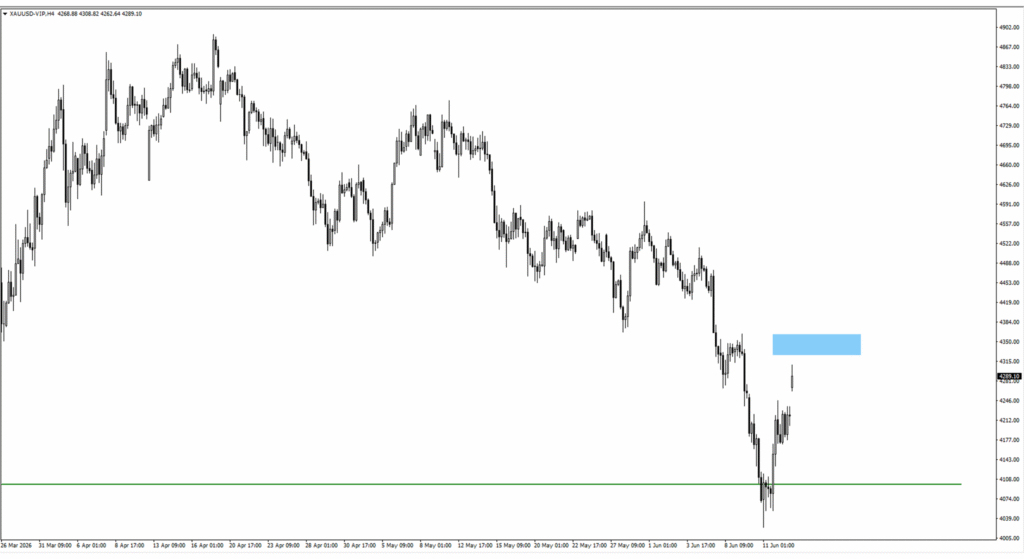
Gold extended higher after consolidating around the 4,260 region, with buyers now focusing on the 4,330 resistance area.
The next move may depend heavily on the Fed’s tone. Hawkish commentary could limit further upside, while softer yields and a weaker US dollar may allow gold to continue its recovery.
The 4,330 level remains the key upside test. Failure to break above this zone could trigger another move back towards 4,260.
Key Levels
- Resistance: 4,330
- Support: 4,260
USOil
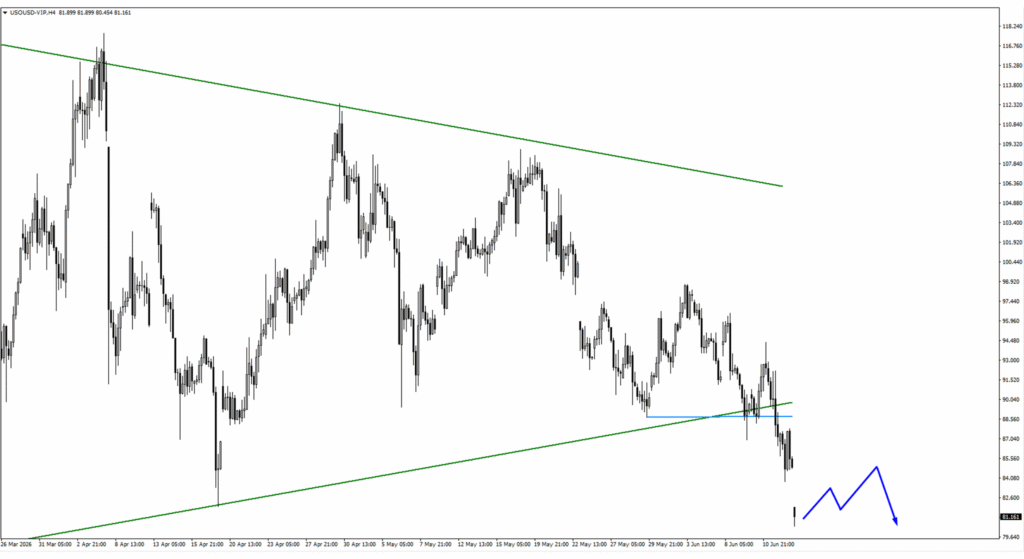
USOil gapped lower following headlines surrounding potential US-Iran peace developments and subsequently broke below the monitored 81.92 level.
If price remains below 81.92, the next significant downside target sits at 76.778.
For now, traders may find geopolitical developments more influential than traditional supply-and-demand metrics. The durability of any agreement and the timeline surrounding a potential Strait of Hormuz reopening could become the primary drivers of oil prices in the near term.
Key Levels
- Resistance: 81.92
- Support: 76.778
SP500
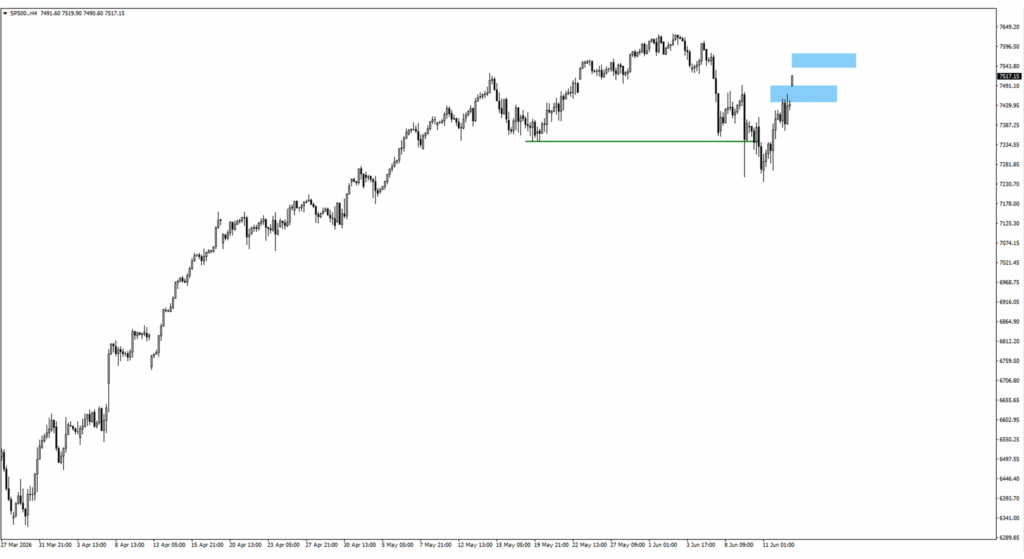
SP500 opened higher above the 7,450 monitored area following positive developments related to US-Iran relations.
A neutral Fed outcome could support a continued move towards 7,560. However, a more hawkish dot plot or firmer policy guidance may weigh on risk sentiment and limit upside momentum.
The 7,560 area remains the primary upside trigger. Conversely, a move back below 7,450 would weaken the recent relief rally and suggest fading bullish momentum.
Key Levels
- Resistance: 7,560
- Support: 7,450
BTCUSD
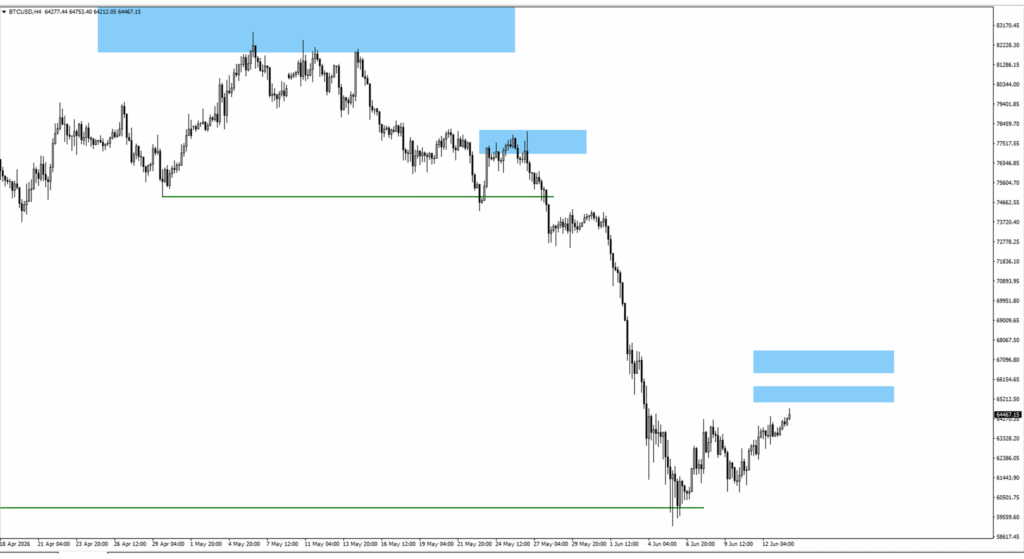
Bitcoin has rebounded from its recent low zone and is now approaching the important 65,000–66,500 resistance region.
Higher Treasury yields and a stronger US dollar may continue to limit upside momentum. However, softer Fed guidance could encourage renewed buying interest across risk assets, including cryptocurrencies.
Traders should monitor 65,000 and 66,500 as the immediate resistance levels. If sellers regain control, attention may shift back towards the 58,700 and 54,000 support zones.
Key Levels
- Resistance: 65,000 – 66,500
- Support: 58,700
- Secondary Support: 54,000
Bottom Line
This week centres on Kevin Warsh’s first FOMC press conference, the release of the updated dot plot, and how markets interpret the policy path beyond June.
The base case remains a hawkish hold, with rates expected to remain unchanged while the Fed pushes back against expectations of near-term rate cuts.
CPI at 3.8%, Core CPI at 2.8%, Brent crude trading above $90, and long-term Treasury yields above 5% all reinforce the case for maintaining a firm policy stance. While a potential reopening of the Strait of Hormuz and a decline in oil prices towards the $65–$70 range could eventually improve the inflation outlook, policymakers are still likely to require more evidence before considering a shift in tone.
As a result, traders should closely monitor the dot plot, Treasury yields, energy market developments, and Warsh’s commentary throughout the week.
USDX, XAUUSD, USOil, SP500, and BTCUSD are expected to remain highly sensitive to any changes in policy expectations and inflation-related headlines before liquidity begins to thin into the US bank holiday.
Create a live VT Markets account today to access advanced trading tools, market insights, educational resources, and opportunities across global financial markets.


