






Key Points
- Q3 revenue rose 26% to $64.60 billion, exceeding the $63.34 billion consensus estimate.
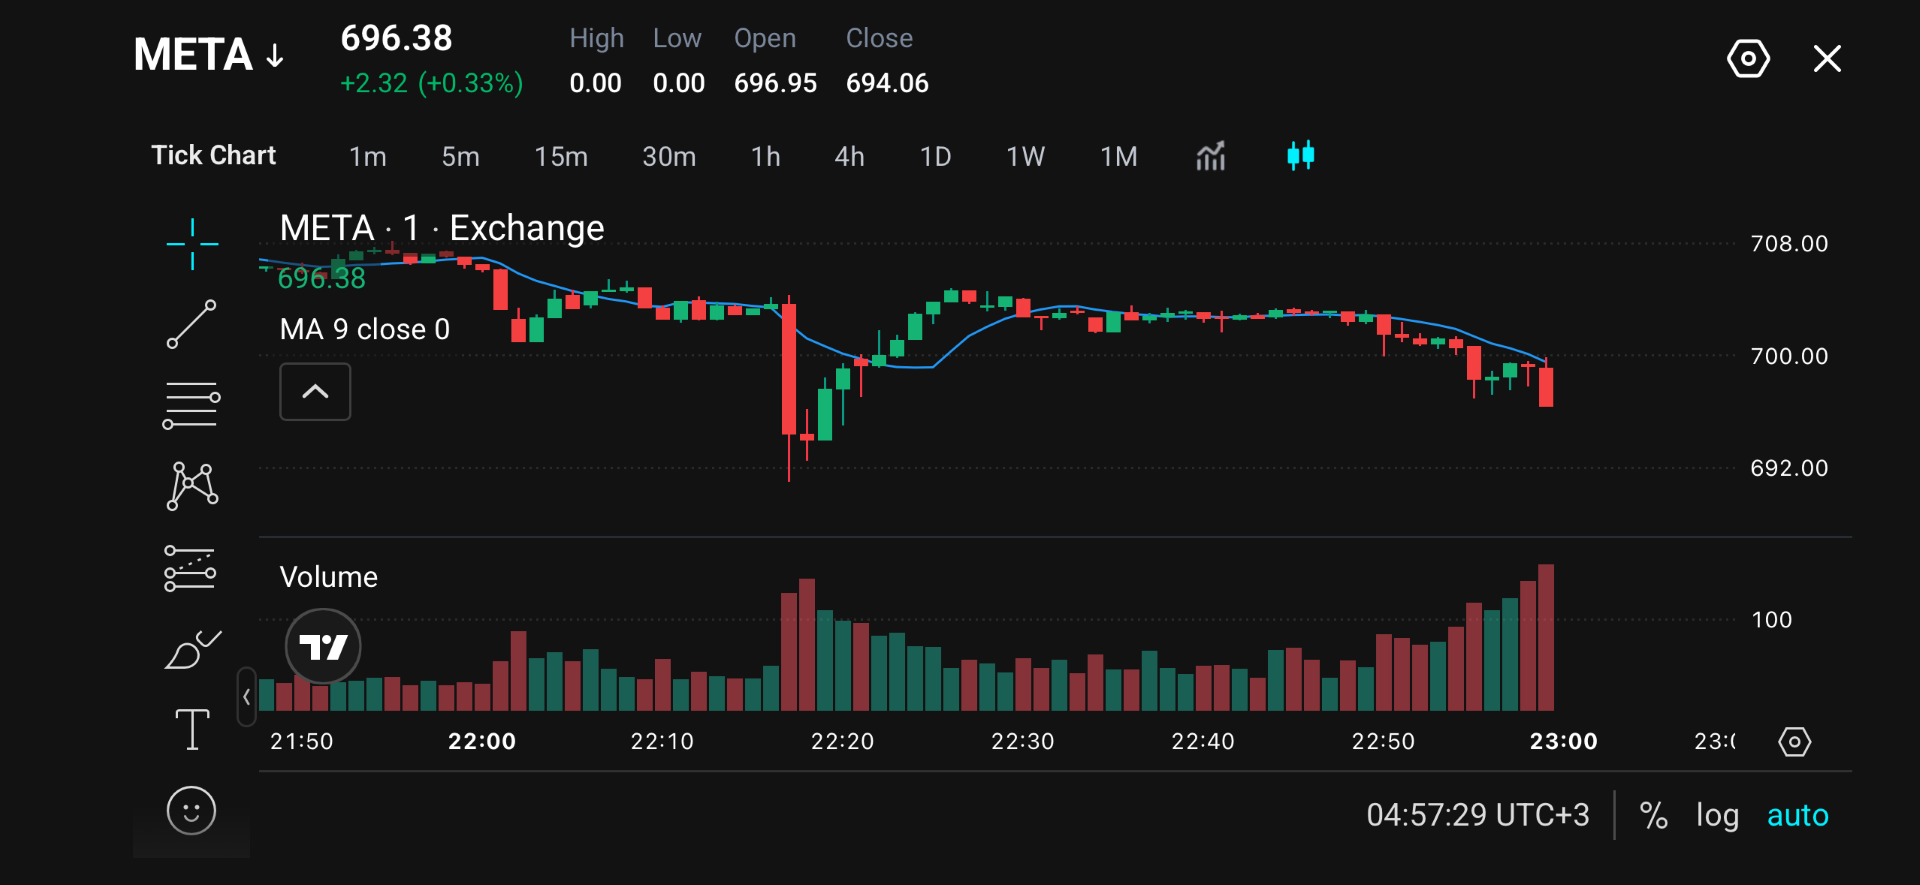
- Meta shares are trading around the 696.38 zone after its recent Q3 revenue results exceeded market expectations.
- Capital spending totalled $34.91 billion, while free cash flow was negative $2.12 billion.
- Investors are weighing whether Meta’s advertising business can fund its expanding AI ambitions.
Market Move
Meta shares advanced in after-hours trading following its October 21 earnings release, as investors weighed the revenue beat against weaker reported earnings.
Stocks are experiencing a short-term pullback from $707–$708 towards $696.38. An earlier rebound from around $691 stalled near $704–$705, followed by renewed selling beneath the nine-period moving average.
Selling volume increased into the final visible decline, suggesting near-term pressure remained.
Why Traders Are Watching
Ad impressions increased 10%, while average advertising prices rose 14%. Management expects Q4 revenue of $73–$76 billion and annual capital expenditure of $135–$145 billion.
These figures give traders two competing signals. Advertising momentum supports the growth case, while the scale of infrastructure investment raises the hurdle for future returns. Stronger engagement and ad performance would become more persuasive if accompanied by improving free cash flow.
Legal exposure adds uncertainty. Meta reported net income of $9.86 billion after recognising a $9.89 billion settlement charge. Separately, the company faces a reported $25 billion New Mexico privacy judgment, adding another potential financial burden.
Key Trading Levels
| Level | Technical Role | Significance |
| $707–$708 | Upper resistance | Highest visible trading area before the initial decline. |
| $704–$705 | Recovery resistance | The rebound stalled here before price returned to a lower range. |
| $702–$703 | Intermediate resistance | Repeated consolidation area that could attract sellers on a retest. |
| $700 | Immediate pivot | Round-number reference near the latest breakdown and moving average. |
| $693–$694 | Initial support | Earlier selling stabilised around this area before price rebounded. |
| $691–$692 | Lower support | Includes the deepest visible wick and the charted range’s lower boundary. |
The $700 area provides an early test of whether buyers can interrupt the latest decline. Trading back above it would bring the former consolidation zone into focus, where traders can assess whether previous support has become resistance.
Below the current price, the earlier rebound area offers the first visible demand reference. Stabilisation during a retest would suggest buyers remain active, while a decisive break would weaken the recovery structure.
Bullish and Bearish Setups
| Scenario | Confirmation to Watch | Potential Levels | What Weakens the Setup |
| Bullish | Recovery above $700, followed by a successful retest | $702–$703, then $704–$705; $707–$708 if momentum extends | Failed retest and renewed selling beneath $700 |
| Bearish | Rejection around $700, followed by a break below $693–$694 | $691–$692 | Sustained recovery through $702–$703 |
The bullish case depends on buyers rebuilding support after the latest pullback. A brief move above the pivot would offer limited confirmation, while holding it during a retest would provide stronger evidence that selling pressure is easing.
The bearish case strengthens if recovery attempts continue to attract sellers and the earlier rebound base gives way. Increasing volume on a support break would reinforce this scenario, while a rapid recovery into the range would raise the risk of a false breakdown.
Disclaimer
The price levels and market scenarios above reflect the author’s assessment at the time of writing. They do not represent financial advice or an official recommendation from VT Markets. Traders should conduct their own analysis and manage risk carefully.
Meta Prediction: What’s Next?
Meta’s next sustained move could depend on whether investors become more confident about the returns from AI investment. Potential upside drivers include resilient advertising demand, better monetisation and evidence that infrastructure spending is translating into stronger cash generation. More predictable spending plans could also help investors assess the earnings outlook.
Potential downside drivers include weaker advertising growth, further increases in investment requirements or additional legal costs. Pressure could intensify if revenue remains strong but cash generation fails to improve. Improving business returns could support a recovery, while persistent concerns over spending and legal exposure could limit rallies.
Trade Meta with VT Markets
Meta’s position as a tech leader makes it a compelling choice for share CFD trading. Explore the possibilities with VT Markets.
Our user-friendly platform caters to all experience levels. Whether you prefer industry-standard MetaTrader 4 or 5, the web-based WebTrader Plus, or the convenience of our mobile app, navigate with ease and execute your trading strategies seamlessly.
Open a live trading account with VT Markets and gain access to bonds, indices, gold and market insights.
Frequently Asked Questions
Did Meta beat Q3 earnings expectations?
Yes, Meta beat Wall Street’s expectations for its third-quarter earnings report on October 21, 2026, delivering stronger-than-expected revenue, earnings, and fourth-quarter guidance.
How much is Meta spending on AI in 2026?
Meta expects capital expenditure of US$135 billion to US$145 billion in 2026. These investments support AI infrastructure, computing capacity and the company’s wider technology operations.
Why is AI spending important for Meta’s outlook?
AI investment could improve advertising performance and create new revenue opportunities. Traders are watching whether those benefits justify the associated infrastructure costs.
What are the main technical levels to watch?
The immediate pivot is around $700. Resistance lies near $702–$705 and $707–$708, with support around $693–$694 and $691–$692.
Will Meta stock go up?
Meta stock rose in extended trading following strong Q3 2026 earnings results and positive guidance, though whether it will keep going up depends on balancing its massive AI spending against core advertising growth
Start trading now — click here to create your real VT Markets account.



