






Key Points
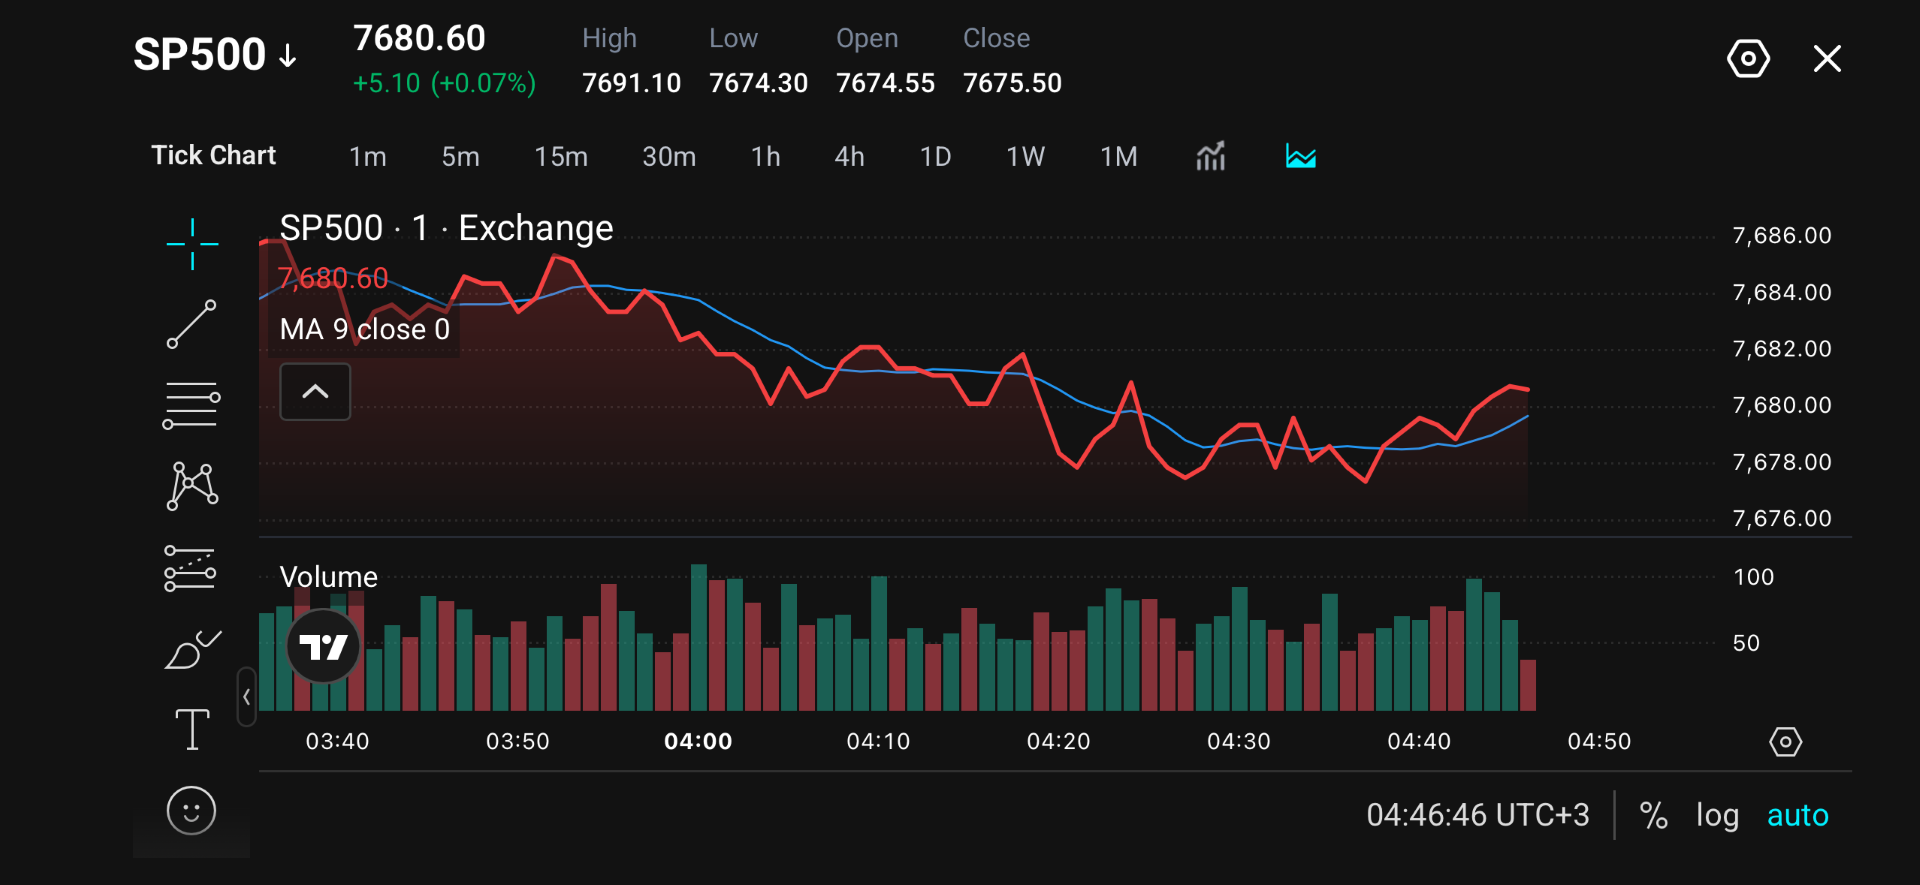
- SP500 is trading around 7,680.60, up approximately 0.07% on the chart provided.
- US nonfarm payrolls are expected to show roughly 90,000 jobs added in September, compared with 162,000 in August, with unemployment expected to remain around 4.1%.
- Treasury yields and oil prices remain major risks for equities. The US 10-year yield briefly reached around 5.34% on Thursday, its highest level since 2002.
- Future SP500 direction could depend on whether the jobs report reinforces or reduces expectations for further Federal Reserve tightening.
Market Move
The SP500 is trading around 7,680.60, after a volatile short-term session. The index traded close to 7,685 to 7,686 before gradually moving lower. Selling accelerated after, taking price towards the 7,677 to 7,678 area.
Buyers subsequently emerged around these lows. The index recovered towards 7,681, while the 9-period moving average flattened and began turning higher. The latest price action shows a short-term recovery within a broader intraday pullback, rather than a confirmed bullish breakout.
Why Traders Are Watching
Friday’s nonfarm payroll data will likely influence US futures and the SP500, and provide further clues for market conditions. The September report is scheduled for 8:30 a.m. ET on 2 October. Markets estimate roughly 89,000 new jobs, down from August’s 162,000, while unemployment is expected to remain at 4.1%.
Fed rates will also be affected as labor market strength gives more room to hike rates, especially as inflation remains above the central bank’s 2% yearly target. Recent gains in US Treasury yields have also kept traders on edge, rising further past 5%, its highest since 2002.
Oil adds another element of uncertainty. Prices surged 4% after reports said the U.S. was sending more troops to the Middle East, elevating inflation concerns as energy costs remain high.
Key Trading Level
| Level | Significance |
| 7,686 | Major short-term resistance and session high area |
| 7,684 | Secondary resistance |
| 7,682 | First resistance to watch |
| 7,680 | Immediate pivot area |
| 7,678 | Initial support |
| 7,676 to 7,677 | Key intraday support zone |
The 7,680 level is particularly important in the immediate term. Price has repeatedly moved around this area, making it a useful short-term dividing line between recovery and renewed weakness.
Bullish and Bearish Setups
| Scenario | Trigger | Potential Targets | What It Could Signal |
| Bullish | Sustained move above 7,682 | 7,684, then 7,686 | Buyers are extending the rebound and challenging the earlier session highs |
| Bearish | Fall below 7,678 | 7,676 to 7,677 | The current recovery is losing momentum and sellers are returning |
Disclaimer
The price levels and market scenarios above reflect the author’s assessment at the time of writing. They do not represent financial advice or an official recommendation from VT Markets. Traders should conduct their own analysis and manage risk carefully.
SP500 Prediction
The upcoming NFP report will affect US futures and the SP500 as it shapes expectations for Federal Reserve policy and Treasury yields. A stronger-than-expected jobs report could reinforce expectations that the US economy remains resilient, increasing the chances of an interest rate hike and potentially pushing yields higher. Both of which would weigh on equity valuations and pressure the SP500.
A moderately weaker report will likely support stocks if it eases rate-hike expectations without raising doubts about economic growth. However, a very weak reading could have a mixed effect, as falling yields may initially support equities, while signs of a weakening labour market could increase recession concerns.
For traders, it’s important to determine whether NFP data shows signs of a labour market cool down, which could ease rate pressures, or a sharper slowdown that raises concerns about the US economy.
Trade SP500 with VT Markets
Economic events largely influence US futures such as the S&P 500. Traders should closely watch key data as market expectations shift.
With VT Markets, traders can access SP500 and other index CFDs alongside forex, gold, oil, share CFDs, ETF CFDs and other global markets through one platform. This allows traders to monitor broad market movements while comparing developments across technology stocks, commodities, currencies and other major asset classes.
Learn more about trading Indices on VT Markets today. Start a live trading account with VT markets and analyse markets today.
FAQ
What is the SP500 trading at now?
The chart provided shows the SP500 around 7,680.60, approximately 0.07% higher at the captured moment.
What are the key SP500 levels to watch?
Immediate resistance sits around 7,682, followed by 7,684 and 7,686. Initial support is around 7,678, with stronger intraday support around 7,676 to 7,677.
How could nonfarm payrolls affect the SP500?
A stronger jobs report could increase expectations for tighter Federal Reserve policy and put upward pressure on Treasury yields, potentially weighing on equities. A softer report could reduce rate pressure, although an unusually weak number could increase concerns about economic growth.
When is the September US nonfarm payrolls report released?
The US Bureau of Labor Statistics has scheduled the September 2026 Employment Situation report for Friday, 2 October 2026 at 8:30 a.m. ET.
Start trading now — click here to create your real VT Markets account.








