






Key Points
- Goldman Sachs (GS) shares declined 1.91% to 916.15 in the latest session, with intraday trading ranging between 914.07 and 930.20.
- Reports of a potential CEO succession plan have placed leadership transition at Goldman Sachs under market attention.
- Current CEO David Solomon could potentially transition toward an executive chairman role, while President and COO John Waldron is viewed as a possible successor.
- The succession plan has not received formal approval, and the timeline remains subject to board decisions.
- GS is trading close to its short-term moving average, showing a period of consolidation after recent weakness.
Market Move
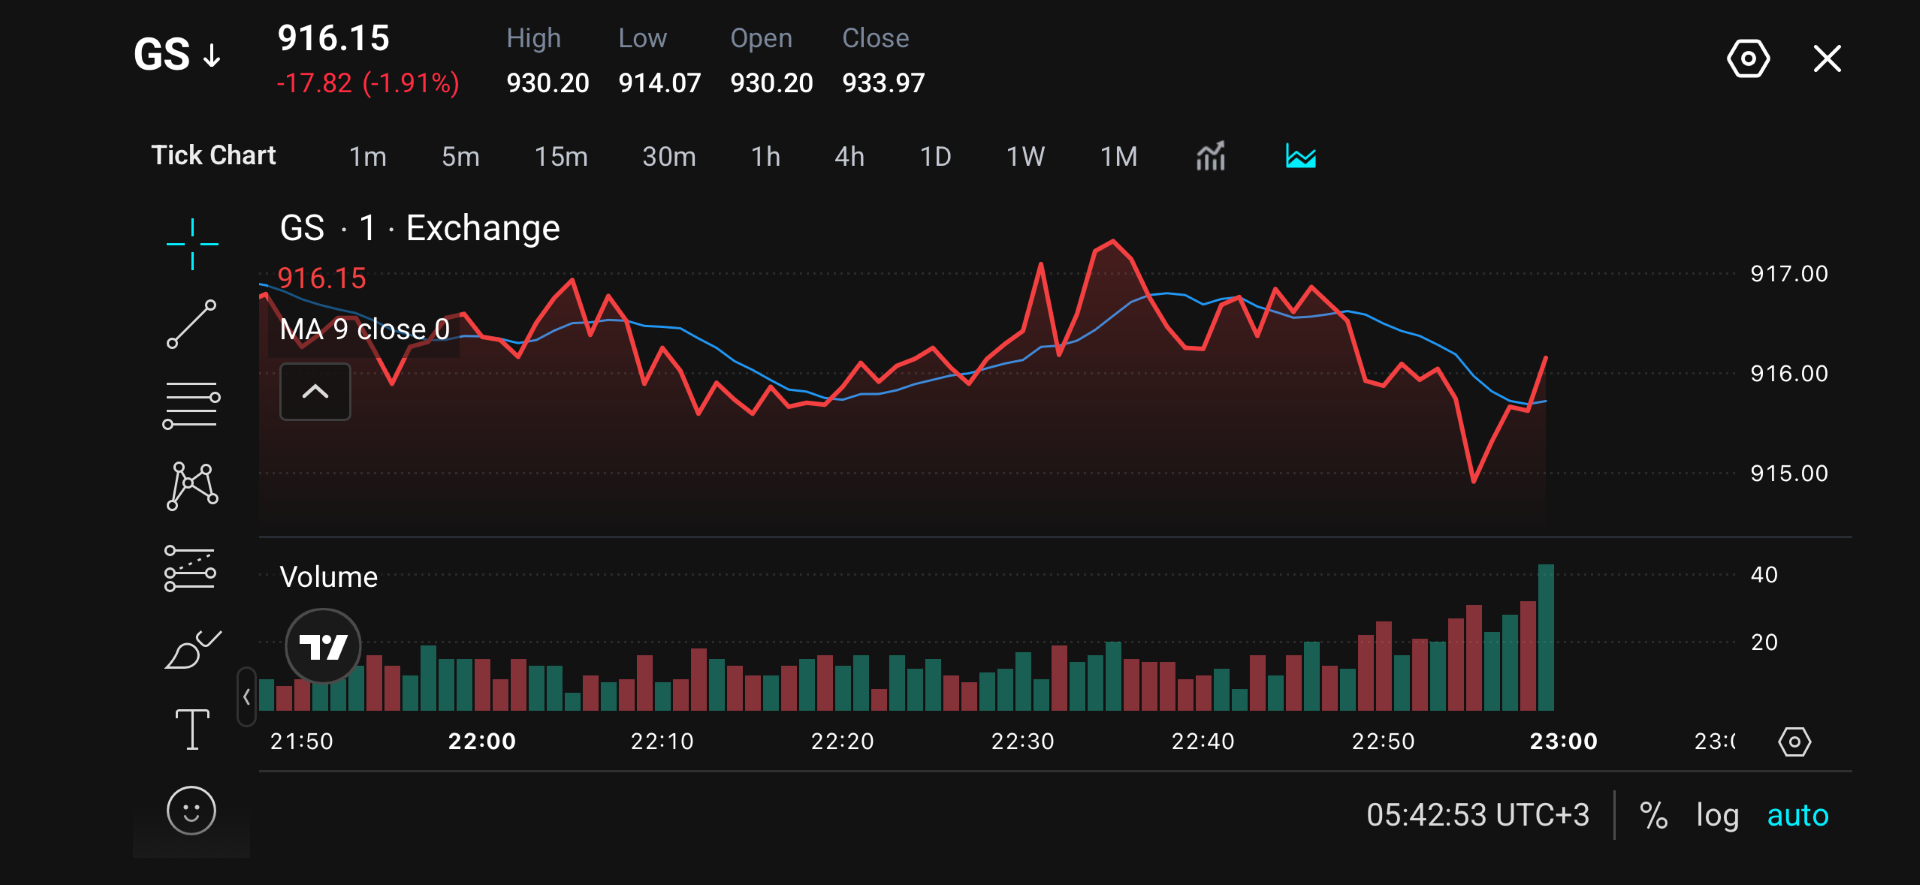
Goldman Sachs shares moved lower, declining 17.82 points or 1.91% to close around 916.15. The stock opened at 930.20, reached a high of 930.20, and fell to an intraday low of 914.07.
The stock briefly tested above 917.00 before reversing lower. The MA 9 indicator is positioned around the 915.80–916.00 zone, with the current price slightly above this level. This suggests short-term momentum has stabilised, although upside continuation remains limited unless buyers regain control above nearby resistance levels.
Why Traders Are Watching
The decline came as investors evaluated reports surrounding Goldman Sachs’ leadership succession discussions. While CEO transitions at major financial institutions can influence expectations around business strategy, risk management and capital allocation, the bank has maintained strong performance in recent years, supported by trading activity and increased volatility across global markets.
For Goldman Sachs, traders are monitoring whether a transition involving John Waldron would maintain the firm’s current focus on trading and investment banking, which have contributed to earnings growth in recent periods. The reaction in GS shares suggests investors are weighing transitional uncertainty against the bank’s operational strength.
Key Trading Levels
| Level | Price | Explanation |
| Resistance 1 | 917 | Recent intraday high zone where sellers appeared |
| Resistance 2 | 930.2 | Session high and key recovery level |
| Support 1 | 915 | Intraday low and short-term buying area |
| Support 2 | 914 | Breakdown level if selling pressure returns |
GS is currently trading around 916.15, slightly above the MA 9 indicator. The short-term structure remains neutral while price holds between the 914.00–917.00 range.
Bullish and Bearish Setups
| Scenario | Conditions | Potential Levels |
| Bullish Setup | GS holds above 915.00 and breaks above 917.00 | Next resistance around 930.20, followed by previous highs |
| Bearish Setup | GS falls below 914.00 with increased selling pressure | Downside focus could shift toward lower support zones |
For a bullish setup, a recovery above 917.00 could indicate renewed buying interest after the recent pullback. If momentum improves, traders may look toward the 930.20 resistance area, where the stock previously faced selling pressure.
For a bearish scenario, a break below 914.00 could signal that sellers remain in control. Further weakness may develop if investors continue reducing exposure.
Disclaimer
The price levels and market scenarios above reflect the author’s assessment at the time of writing. They do not represent financial advice or an official recommendation from VT Markets. Traders should conduct their own analysis and manage risk carefully.
GS Prediction: What’s next?
Goldman Sachs shares are likely to remain sensitive to updates regarding CEO succession plans and broader financial sector sentiment.
A confirmed leadership transition with a clear timeline could help reduce uncertainty, while unexpected changes could increase volatility. Beyond succession concerns, GS performance will continue to depend on trading revenue, investment banking activity, interest rate expectations and overall market conditions as these factors could greatly affect performance.
Trade GS with VT Markets
Access Goldman Sachs stock trading opportunities with VT Markets and monitor price movements driven by corporate developments, market sentiment and broader financial trends.
Create a live VT Markets account today to access our platform features, including market insights and educational content.
Discover assets such as gold, forex, indices and more.
Frequently Asked Questions
Why did Goldman Sachs shares fall?
Goldman Sachs shares declined as investors assessed reports regarding potential CEO succession discussions involving current CEO David Solomon and President John Waldron.
Who could become the next Goldman Sachs CEO?
Reports have identified John Waldron, Goldman Sachs’ President and COO, as a possible successor. However, the timeline has not been formally approved by the board.
How did GS perform during the session?
GS closed at 916.15, down 1.91%, after trading between 914.07 and 930.20.
What are the key technical levels for GS?
The main short-term levels are 917.00 resistance, 930.20 resistance, and 914.00 support.
What factors could affect Goldman Sachs stock next?
Traders will monitor succession developments, earnings performance, financial market activity, interest rate expectations and regulatory developments.
Start trading now — click here to create your real VT Markets account.








