






Key Points
- The S&P 500 started September lower as rising oil prices and renewed Middle East tensions increased inflation concerns.
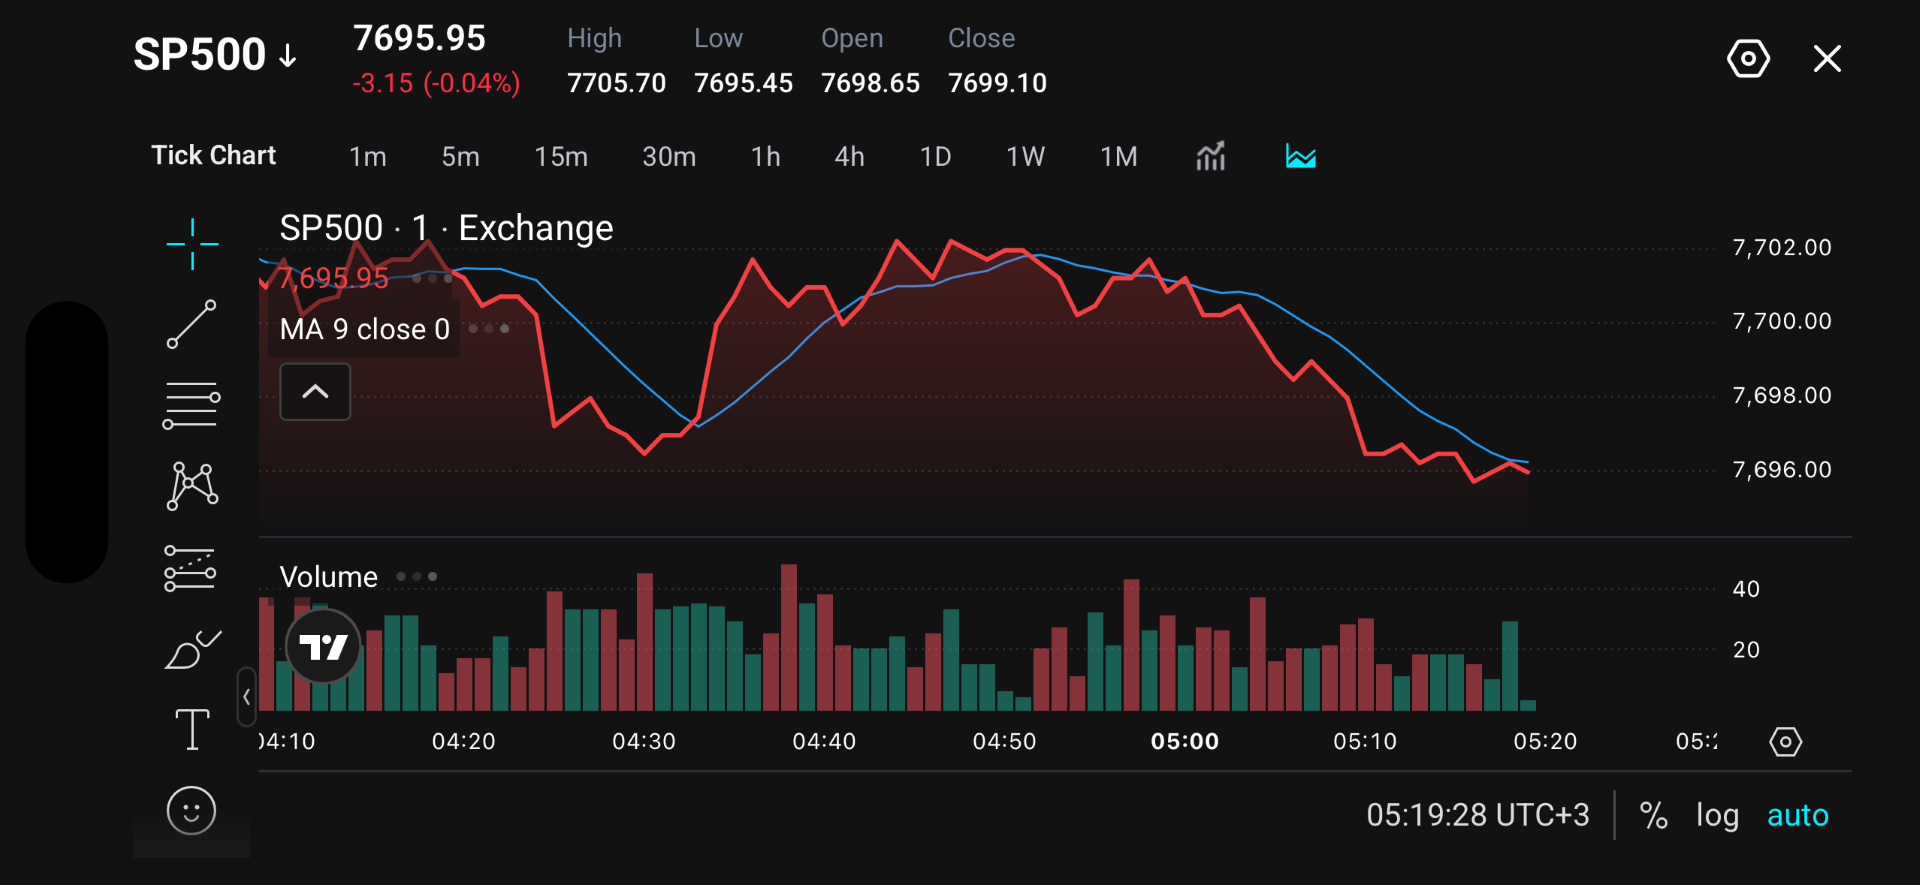
- The index is trading near the 7,696 area after retreating from the session high near 7,706.
- Higher energy prices pushed Treasury yields higher, adding pressure on equity valuations and risk sentiment.
- Traders are monitoring upcoming US economic data, including manufacturing activity and the August jobs report, for further market direction.
The S&P 500 came under pressure at the start of September as investors assessed the impact of higher oil prices, inflation risks and shifting Federal Reserve expectations.
Wall Street ended Monday’s session in negative territory, with the Dow Jones Industrial Average falling 0.7%, while the S&P 500 and Nasdaq Composite declined 0.33% and 0.12% respectively.
The decline came as renewed crude price gains increased concerns that inflation pressures could persist, potentially limiting expectations for easier monetary policy.
Why Traders Are Watching
The latest market move highlights the sensitivity of equities to changes in energy prices, Treasury yields and Federal Reserve policy expectations.
Rising oil prices have become a key focus as renewed tensions around the Strait of Hormuz raise concerns over energy supply and inflation risks.
The rise in Treasury yields also added another challenge for equities, as higher borrowing costs and discount rates can pressure stock valuations, particularly in growth-sensitive sectors.
With oil prices also increasing, investors are reassessing whether renewed inflation risks could delay potential Federal Reserve easing and keep financial conditions tighter for longer.
Key Trading Levels
| Price Level | What Traders Are Watching |
| 7,706 | Session high and immediate resistance area |
| 7,700 | Psychological resistance and recovery level |
| 7,696 | Current trading area and near-term reference |
| 7,695 | Immediate support near recent low |
| 7,680 | Next support area if selling pressure increases |
The S&P 500 is trading around the 7,696 area after retreating from the intraday high near 7,706.
A move above 7,700 could indicate improving short-term momentum, with a break above 7,706 suggesting buyers are attempting to regain control.
On the downside, a break below 7,695 could increase selling pressure and expose the 7,680 support area.
Bullish and Bearish Setups
| Setup | Trigger | Potential Market Reaction |
| Recovery Attempt | Hold above 7,695 | S&P 500 may retest the 7,700–7,706 resistance zone |
| Bullish Breakout | Break above 7,706 | Momentum could strengthen towards higher levels |
| Range Consolidation | Hold between 7,695 and 7,706 | Index may continue consolidating as traders await new catalysts |
| Bearish Breakdown | Fall below 7,695 | Selling pressure could increase towards 7,680 |
The bullish scenario depends on the S&P 500 maintaining support above 7,695 and recovering towards the 7,700–7,706 resistance area. A sustained break above 7,706 could indicate stronger buying momentum.
The bearish scenario becomes more relevant if the index falls below 7,695, suggesting sellers remain in control and increasing the risk of further downside.
Disclaimer
The price levels and market scenarios above reflect the author’s assessment at the time of writing. They do not represent financial advice or an official recommendation from VT Markets. Traders should conduct their own analysis and manage risk carefully.
Trade S&P 500 CFDs with VT Markets
The S&P 500 remains closely monitored as traders assess equity market conditions, Federal Reserve expectations and broader economic developments.
With VT Markets, traders can access S&P 500 CFDs alongside global indices, forex, commodities, shares, ETFs and other CFD markets through one platform.
Start trading index CFDs with VT Markets.
Why Trade S&P 500 CFDs With VT Markets?
S&P 500 CFDs allow traders to follow movements in one of the world’s most widely tracked equity indices without owning the underlying shares.
This flexibility allows traders to respond to changes in economic data, corporate earnings, interest-rate expectations and market sentiment.
VT Markets provides charting tools and market resources to help traders monitor price movements and analyse changing market conditions.
What to Watch Next
The S&P 500’s next move will depend on how markets assess the impact of higher energy prices, Treasury yields and upcoming economic data.
Key factors include:
- Oil price developments: Further movements in energy markets and their impact on inflation expectations and equity sentiment.
- Federal Reserve expectations: Economic data and policy signals that could influence the future interest-rate outlook.
- Treasury yields: Continued changes in bond markets and their impact on equity valuations, particularly growth-sensitive sectors.
- US economic data: Manufacturing activity, services data and the August jobs report for further clues on economic momentum.
- Market sentiment: The ability of equities to stabilise after the recent pullback or face further downside pressure.
From a technical perspective, traders are watching whether the S&P 500 can reclaim the 7,706 resistance area, while 7,695 remains the key short-term support level.
FAQ
Why is the S&P 500 under pressure?
The S&P 500 is under pressure as rising oil prices increase inflation concerns and influence expectations around Federal Reserve policy.
How do oil prices affect the S&P 500?
Higher oil prices can increase inflation risks and business costs, which may affect investor sentiment and equity valuations.
Why are Treasury yields important for the S&P 500?
Higher Treasury yields can increase borrowing costs and reduce the relative attractiveness of equities, particularly for growth-focused companies.
What are the key S&P 500 levels to watch?
Traders are monitoring 7,706 as resistance and 7,695 as the immediate support level.
What could support the S&P 500?
Lower inflation pressure, stable Treasury yields and improved expectations around monetary policy could help support equity markets.
Start trading now — click here to create your real VT Markets account.








