





Swing highs and swing lows are price turning points that reveal market structure and trend direction. A swing high is a peak with lower highs on either side; a swing low is a trough with higher lows on either side. Together, they show whether a market is trending up (higher highs, higher lows) or down (lower highs, lower lows). This guide covers how to spot swing points in CFD markets, use them to read trends and structure breaks, apply them to entries, stop-losses and targets, and combine them with position sizing and the 2% risk rule on MetaTrader 4 and MetaTrader 5.
Key Takeaways:
- A swing high is a peak with lower highs on either side. A swing low is a trough with higher lows on either side.
- Swing points form the building blocks of market structure, showing trend direction, reversals, and clean support and resistance levels.
- The three-candle method is the simplest way to mark swing highs and swing lows in CFD market charts, on any instrument and timeframe.
- Stop-loss placement, position sizing, and the 2% rule turn swing analysis into a repeatable process.
Price rarely moves in a straight line. It climbs, stalls, pulls back, then pushes on again. Those turning points are your map, and reading them properly is the first real skill in technical analysis.
This guide covers what swing points are, how to spot them, how to read trend direction, how to trade them, and how to control risk around them. Each section breaks into practical sub-steps, so you can apply swing highs and swing lows in CFD market analysis to your own charts straight away.
What Is a Swing High and Swing Low?
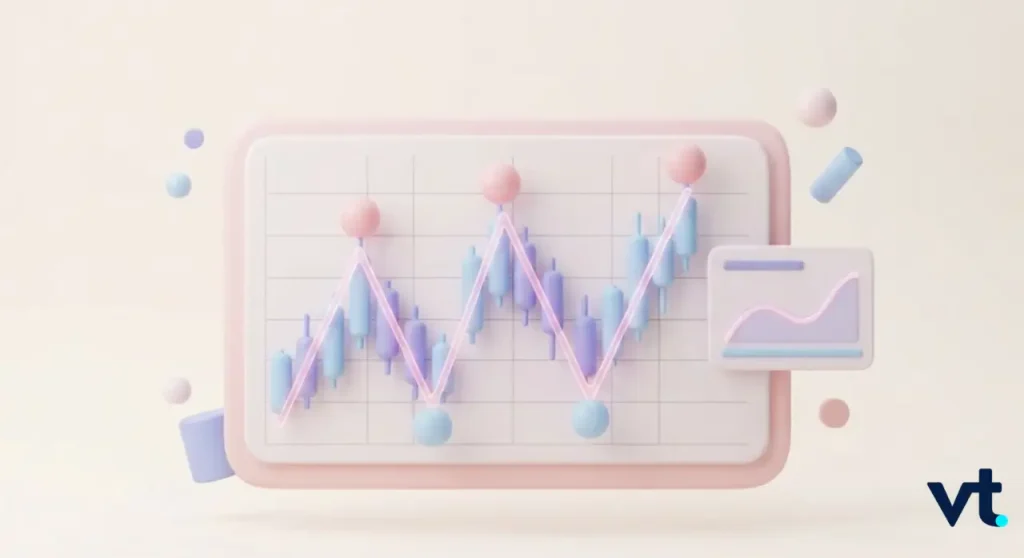
Before you can trade structure, you need a clear definition. What is a swing high and swing low? A swing high is a price peak sitting higher than the price action immediately to its left and right. A swing low is a trough sitting lower than the price action either side of it. Both mark the points where buying and selling pressure changed hands.
The Anatomy of a Swing Point
Think of a chart as a mountain range. The peaks are swing highs. The valleys are swing lows. Neither is confirmed until price has moved away and printed the candles on the right-hand side. That lag is not a flaw. It is the cost of having an objective rule rather than a guess.
| Feature | Swing High | Swing Low |
| Shape on chart | Peak | Trough |
| Surrounding candles | Lower highs both sides | Higher lows both sides |
| Acts as | Potential resistance | Potential support |
| Stop placement | Above it, for shorts | Below it, for longs |
| Signals | Sellers took control | Buyers took control |
Why Swing Points Matter For Market Structure
Every trend, range, and reversal is described by the sequence of these points. Read that sequence correctly and the chart stops looking random. Swing points give you four things at once:
- A trend read, through the pattern of higher highs and higher lows
- Objective levels for support and resistance
- Logical reference points for stops and targets
- An early warning when a trend reversal may be forming
How to Identify Swing Highs and Swing Lows in CFD Market Charts
Identification is mechanical once you have a rule. The three methods below work the same way on forex, gold, indices, or share CFDs.
1.The Three-Candle Method
This is the quickest rule and the one most traders start with.
- Take any three consecutive candles on a candlestick chart
- Middle candle’s high above both neighbours means a swing high
- Middle candle’s low below both neighbours means a swing low
- Wait for the third candle to close before marking anything
An illustrative example on EUR/USD:
Candle one prints a high of 1.0870, candle two prints 1.0895, and candle three prints 1.0882. Candle two is your swing high at 1.0895. For cleaner charts, widen the rule. Requiring two lower highs on each side filters out much of the noise, which is the principle behind Bill Williams’ fractals.
2.Using Wicks Rather Than Bodies
Swing points are usually taken from the wick, not the candle body. Bodies show where price settled. Wicks show how far price actually probed before it was rejected. That difference matters most when placing stops, because the wick marks the true extreme other traders can see.
3.Choosing The Right Timeframe
A swing low on a five-minute chart can be meaningless on a four-hour chart. Always establish the higher timeframe picture first, then drop down for entries.
| Timeframe | Typical use | Weight of swing point |
| M5 to M15 | Fine-tuning entries | Low, high noise |
| H1 to H4 | Main swing structure | Medium to high |
| Daily | Dominant trend bias | High |
| Weekly | Major turning points | Very high |
Pro tip: Mark the daily swing points first and leave them on your chart. Any lower timeframe setup that lines up with one of them carries far more weight.
Reading Trend Direction From Swing Highs and Swing Lows in CFD Market Structure
Once your swing points are marked, the trend read is almost automatic. You simply compare each peak and trough to the one before it.
Uptrends, Downtrends, And Ranges
- Uptrend: each swing high is higher than the last, and each swing low is higher than the last
- Downtrend: each swing high is lower than the last, and each swing low is lower than the last
- Range: price bounces between a fixed peak and trough without making meaningful new extremes
A trend is generally considered intact until a significant swing point is decisively broken.
Spotting A Break Of Structure
A break of structure happens when that sequence fails. In an uptrend, price stops making higher highs and then closes below the most recent swing low.
Illustrative example on gold:
Price rallies from 2,380 to 2,450, pulls back to 2,415, then stalls at 2,442. A later close below 2,415 breaks the uptrend structure, and the bias flips to neutral or bearish.
How to Trade Swing Highs and Lows
Knowing where the points are is only half the job. How to trade swing highs and lows? You need an entry rule, a stop, and a target, written down before you click anything.
The Pullback Entry
This approach keeps you trading with the trend rather than against it.
- Confirm an uptrend through rising swing highs and swing lows
- Wait for a pullback towards a prior swing low or a Fibonacci retracement zone, often the 50% or 61.8% level
- Look for a rejection candle there as confirmation
- Enter after that candle closes, with the stop below the pullback low
- Take the prior swing high as your first target
The Breakout Entry
Here you trade the moment structure extends rather than the pullback into it.
- Mark the most recent swing high in an uptrend
- Wait for a candle to close above it, not merely wick through it
- Enter on the close, or on a shallow retest of the broken level
- Place the stop below the swing low that preceded the breakout
A close above the level filters out many false breaks. A wick alone does not.
Building A Swing Highs and Swing Lows in CFD Market Strategy
A complete swing highs and swing lows in cfd market strategy needs more than an entry signal. Combine these elements:
- One trend filter, such as a 50-period moving average or the daily structure
- One confirmation tool, such as RSI turning up from oversold at a swing low
- A stop rule tied to structure, never to a round number of pips
- A minimum risk-reward ratio, commonly 1:2
- A written rule for standing aside when swing points overlap
Pro tip: if you cannot label the trend in five seconds, the market is ranging. Reduce size or wait.
Learn more about the difference between swing trading and day trading to know which fits your trading style the best.
Risk Control: What Is the 2% Rule in Swing Trading?
Structure tells you where to trade. Risk control decides whether you are still trading next year. What is the 2% rule in swing trading? It is a simple cap: never risk more than 2% of your account balance on any single position.
1. Position Sizing With The 2% Rule
Here’s an illustrative example:
You hold a $5,000 account, so your 2% cap is $100. You want to buy EUR/USD at 1.0850 with a stop below the swing low at 1.0800, a distance of 50 pips.
On a standard lot, one pip is worth roughly $10, so 50 pips costs $500 per lot. Dividing your $100 risk by $500 gives a position size of 0.2 lots. If your first target is the prior swing high at 1.0950, that is 100 pips of reward against 50 pips of risk, a 1:2 ratio.
| Account balance | 2% risk cap | Stop distance | Position size |
| $1,000 | $20 | 50 pips | 0.04 lots |
| $5,000 | $100 | 50 pips | 0.20 lots |
| $10,000 | $200 | 50 pips | 0.40 lots |
| $25,000 | $500 | 50 pips | 1.00 lots |
Notice that the stop distance is set by the chart and the position size adjusts around it. Sizing first, then squeezing the stop to fit, is how accounts get damaged.
2. Stop-Loss Placement And Liquidity Sweeps
Stop orders cluster in obvious places, just below swing lows and just above swing highs. That concentration can attract sharp spikes through the level before price reverses, often described as a liquidity sweep. Practical adjustments:
- Add a buffer beyond the wick rather than sitting exactly on the level
- Size that buffer using recent volatility, such as a fraction of the average true range
- Treat a spike through a level that immediately reverses as information, not bad luck
- Never widen a stop once the trade is live
On the MetaTrader 4 and MetaTrader 5 platforms offered by VT Markets, you can attach stop-loss and take-profit levels at the point of entry, which removes the temptation to improvise mid-trade.
Tools That Help You Confirm Swing Points
Marking swings by hand trains your eye. Indicators check that work rather than replace it.
- ZigZag indicator: filters smaller moves and highlights major swings, though it redraws as new prices arrive
- Fractals indicator: places arrows on candles meeting a fixed pattern, useful for scanning quickly
- Pivot points: calculated from the previous session’s high, low, and close, and sometimes aligned with visual swing points
These tools describe the past. They confirm structure. They do not predict the next move.
Common Mistakes When Reading Swing Highs and Swing Lows in CFD Market Analysis
Most errors come from impatience rather than a lack of knowledge:
- Labelling every small wiggle as a swing point, especially on low timeframes
- Acting before the confirming candle has closed
- Ignoring the higher timeframe and trading against the dominant trend
- Placing stops exactly on the obvious level with no buffer
- Adding to a loser because the swing low “should” hold
Pro tip: Keep a screenshot log of every setup, marked up before and after. Reviewing twenty of those teaches you more about your own tendencies than any indicator.
Frequently Asked Questions (FAQs)
Q1: How many candles are needed to confirm a swing high or swing low?
The most common rule uses three candles, with the middle candle’s high or low sitting beyond both neighbours. Wider settings of five or seven candles leave only the more significant turning points.
Q2: Are swing points the same as pivot points?
No. Pivot points are calculated from a fixed formula using the previous period’s high, low, and close. Swing points are read directly from actual turning points on the chart.
Q3: Do swing highs and swing lows work on all CFD instruments?
Yes. As the concept is based on price action rather than a specific asset, the same rules apply to forex, gold, indices, and share CFDs. You simply adjust the timeframe and the stop buffer to suit each instrument’s volatility.
Q4: Should I use an indicator or mark swing points manually?
Start manually. Marking swings by hand builds pattern recognition that no indicator can give you. Once your eye is trained, ZigZag or Fractals become a useful second opinion rather than a crutch.
Q5: What timeframe is best for swing trading CFDs?
Many swing traders set direction on the daily chart and time entries on the four-hour. That combination gives a stable trend read with enough detail to place a sensible stop.
Start Reading Market Structure With VT Markets
Learning to identify swing highs and swing lows in CFD market conditions changes how a chart looks. Peaks and troughs stop being noise and become decision points, with defined entries, defined stops, and a defined reason to stay out.
Mark levels patiently, wait for the candle to close, size every position against a fixed risk cap, and review your trades afterwards.
With VT Markets, you can apply your swing highs and swing lows in CFD market analysis across forex, gold, indices, and share CFDs on both MetaTrader 4 and MetaTrader 5, backed by the charting and risk management tools you need to trade structure properly.
Create a live VT Markets account today to access our platform features, including market insights and educational content.








