







Key Points
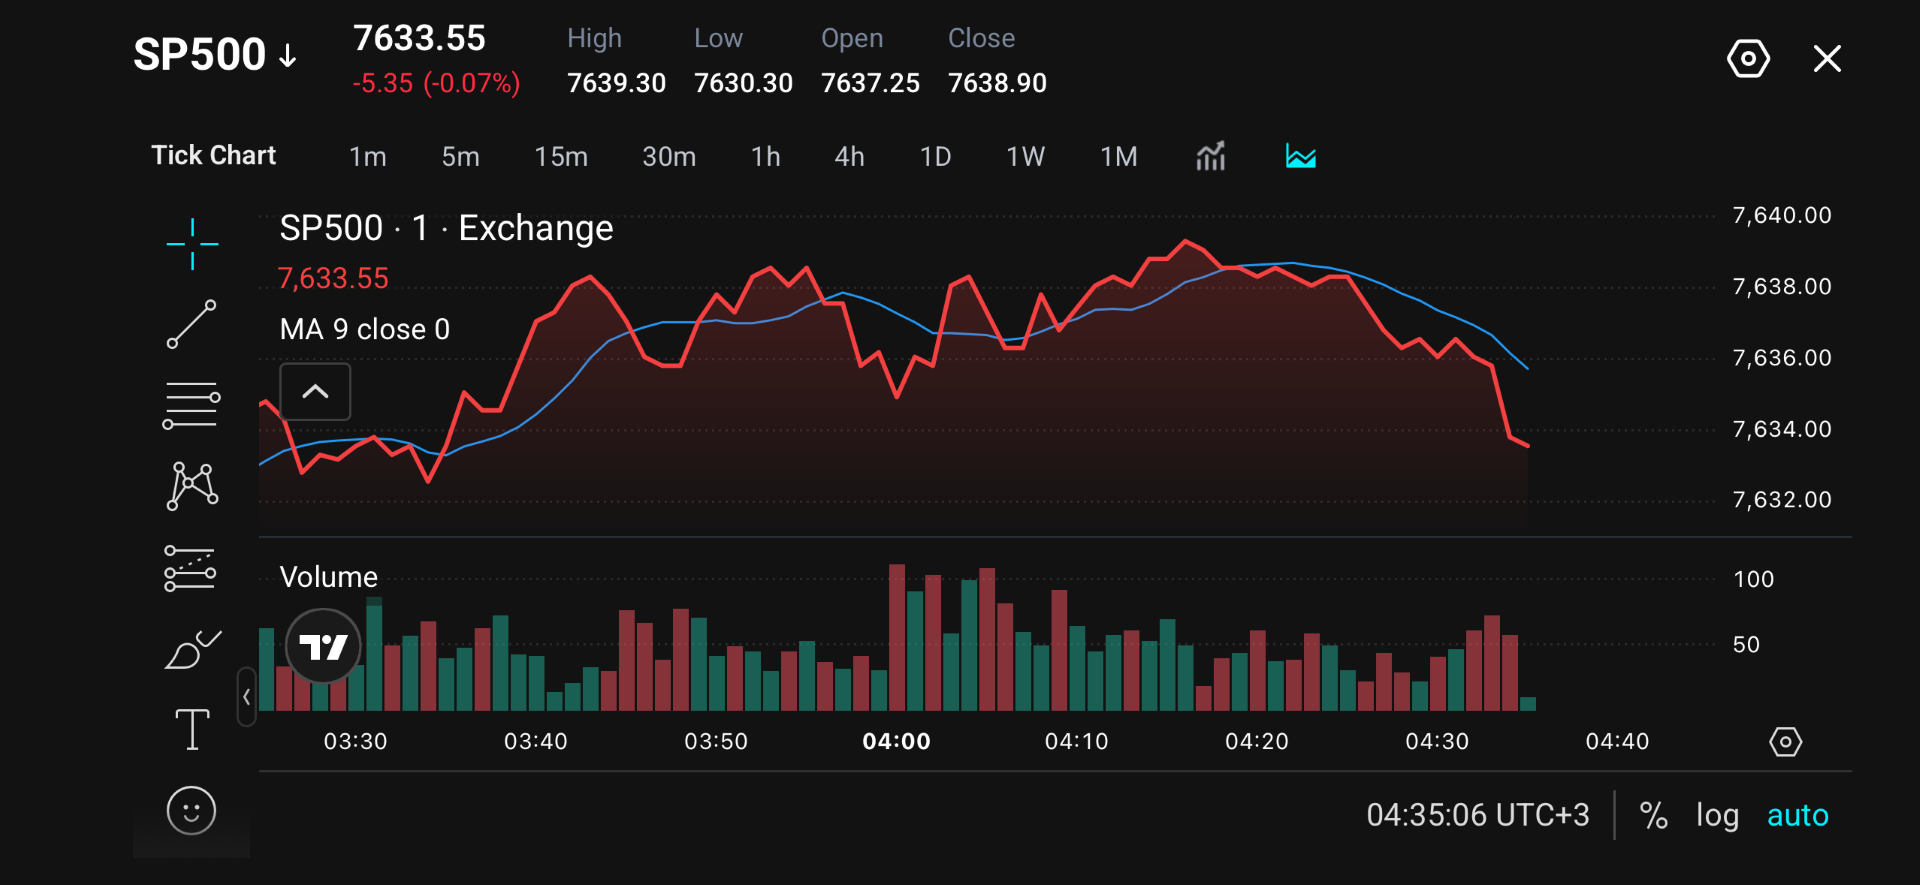
- SP500 is trading near 7,633.55 after slipping below its 9-period moving average.
- Markets are heavily positioned for a 25-basis-point Fed hike on 16 September, interest-rate futures reached a 95% probability on 14 September.
- August CPI rose 0.4% month-on-month and 3.4% year-on-year, while core CPI increased 0.3% month-on-month, increasing the probability of a Fed rate hike.
- Treasury yields, USDX, gold and US indices remain in focus as the Fed’s next move will drive a large market reaction.
Market Move
SP500 is holding near 7,633.55 after trading between a session low of 7,630.30 and a high of 7,639.30.
Price initially recovered from the lower end of the range and repeatedly tested the 7,638-7,639 area, but buyers failed to establish a sustained breakout. Momentum then weakened, with the price forming lower highs and moving below the 9-period moving average.
The immediate technical structure is slightly bearish while price remains below the short-term moving average.
Why Traders Are Watching
The Federal Reserve begins its two-day meeting on 15 September, with the policy decision due on 16 September at 2:00 p.m. ET. Markets maintain a strong expectation of a hike, with many pushing for a 90% probability.
The shift has been driven by a combination of stronger employment and inflation pressure.
August payrolls increased by 162,000, well above forecasts of around 55,000, while unemployment remained at 4.1%.
Meanwhile, headline CPI rose 0.4% month-on-month in August after just 0.1% in July, while annual inflation remained at 3.4%. Core CPI rose 0.3% month-on-month, above expectations for 0.2%, although annual core inflation eased to 2.4% from 2.5%.
Combined with oil prices above $100, reports have kept expectations high for tighter monetary policy, which supports treasury yields and the US dollar while putting pressure on equities and gold.
Key Trading Levels
| Level | Type | What Traders Are Watching |
| 7,640 | Major intraday resistance | Psychological level |
| 7,639.30 | Resistance | Session high and main breakout trigger |
| 7,638.00 | Resistance | Area where several intraday rallies stalled |
| 7,635.50-7,636.00 | Pivot / MA zone | Short-term moving-average area |
| 7,633.55 | Current zone | Latest price on the chart |
| 7,632.00 | Support | Visible intraday price floor |
| 7,630.30 | Key support | Session low and main downside trigger |
SP500 has lost the 9-period moving average after failing several times near 7,638-7,639.30. Reclaiming 7,636 would be the first sign that selling pressure is easing, but a stronger bullish signal requires a break above the session high.
On the downside, 7,632 provides the first nearby support. A move through 7,630.30 would create a fresh intraday low and strengthen the short-term bearish structure.
Bullish and Bearish Setups
| Setup | Trigger | Potential Market Reaction |
| Bullish Recovery | Reclaim 7,636 and hold above the 9-period MA | Opens a retest of 7,638 |
| Bullish Breakout | Break and hold above 7,639.30 | Brings 7,640 and higher levels into focus |
| Bearish Continuation | Remain below 7,636 and break 7,632 | Keeps sellers in control towards 7,630.30 |
| Stronger Bearish Break | Move below 7,630.30 | Confirms a intraday low and could accelerate a downtrend |
| FOMC Range | Remain between 7,630.30 and 7,639.30 | Consolidation may continue until the Fed makes the next major move |
The bullish scenario requires SP500 to reverse the decline and move back above its short-term moving average. A recovery through 7,638 followed by a break of 7,639.30 would show buyers regaining control.
The bearish setup remains active while price trades below 7,636. A break under 7,632, followed by the session low at 7,630.30, would suggest that sellers are gaining momentum ahead of the Federal Open Market Committee (FOMC) decision.
Disclaimer
The price levels and market scenarios above reflect the author’s assessment at the time of writing. They do not represent financial advice or an official recommendation from VT Markets. Traders should conduct their own analysis and manage risk carefully.
SP500 Prediction: What Happens Next?
A hawkish hike, where the Fed raises rates and signals that additional tightening may be required, could push Treasury yields and the dollar higher. That would raise discount rates for equities and could put renewed pressure on SP500, particularly rate-sensitive growth and technology shares.
A dovish hike would produce a different reaction. If the Fed raises rates but signals that future decisions will depend on data, markets may view the move as a limited policy adjustment rather than the start of a broader tightening cycle. That could allow yields to stabilise and give equities room to recover.
A surprise hold could initially weaken the dollar and support gold and stocks. However, with markets already heavily positioned for a rate hike, the bond-market reaction will be important. If the Fed holds rates, investors may question whether policy is restrictive enough to contain inflation, which could push longer-term Treasury yields higher.
Cross-market confirmation will be important. Traders should monitor USDX, the 10-year Treasury yield and gold immediately after the decision. A rise in yields and the dollar would support the hawkish hike, while falling yields and a softer USD could signal that markets see the Fed’s announcement as less restrictive than predicted.
Trade SP500 with VT Markets
SP500 gives traders exposure to the performance of major US companies through a single index.
With VT Markets, traders can access index CFDs alongside forex, precious metals, commodities, shares, ETFs and other global CFD markets from one account.
Trade index CFDs with VT Markets
Why Trade SP500 with VT Markets
VT Markets provides access to major global indices through platforms including MetaTrader 4, MetaTrader 5, TradingView and the VT Markets App, allowing traders to follow markets and manage positions around key events.
Traders can also monitor related markets such as USDX, gold and US indices from the same trading platform, which can be useful when analysing cross-market reactions to changes in inflation, Treasury yields and Federal Reserve expectations.
FAQ
What is the market expecting from the September FOMC meeting?
Markets are heavily expecting a 25-basis-point rate increase.
Why could the Fed raise interest rates?
Inflation remains above the Fed’s 2% objective. Strong employment and elevated oil prices have added to the case for tighter policy.
How could a hawkish Fed affect SP500?
A hawkish outcome could push Treasury yields and the US dollar higher. Higher yields increase financing costs and the discount rate applied to future corporate earnings, which can create pressure on equity valuations.
What would a dovish Fed outcome mean for SP500?
A dovish message could reduce expectations for additional rate increases. If Treasury yields fall as a result, SP500 could find support, particularly if traders conclude that September’s increase will not develop into a prolonged tightening cycle.
What should traders watch after the FOMC decision?
Traders should monitor the Treasury yields, USDX and gold. Rising yields and a stronger dollar would indicate markets have interpreted the Fed as hawkish. Falling yields, a weaker dollar and firmer gold could point towards a less restrictive interpretation.
Start trading now — click here to create your real VT Markets account.








