







Key Points
- GBP/USD has declined nearly 2.5% from its August high after breaking below the September opening range.
- Sterling is approaching a key support area after failing to hold above recent resistance levels.
- The pair remains below the short-term moving average, showing continued selling pressure.
- Upcoming UK and US PMI data could influence the next move as traders reassess economic momentum.
Market Move
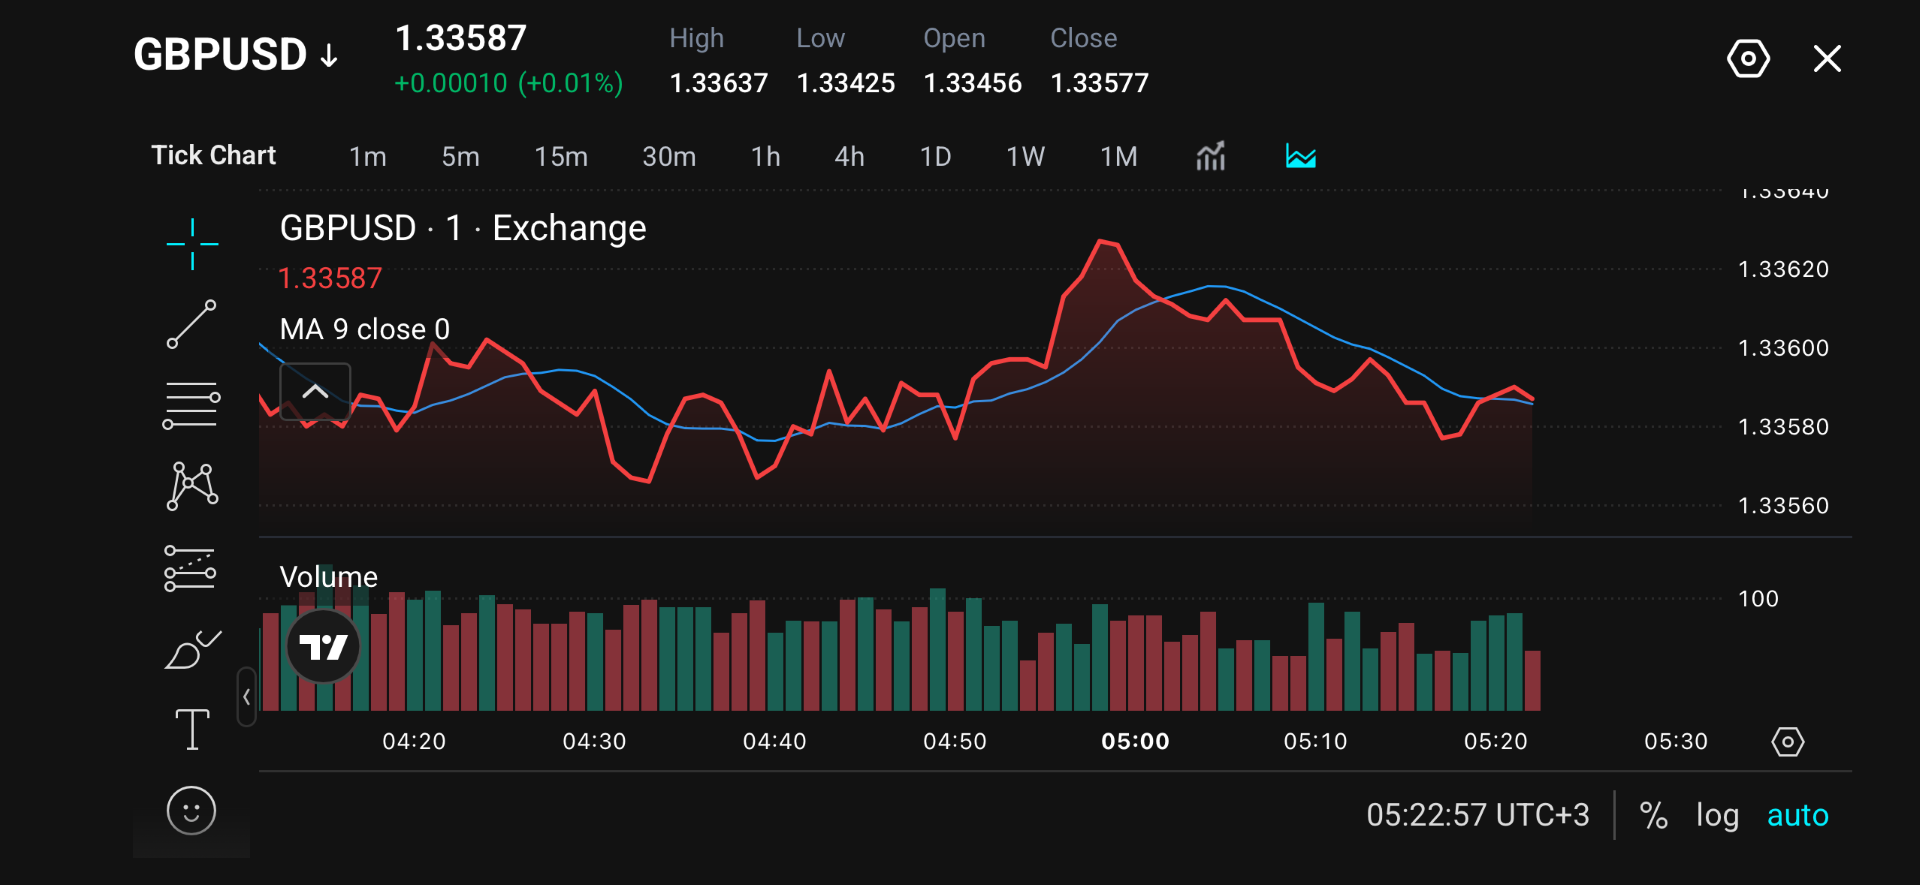
GBP/USD is trading around 1.3358 after recovering slightly from recent losses.
The pair has struggled to maintain momentum above the 1.3360–1.3365 region, where previous rebounds have faced resistance.
A recovery above key resistance levels would be needed to improve the short-term outlook.
Why Traders Are Watching
With the Federal Reserve and Bank of England policy meetings now concluded, traders are shifting focus towards incoming economic data for clues on growth performance and future market direction.
The upcoming UK and US Flash Purchasing Managers Index (PMI) releases will provide signals on business and economic activity, which could influence expectations for future monetary policy decisions.
Stronger UK data may offer support for sterling, while renewed strength in US economic indicators could favour the dollar.
Key Trading Levels
| Level | Price Area | Significance |
| Resistance 1 | 1.3365 | Immediate intraday resistance |
| Resistance 2 | 1.341 | Key recovery level |
| Resistance 3 | 1.3474 | Major resistance zone |
| Support 1 | 1.3345 | Current support area |
| Support 2 | 1.3255 | Next downside target |
| Support 3 | 1.3194 | Key Fibonacci support zone |
GBP/USD is currently testing the 1.3345 support zone, which acts as the immediate decision point for the next move. A successful defence of this level could allow buyers to target 1.3410 and 1.3474.
However, a break below support may confirm renewed selling pressure and expose the pair to 1.3255 and 1.3194.
Bullish and Bearish Setups
| Scenario | Condition | Key Levels | Potential Move |
| Bullish Setup | Buyers defend support and push price above resistance | Hold above 1.3345; break above 1.3365 | Recovery towards 1.3410, followed by 1.3474 if momentum strengthens |
| Bearish Setup | Sellers regain control after support breakdown | Break below 1.3345 | Further downside towards 1.3255, with 1.3194 as the next major support |
For a bullish scenario, GBP/USD could attempt a recovery if buyers defend the 1.3345 support zone and push price back above 1.3365. Momentum indicators would need to confirm improving buying pressure for the rebound to extend.
For a bearish scenario, a break below 1.3345 could signal that sellers remain in control, increasing the risk of a move towards 1.3255. Further weakness below this level may extend the broader September correction.
Disclaimer
The price levels and market scenarios above reflect the author’s assessment at the time of writing. They do not represent financial advice or an official recommendation from VT Markets. Traders should conduct their own analysis and manage risk carefully.
GBP/USD Prediction: What’s Next?
GBP/USD remains at a critical point after its recent decline, with the next direction likely dependent on whether buyers can defend current support levels.
Flash Manufacturing and Services PMI figures are due from both the UK and U.S. on the 23rd, offering crucial clues on economic performance on both the pound and dollar.
If the UK’s PMI report is weak, it suggests a slowing economy, which can lead to a decline in the pound against the US dollar. Conversely, a strong PMI reading indicates a sturdy economy, which could strengthen the pound.
The US PMI data influences the dollar similarly, affecting the GBP/USD exchange rate.
Trade GBP/USD with VT Markets
Trade GBP/USD with competitive spreads, flexible leverage options and advanced trading platforms designed for forex markets.
Access GBP/USD opportunities through MetaTrader 4, MetaTrader 5 and the VT Markets App.
Start a live account with VT Markets today.
FAQ
Why is GBP/USD falling?
GBP/USD has declined after failing to break higher resistance levels, with sellers gaining control during September. The pair is now testing important technical support zones.
What levels should traders watch for GBP/USD?
Key levels include 1.3410 and 1.3474 on the upside, while 1.3345, 1.3255 and 1.3194 are important downside levels.
What could move GBP/USD next?
Upcoming UK and US PMI data may influence expectations for economic growth and affect the relative strength of the British pound and US dollar.
Is GBP/USD bullish or bearish?
GBP/USD is showing short-term bearish pressure while trading below recent resistance levels. A move above key resistance would be needed to improve the near-term outlook.
Start trading now — click here to create your real VT Markets account.








