






Gold is one of the most actively traded assets in global financial markets, but its strong price movements can also bring sharp volatility. Before diving into short-term technical setups, understanding underlying drivers like is gold really an inflation hedge? or reviewing a beginner’s guide to investing in gold can provide essential context for trading XAU/USD.
Instead of chasing gold after a rapid rally or selling after a steep decline, traders can look for pullbacks. These are temporary moves against the dominant trend that may create more structured entry opportunities.
The basic idea is simple: identify the trend, wait for price to retrace, then look for confirmation that the trend is resuming.
Pullbacks can occur across different timeframes, from 5-minute and 15-minute charts to 4-hour and daily charts. A setup can become more compelling when the pullback aligns with the broader market structure, a key support or resistance zone and a clear confirmation signal.
What Is a Gold Pullback?
A gold pullback is a temporary movement against the dominant market direction.
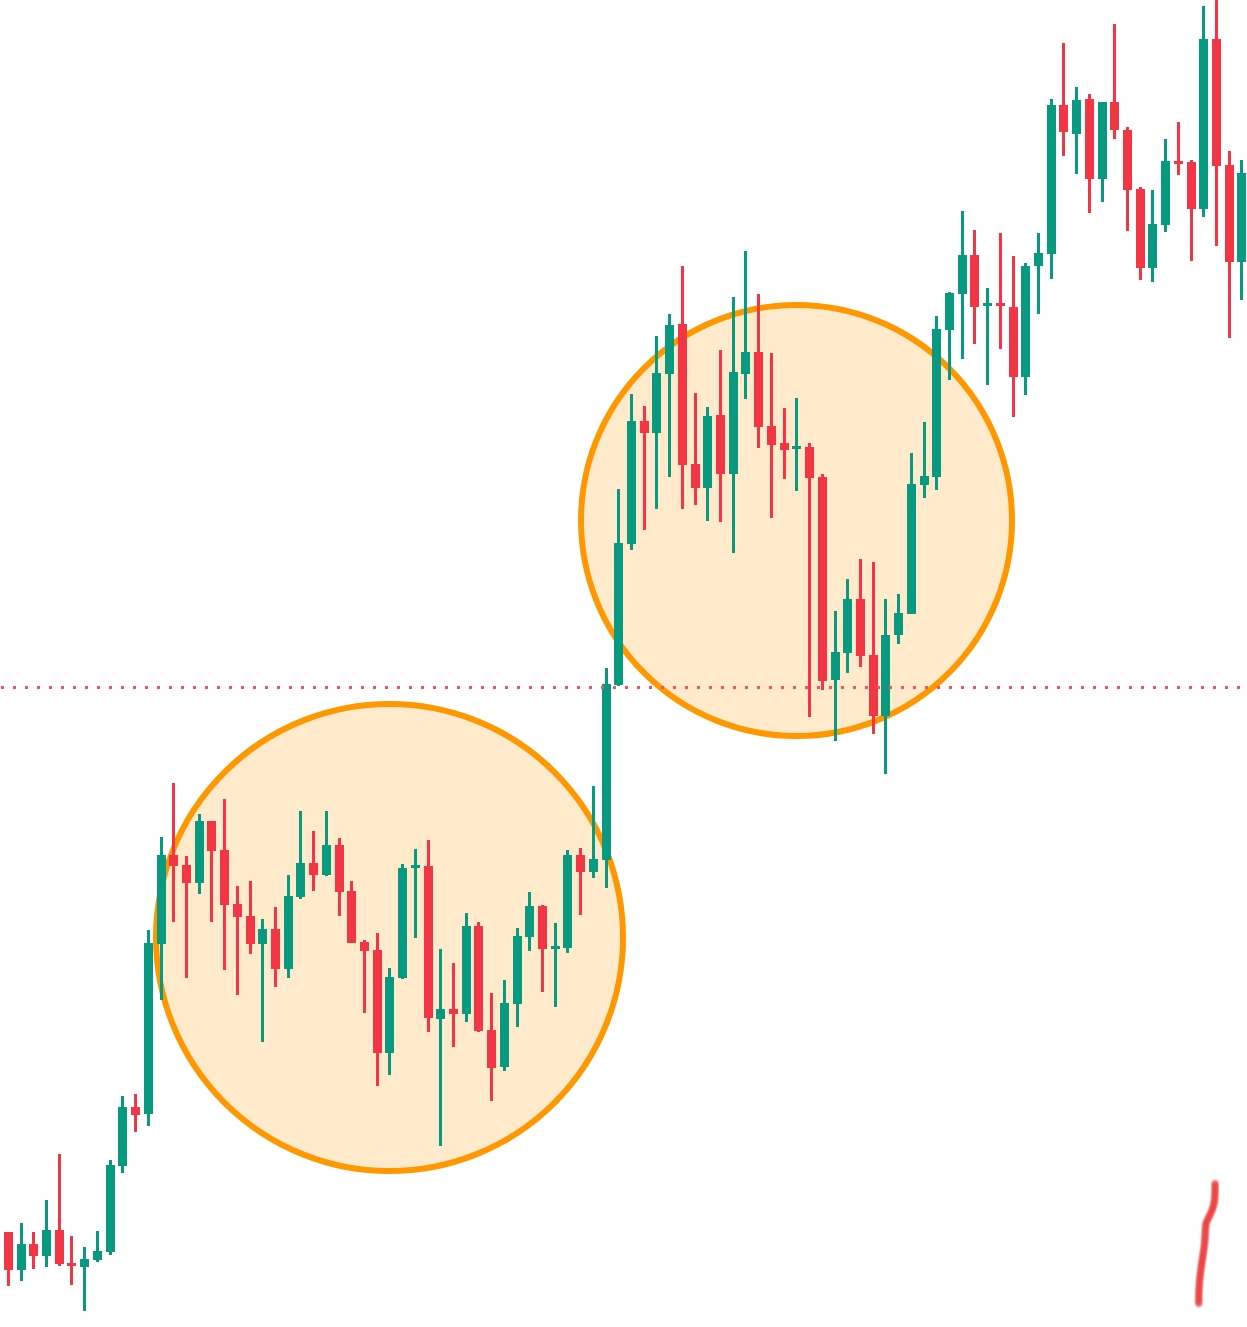
For example, if XAU/USD is in an uptrend and forms higher highs and higher lows, gold may temporarily decline after a strong rally. If price finds support and buyers return, this correction can become a potential buying opportunity.
Because gold pays no yield, sharp spikes in macro variables like interest rates can trigger these sudden pullbacks; see our guide on US Treasury yields and gold for a deeper look at real rates.
A typical bullish pullback looks like:
Uptrend → Temporary decline → Support → Bullish confirmation → Continuation higher
During a downtrend, the opposite can occur:
Downtrend → Temporary rally → Resistance → Bearish confirmation → Continuation lower
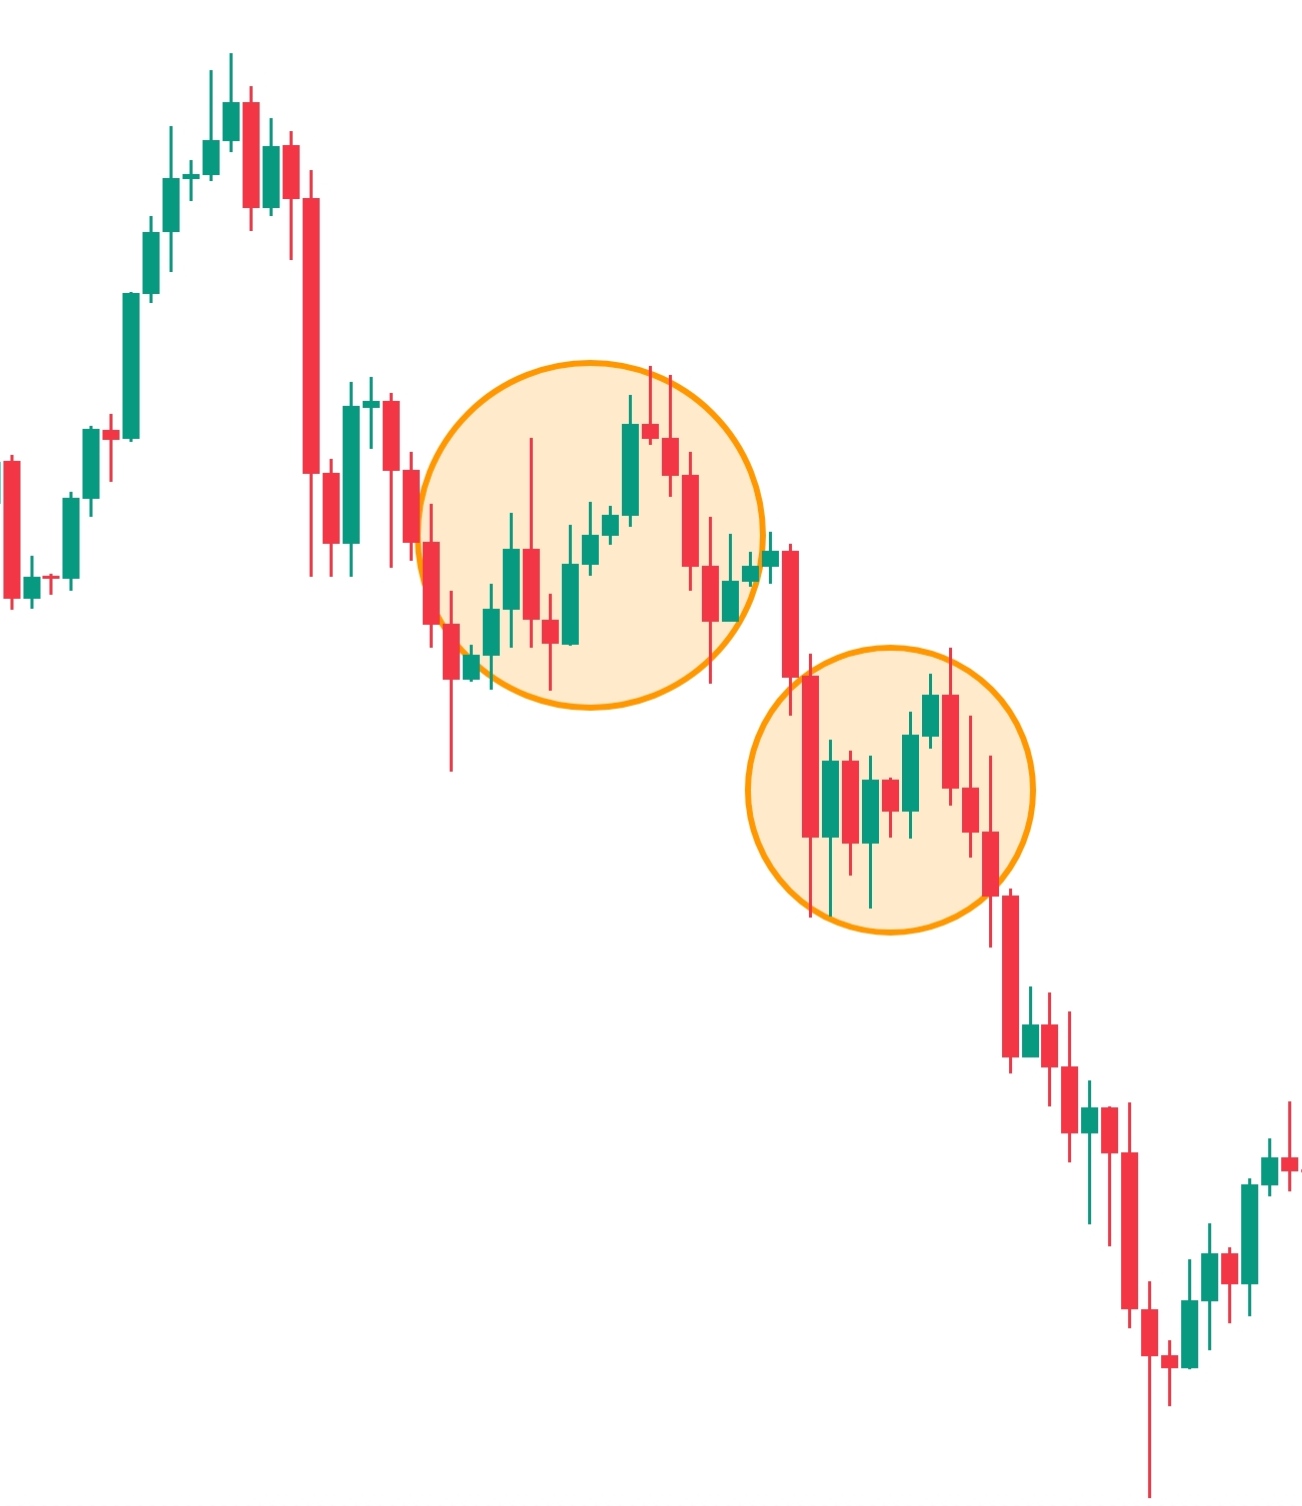
The objective is not to predict the exact top or bottom. Instead, traders wait for price to reach an area where the broader trend may resume.
How to Identify a Pullback
A good pullback setup usually involves several factors rather than relying on a single indicator.
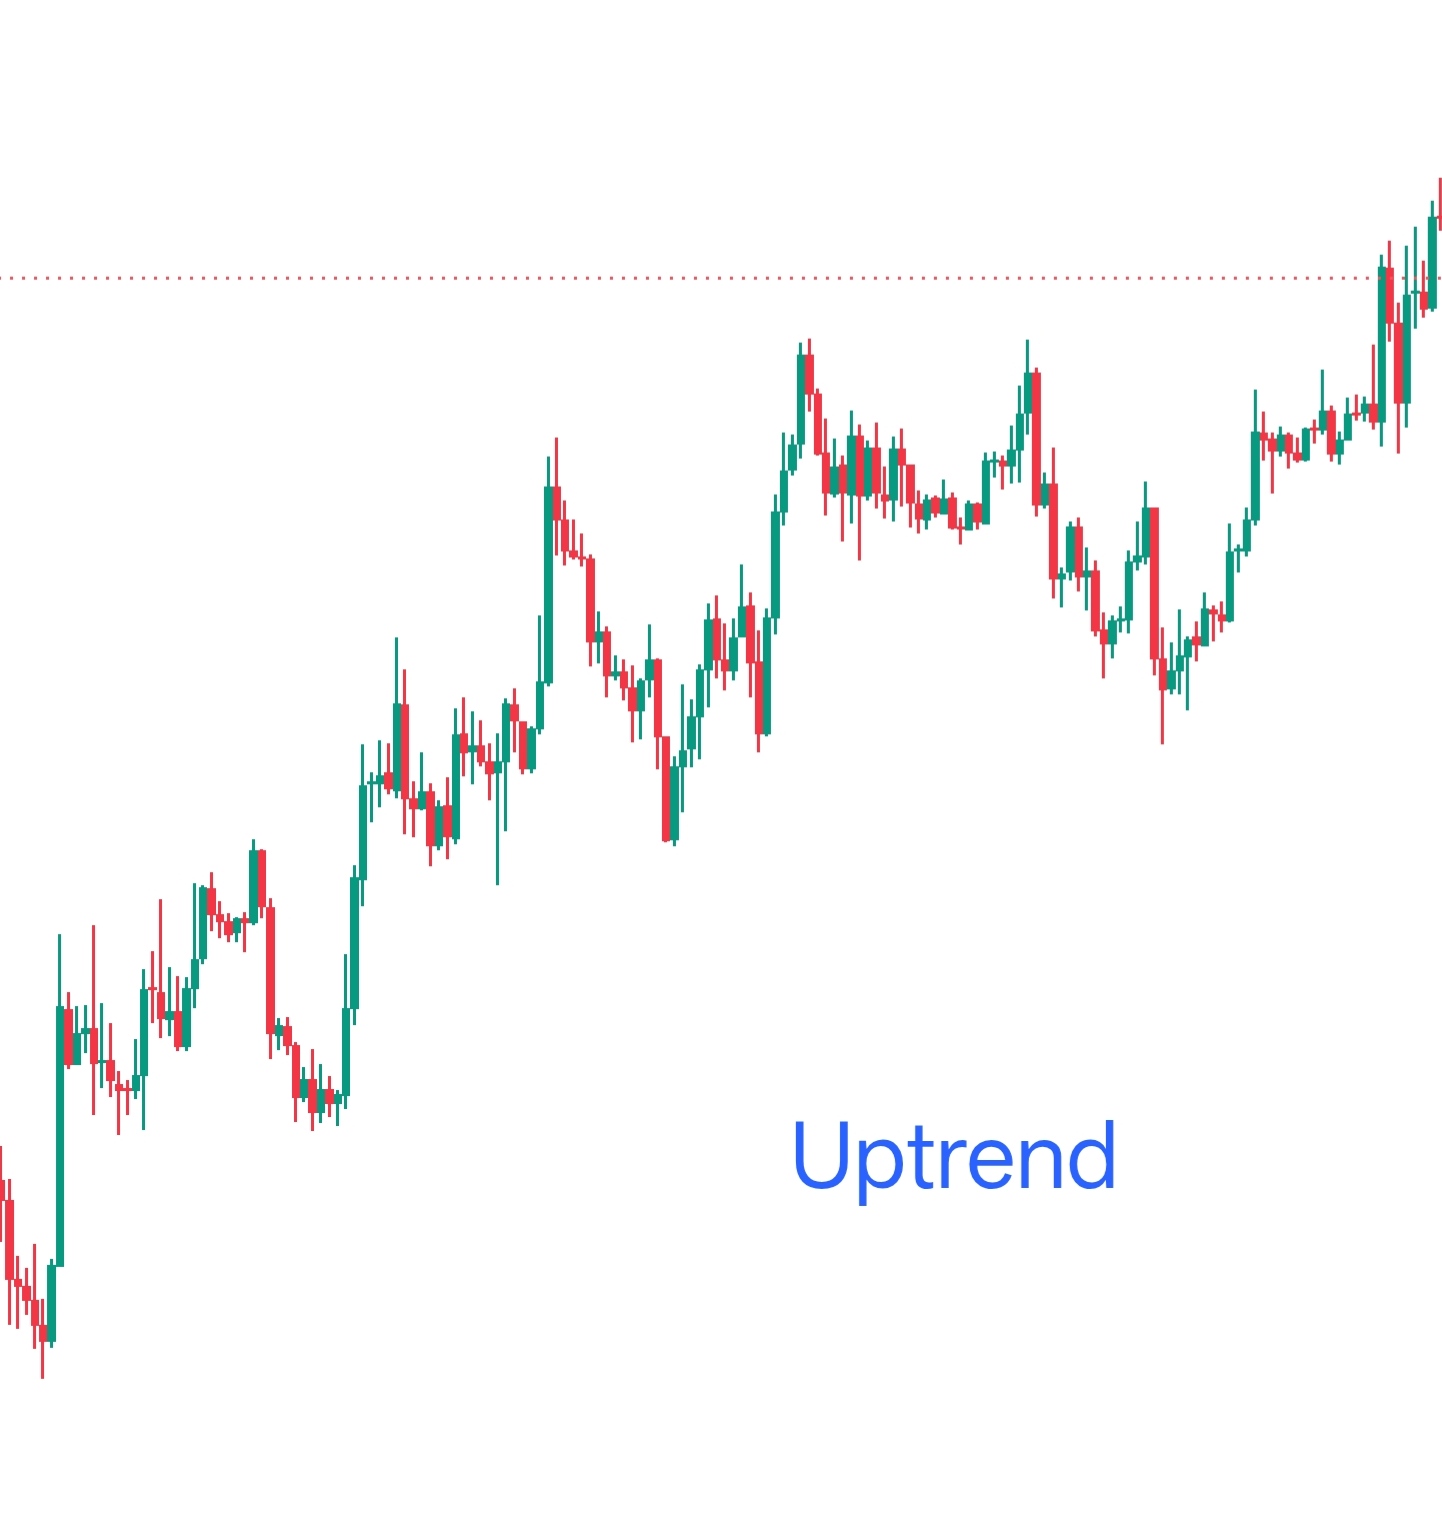
1. Identify the Trend
Start with a higher timeframe to determine the broader market direction. If the higher timeframe is bullish, focus on potential buying opportunities during temporary declines. If it is bearish, focus on potential selling opportunities during temporary rallies. This multi-timeframe approach aligns directly with top-down analysis in trading, allowing traders to establish macro direction before zooming in for entries.
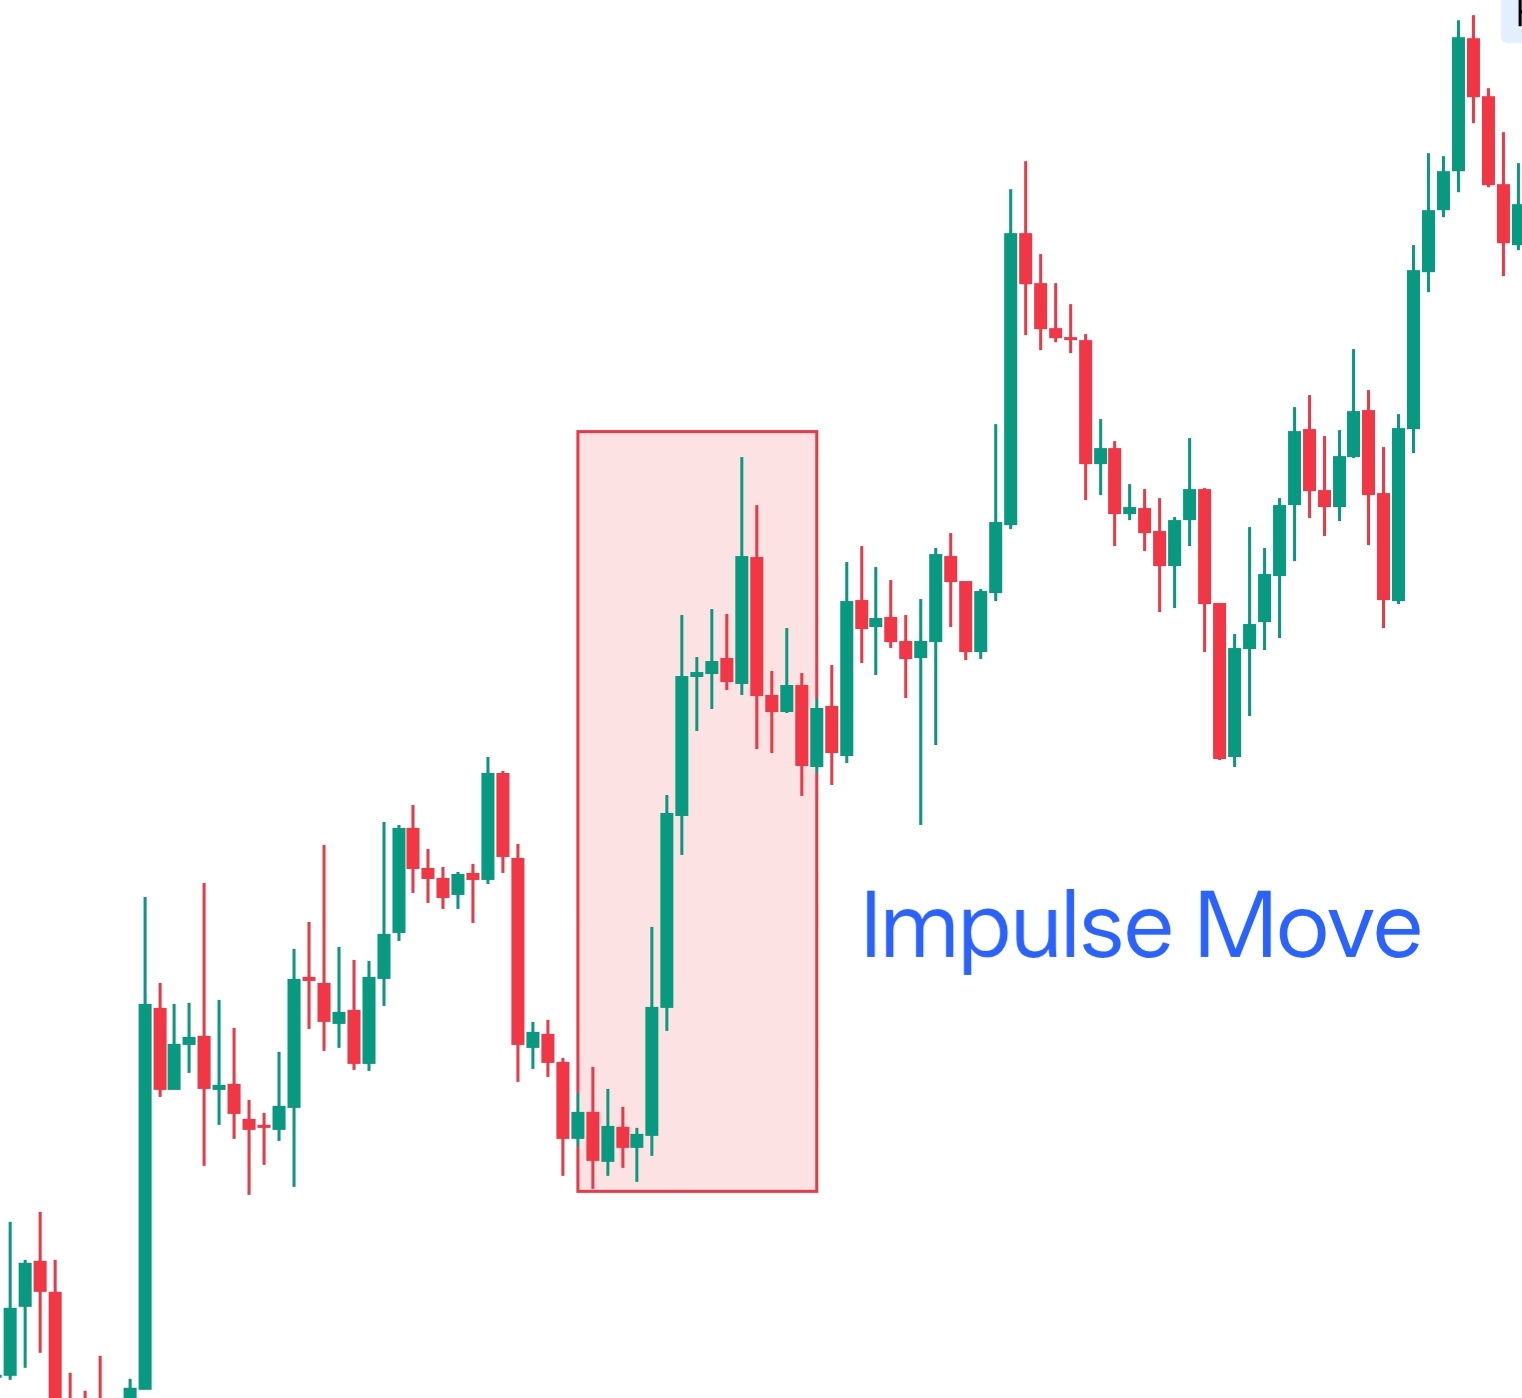
2. Identify the Impulse Move
Pullbacks generally occur after a strong directional move. In an uptrend, the initial rally is the impulse leg, followed by a temporary correction. In a downtrend, the initial decline is followed by a temporary rally. A weak, directionless market may be less suitable because there is no clear trend for prices to resume.
Common Mistakes When Trading Pullbacks
Buying Every Dip
A falling gold price does not automatically mean it is a buying opportunity. Gold can continue falling if the underlying trend has changed. Traders should therefore look for a pullback within a broader bullish structure rather than buying simply because price has dropped.
Trading Against the Higher-Timeframe Trend
A bullish setup on a 5-minute chart can be misleading if the 4-hour chart remains strongly bearish. The lower timeframe may produce a temporary bounce, but the larger trend can quickly overwhelm it. Using the higher timeframe as a directional filter can help reduce these conflicting signals.
Entering Before Confirmation
Another common mistake is entering as soon as gold reaches support or resistance. Price can break through these areas before reversing, potentially triggering a stop-loss. Waiting for signs that buying or selling pressure is weakening can provide a more structured entry. Instead of assuming a level will hold, practice scenario analysis in CFD trading to plan both continuation and invalidation outcomes.
A Simple Gold Pullback Strategy
One practical approach is the Trend + Zone + Confirmation Strategy. It can be applied to XAU/USD or other gold instruments, but should be backtested and adapted to the trader’s preferred market and timeframe.
Step 1: Establish the Trend
Start with the 4-hour chart.
| Bullish Trend | Bearish Trend |
|---|---|
| Higher highs | Lower highs |
| Higher lows | Lower lows |
| Price generally above a rising moving average | Price generally below a falling moving average |
| Strong bullish structure | Strong bearish structure |
Step 2: Find the Pullback
Move to the 1-hour chart and look for the correction.
| Bullish Pullback | Bearish Pullback |
|---|---|
| Impulse move higher | Impulse move lower |
| Correction lower | Correction higher |
| Look for price to approach a support zone | Look for price to approach a resistance zone |
Step 3: Identify the Pullback Zone
Look for confluence between multiple technical factors.
| Bullish Setup | Bearish Setup |
| Previous resistance turned support | Previous support turned resistance |
| 38.2%–61.8% Fibonacci retracement | Fibonacci retracement |
| Moving average support | Moving average resistance |
| Previous swing low | Previous swing high |
| Trendline support | Trendline resistance |
Fibonacci retracement levels can be used alongside moving averages, trendlines and previous price zones when assessing gold pullbacks.
Step 4: Wait for Confirmation
Move to the 15-minute chart and wait for price action to confirm the setup.
| Bullish Confirmation | Bearish Confirmation |
| Gold reaches support | Gold reaches resistance |
| Selling pressure weakens | Buying pressure weakens |
| Bullish rejection or reversal candle appears | Bearish rejection candle appears |
| Price breaks the minor swing high | Price breaks the minor swing low |
| Enter long | Enter short |
This creates a simple three-layer process:
Higher-Timeframe Trend → Pullback Zone → Lower-Timeframe Confirmation
Bullish Gold Pullback Example
Imagine gold is in a clear 4-hour uptrend and rallies from $4,400 to $4,500. Instead of buying at $4,500, the trader waits.
Gold retraces towards $4,460, where previous resistance, a moving average, and a Fibonacci retracement zone overlap. Price then forms a bullish rejection candle and breaks the previous 15-minute swing high. Learning how to identify swing highs and swing lows is essential for determining structural breakouts like this.
The trader enters after confirmation, with the stop-loss placed below the structural level that would invalidate the trade idea. The target can be positioned near the previous high or another logical resistance area. The key is that the trader is not trying to predict the exact bottom; they are waiting for evidence that the pullback may be ending.
Risk Management
Even a strong pullback setup requires disciplined risk management. A common approach is to risk around 0.5% to 1% of trading capital per trade, depending on your strategy and risk tolerance. Learn how to find your risk profile for CFD trading styles before sizing your trades.
Use a structural stop-loss where the trade idea becomes invalid, such as below support or the pullback low for bullish setups, or above resistance or the pullback high for bearish setups. If the stop needs to be wider, reduce your position size rather than increasing your risk.
Final Thoughts
Trading gold pullbacks comes down to Trend + Location + Confirmation + Risk Management. Instead of chasing rallies or selling sharp declines, traders can wait for prices to retrace and look for confirmation that the trend is resuming.
No setup guarantees a profitable trade, and gold can move quickly when market conditions change. Watching factors such as DXY and 10-year Treasury yields can provide additional context.
The goal is not to predict every turning point, but to wait for a favourable, risk-defined opportunity.
FAQs
What is a gold pullback?
A gold pullback is a temporary price movement against the dominant market direction. For example, in an uptrend, there is a brief decline before the price resumes moving higher.
Why should traders wait for a pullback instead of chasing the market?
Chasing a market after a sharp rally or decline can lead to poor entry prices. Waiting for a pullback allows traders to find more structured entry opportunities with defined risk-to-reward parameters.
What is the “Trend + Zone + Confirmation” strategy?
It is a simple multi-timeframe approach where a trader first identifies the primary market direction on a higher timeframe, such as a 4-hour chart. Next, the trader finds a zone on an intermediate timeframe, like a 1-hour chart, where key technical factors overlap. Finally, the trader waits for lower-timeframe price action confirmation, such as on a 15-minute chart, showing that the main trend is resuming before entering the trade.
What are common mistakes to avoid when trading pullbacks?
Traders often fall into the trap of buying every price dip, even though dropping prices do not guarantee a good entry if the overall trend has reversed. Another common error is taking short-term trades against the higher timeframe trend, which frequently leads to failed setups. Lastly, entering a position too early without waiting for price confirmation increases the risk of getting stopped out prematurely.
How should stop-losses be placed when trading pullbacks?
Stop-losses should be placed at a structural level where the trade setup becomes invalid, such as below the pullback low for a buy trade or above the pullback high for a sell trade. Traders should adjust their position sizes to maintain consistent risk management, typically risking around 0.5% to 1% of their total trading capital per trade.
Start trading now — click here to create your real VT Markets account.








