





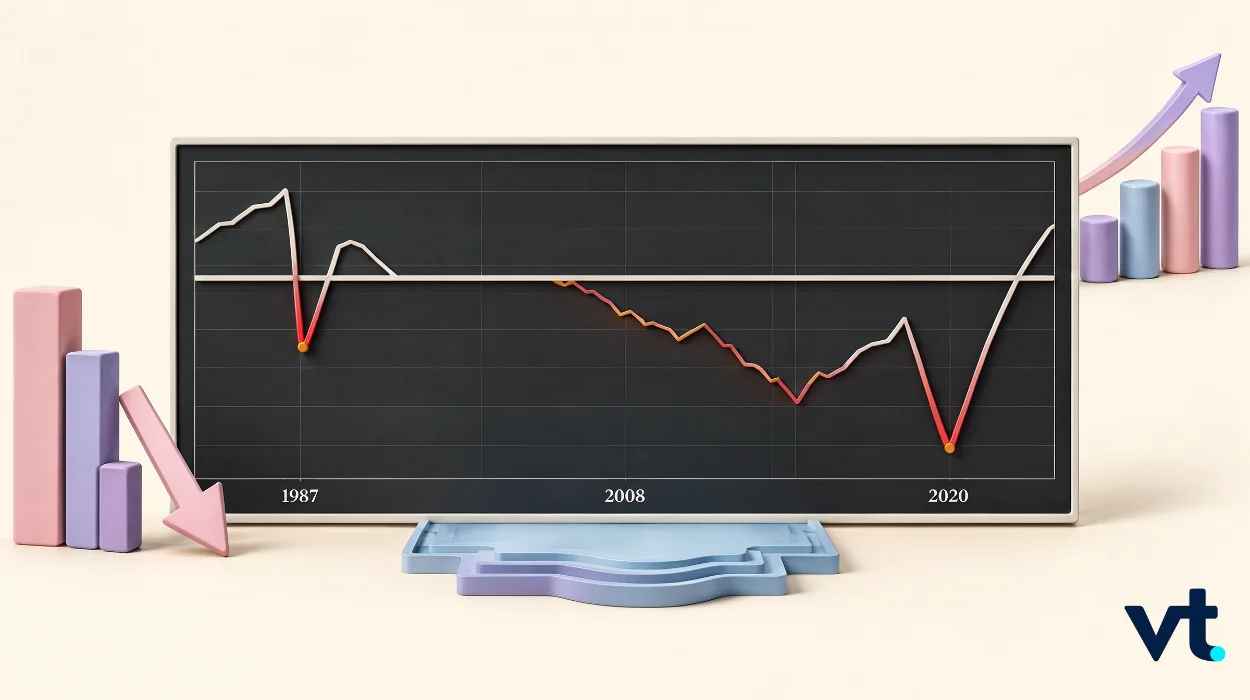
Market crashes do not follow a fixed pattern.
Some are defined by the speed of the initial sell-off. Others develop into prolonged bear markets as financial or economic stress spreads. The recovery can be just as varied: some markets regain their losses within months, while others take years or even decades.
The history of market crashes shows this range clearly. The 1929 crash developed into the Great Depression and one of the deepest market declines in modern history. The 1987 crash produced an extraordinary one-day fall without a subsequent US recession. The 2000 dot-com collapse became a prolonged technology-led bear market. The 2008 financial crisis connected a falling stock market with severe financial and economic stress, while the 2020 crash brought an exceptionally rapid decline followed by a rapid recovery.
These episodes are not directly comparable in every respect. Their causes, economic conditions and market structures were different. However, they provide a useful lens into how different a market downturn can look depending on its speed, depth, cause and aftermath.
Major stock market crashes in history
The term “crash” is often used broadly, but not every major market decline has the same characteristics. Some are defined by a single-day collapse. Others are prolonged bear markets.
The following episodes provide useful comparisons:
| Episode | Market | Peak-to-trough fall | Time to regain previous high |
| 1929–1932 | Dow Jones Industrial Average | 89% | 25 years |
| 1987 | Dow Jones Industrial Average | 22.6% in one session | Less than two years |
| 2000–2002 | Nasdaq Composite | 77.90% | About 15 years |
| 2007–2009 | S&P 500 | 56.80% | About 5½ years |
| 2020 | S&P 500 | 33.90% | About six months |
The figures are based on closing levels unless stated otherwise. They are price indices and do not include dividends, so the recovery period for an investor who reinvested dividends would have been shorter.
The comparison highlights a wide range of outcomes. The 1987 crash was one of the sharpest single-day falls but recovered relatively quickly. The 1929 decline was both deep and prolonged. The 2000-2002 dot-com stretched across more than two years, while the 2020 decline lasted only a few weeks.
Market crashes can look very different depending on how quickly prices fall, how deep the decline becomes and how long the recovery takes. The following episodes illustrate that range.
1929: decline to depression
The 1929 stock market crash marked the beginning of one of the most severe economic downturns in US history.
The Dow Jones Industrial Average peaked in September 1929 before falling sharply. The decline continued well beyond the initial crash, with the Dow eventually reaching its low in July 1932. From peak to trough, the Dow lost about 89%. It did not return to its previous high until November 1954.
The market decline was accompanied by a severe contraction in economic activity. The National Bureau of Economic Research (NBER) dates the Great Depression recession from August 1929 to March 1933, a 43-month contraction.
The initial sell-off was only the beginning of the broader downturn, developing into a much longer period of economic and financial stress.
Deep market decline → prolonged economic contraction → exceptionally long recovery1987: sharp fall without a recession
On 19 October 1987, the Dow Jones Industrial Average fell 22.6% in a single session, or 508 points. It remains the largest one-day percentage decline in the Dow’s history.
The sell-off followed a strong rise in US equities earlier that year. Concerns about the US trade deficit, the dollar and developments in overseas markets added to pressure on prices. Portfolio insurance strategies also contributed to the selling as prices fell.
The decline was severe, but its economic consequences were different from those of the 20s Great Depression.
The US did not enter a recession or banking crisis after the crash. The Dow recovered 57% of its Black Monday loss within two trading sessions and moved back above its pre-crash level in less than two years.
The 1987 episode shows why the size of a market fall does not determine its duration. A very sharp decline can remain a relatively contained market event rather than develop into a prolonged economic downturn.
2000–2002 dot-com crash
The late 1990s brought a sharp rise in technology and internet stocks as investors placed increasingly high expectations on the growth of the new digital economy.
The Nasdaq Composite reached its peak in March 2000. The subsequent decline lasted more than two years, with the index falling approximately 77.9% from its peak to its 2002 low.
Unlike 1987, the defining feature was not a single day of extreme selling. The market remained under pressure as investors reassessed technology valuations and the earnings prospects of companies associated with the dot-com boom.
The Nasdaq did not return to its previous closing high until 2015.
The episode illustrates how a market decline can become a prolonged bear market even without the sudden, one-day collapse associated with a traditional crash.
2008: a spread into economic crisis
The 2008 crisis developed much more slowly and became deeply connected to the wider financial system.
US house prices had more than doubled between 1998 and 2006 as mortgage borrowing expanded. House prices then began to fall, putting pressure on borrowers, lenders and financial institutions.
The S&P 500 reached its closing high of 1,565.15 on 9 October 2007. It fell to 676.53 on 9 March 2009, a decline of 56.8%.
The wider economy deteriorated alongside the market. The NBER dates the Great Recession from December 2007 to June 2009, an 18-month contraction. US unemployment rose from 4.7% in November 2007 to 10.0% in October 2009.
Key events from 2007–2009
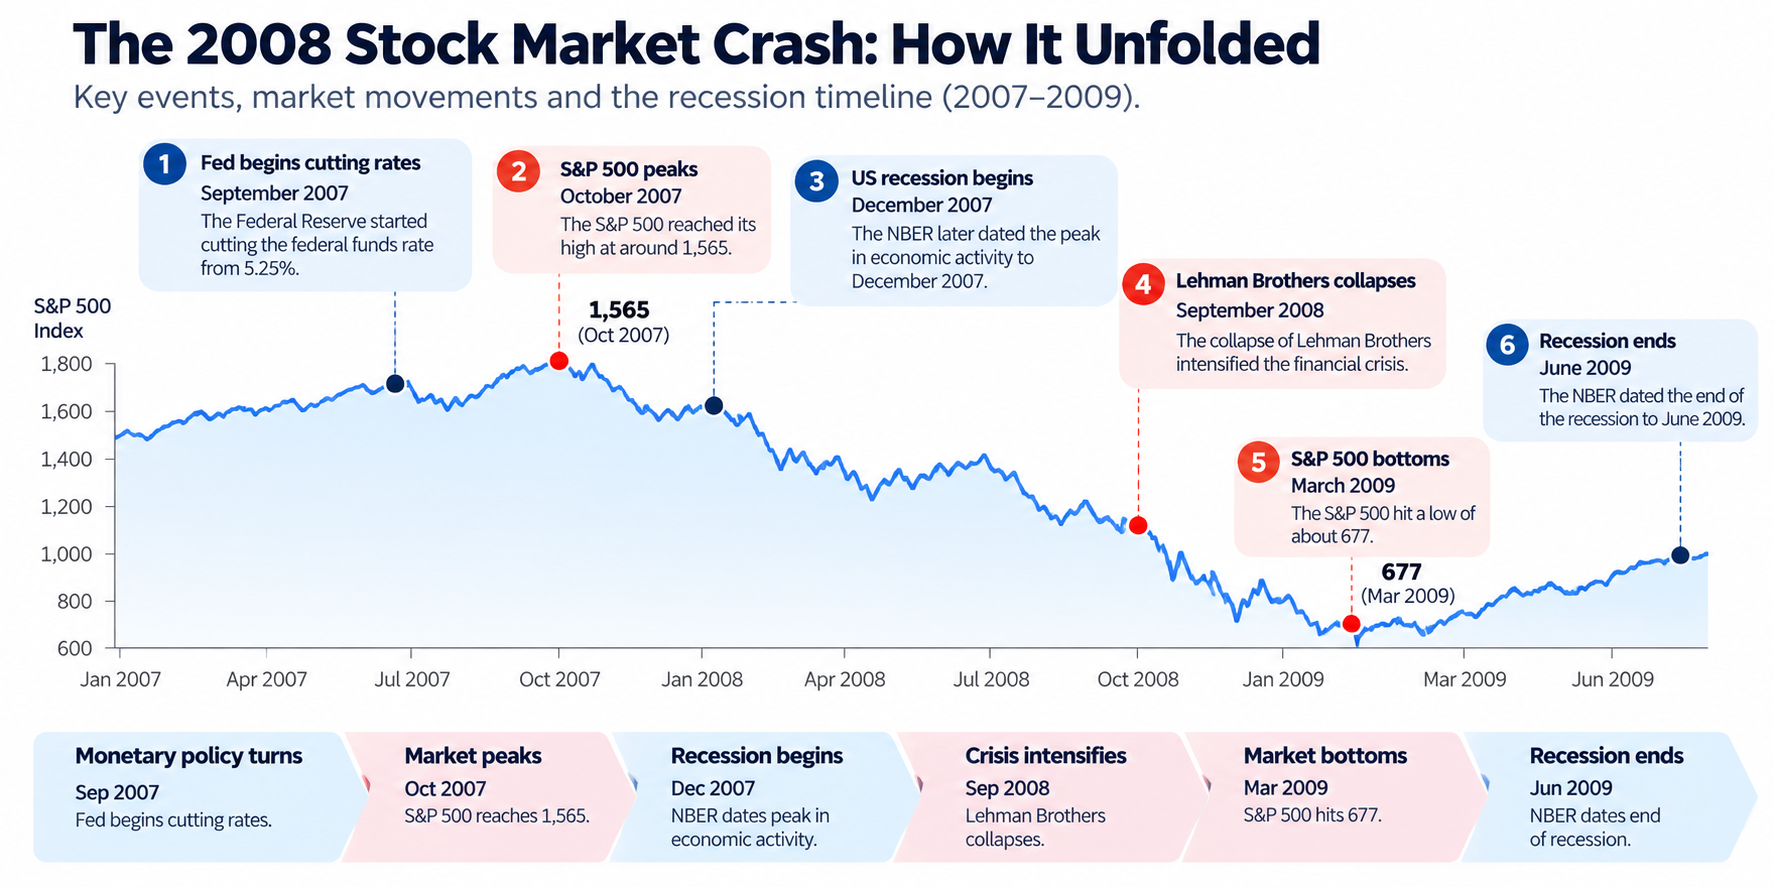
The sequence is important.
The market turned before the recession began and reached its low before the recession ended. Unemployment peaked four months after the recession had officially ended.
This makes the 2008 crisis particularly useful for understanding the relationship between market prices and economic indicators. They do not necessarily turn at the same time. The crisis also shows how a market decline can become part of a wider financial crisis when problems spread through banks, credit markets and the broader economy.
2020: rapid fall and rapid recovery
The 2020 crash moved at a very different pace.
The S&P 500 closed at 3,386.15 on 19 February 2020 and fell to 2,237.40 on 23 March, a decline of 33.9% in 23 trading sessions.
Daily moves were unusually large. The index fell 9.51% on 12 March, gained 9.29% the following day and fell another 11.98% on 16 March. US stock markets also triggered market-wide circuit breakers on four occasions during March.
The recovery was much faster than the decline. The S&P 500 closed above its February high on 18 August 2020, around five months after the March low.
The economic downturn was also unusually short. The NBER dates the COVID-19 recession from February to April 2020, a two-month contraction. Unemployment nevertheless rose from 3.5% in February to 14.8% in April.
By August 2021, the index had doubled from its March 2020 low.
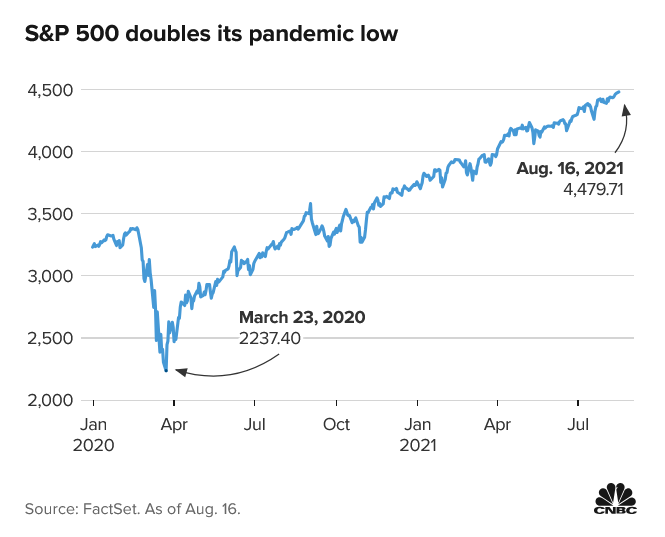
The 2020 episode shows how a severe market decline can be compressed into a short period, with both the sell-off and recovery occurring much faster than in longer bear markets.
Together, these episodes provide useful context for understanding stock market crashes in history, bear-market duration, market recovery and the relationship between financial markets and the wider economy.
How long do bear markets last?
There is no fixed duration for a bear market.
A market crash generally describes a sharp and rapid fall. A bear market refers to a sustained decline in prices. A crash can occur within a bear market, but the terms are not interchangeable.
Historical downturns show why duration is difficult to generalise.
The Great Depression lasted 43 months according to NBER’s recession dates, while the Great Recession lasted 18 months. The COVID-19 recession lasted only two months. The 1987 crash was not followed by a US recession at all.
The market itself can also follow a different timeline from the economy.
Without a fixed period of time, other factors and indicators provide more useful context when assessing a downturn. These include the depth of the decline, the speed of the fall, the causes behind it, and how the market responds afterwards.
A prolonged decline can develop from an asset valuation problem, a financial crisis or a wider economic contraction. A sharp shock can also reverse quickly if financial conditions stabilise and confidence returns.
What past market crashes teach traders
Several patterns stand out across these episodes.
Speed and depth are different
A market can fall 20% in one day or over several months. The percentage decline alone does not describe the trading environment.
The 1987 crash was exceptionally fast. The dot-com decline was much slower but lasted years. The 2020 decline was both severe and unusually compressed.
Market prices can turn before economic data
The 2008 episode shows this clearly. The S&P 500 peaked before the recession began and bottomed before the recession ended. Employment data lagged even further.
Economic indicators provide context, but they do not necessarily mark the same turning points as financial markets.
A crash can become a prolonged bear market
The 1929 and dot-com episodes demonstrate that an initial market shock can develop into a much longer decline. A single dramatic trading session does not necessarily define the full duration of a downturn.
Recovery can take much longer than the initial fall
The S&P 500 recovered its 2020 high within months. The Dow took decades to regain its 1929 peak. The Nasdaq did not close above its 2000 high until 2015.
The size of a crash therefore does not tell you how long its effects will last.
Different assets can behave differently
A market crash does not affect every asset in the same way. The direction and size of a move can depend on liquidity, investor positioning, demand and supply conditions.
Stock indices provide the clearest measure of a market decline, but other markets can tell a different story.
Gold
Gold is often treated as a safe-haven asset, but its historical performance during recessions is mixed.
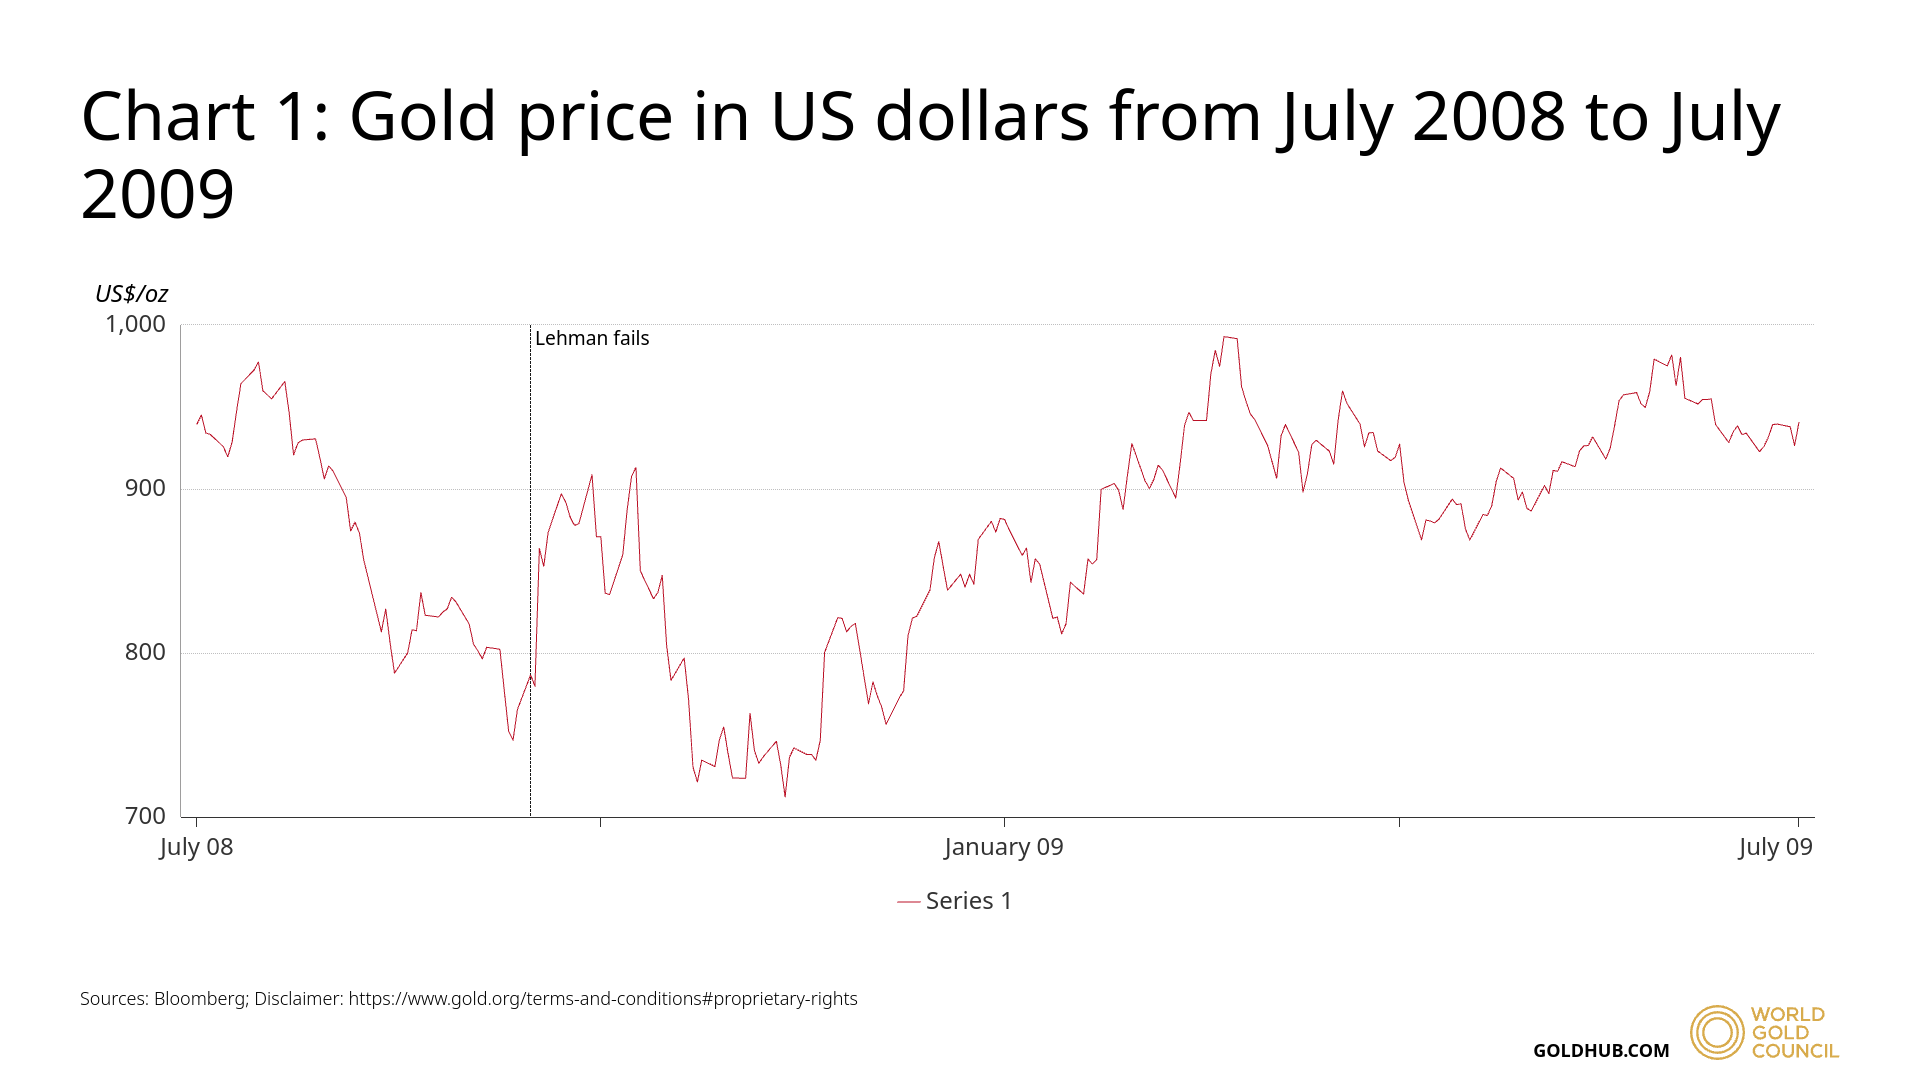
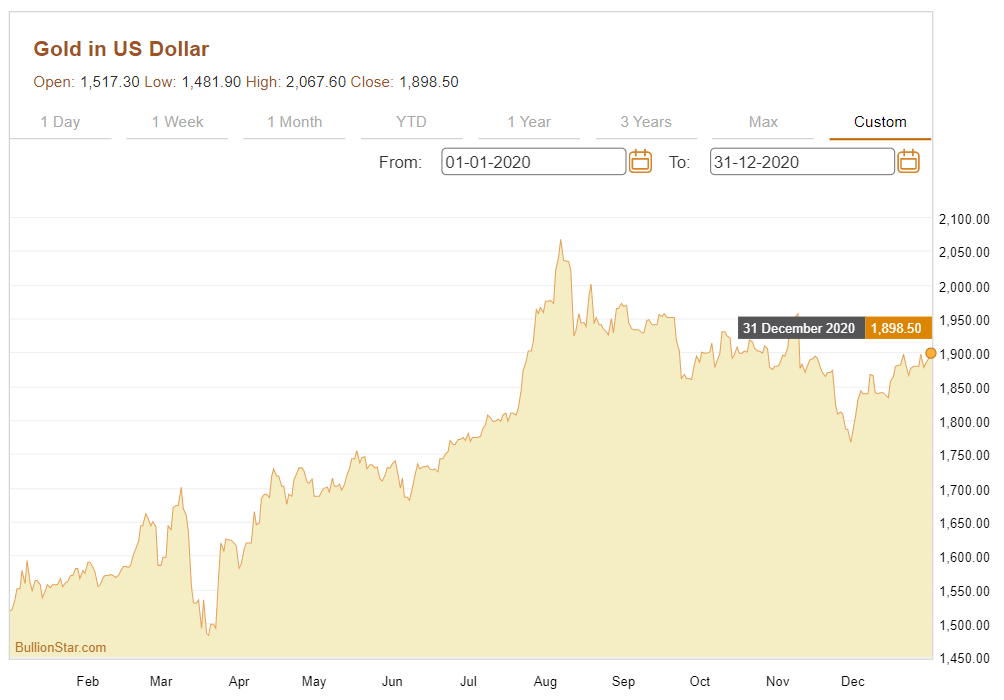
The lesson is straightforward: gold does not necessarily rise at the start of a market crash. During an initial rush for cash, even assets commonly viewed as defensive can fall.
Currencies
Currencies trade in pairs, so a crisis is reflected in relative strength rather than a single direction.
During the 2008 and 2020 downturns, the US dollar, Japanese yen and Swiss franc strengthened in several major currency markets, while currencies linked more closely to global growth and commodities weakened.
The dollar’s move in 2008 was linked to safe-haven demand, the unwinding of carry trades and a shortage of dollar funding, according to research from the Bank for International Settlements. During the early stages of the 2020 crisis, the dollar index also rose sharply.
These episodes show why a currency should not be labelled a permanent “safe haven”. Its behaviour depends on the type of stress affecting the market.
Oil
Oil can react strongly to changes in economic activity because demand for energy is closely linked to global growth.
The 2008 financial crisis provides a clear example. Oil prices had risen sharply before the crisis, reaching a peak in 2008 before falling rapidly as financial conditions deteriorated and economic activity weakened.
A similar pattern appeared during the 2020 COVID-19 shock. Oil prices fell sharply as the pandemic reduced travel, industrial activity and demand for energy.
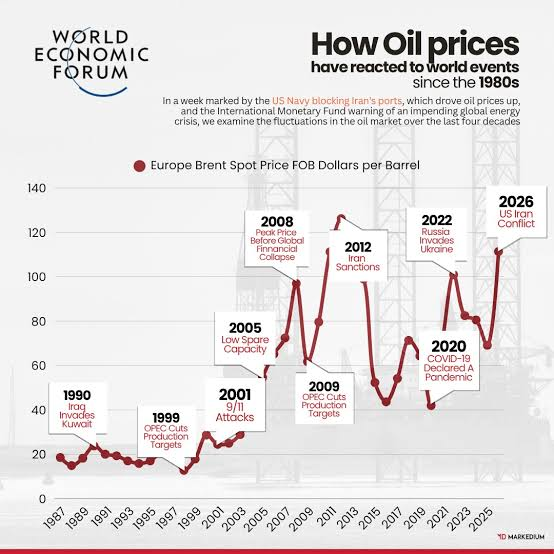
These episodes show how quickly oil can respond when expectations for economic activity change. They also highlight an important difference from equities: oil prices can be driven by both demand and supply conditions, so the same market shock can produce a different response depending on what is happening in the energy market. Find more recent relevance in our ‘Oil Trading Guide 2026‘.
These examples show why a market downturn should not be viewed through equities alone. Gold, currencies and oil can respond differently to the same shock, depending on liquidity, investor positioning, demand and supply conditions.
From past bubbles to today’s AI market
The dot-com boom provides one historical reference point for thinking about today’s AI market. In the late 1990s, expectations around the internet helped drive a major rise in technology stocks before the Nasdaq eventually fell about 77.9% from its 2000 peak to its 2002 low.
The comparison is not that AI is necessarily another dot-com bubble. The more useful question is whether expectations about a transformative technology can become reflected in valuations faster than the underlying economic benefits are realised.
The 2007–2008 housing and financial crisis offers a different historical reference. There, the connection between asset prices, leverage and the wider financial system became critical as falling property prices contributed to stress across borrowers, lenders and financial institutions.
These episodes point to different ways that optimism can become embedded in markets. The dot-com period highlights technology expectations and valuations. The financial crisis highlights leverage, credit and the link between asset prices and the wider economy.
Today’s AI market does not have to follow either path. AI could generate substantial productivity gains and earnings growth, or expectations could prove too optimistic. The historical examples simply provide different frameworks for considering what could happen when market expectations and economic reality diverge.
Instead of asking whether the next downturn will look like 1987, 2000, 2008 or 2020, it can be more useful to consider a few basic characteristics:
- Depth — how far prices fell.
- Speed — how quickly the decline occurred.
- Duration — how long the market remained under pressure.
- Recovery — how long it took to regain previous highs.
These factors can help distinguish between a sudden market shock, a prolonged bear market and a wider economic downturn.
For traders, past market crashes are therefore most useful as historical reference points rather than predictions. They show the range of outcomes that markets have experienced before, while leaving room for the next downturn to develop differently.
Make an account today | Try a Demo | Download VT Markets APP
Start trading now — click here to create your real VT Markets account.



