





The moving average crossover strategy is a trend-following method. It uses two moving averages with different periods to spot potential shifts in market direction. A crossover happens when the faster average moves above or below the slower one. This creates a bullish or bearish signal. Traders use these signals to plan entries or exits. This guide explains how the strategy works. It covers the difference between SMA and EMA. It shows how to pick moving average combinations for different trading styles. It also explains how to set up and backtest the strategy on MT4 and MT5, and how to manage risk through position sizing and stop-losses.
Key Takeaways:
- A moving average crossover strategy generates signals when a faster moving average crosses a slower one, making it one of the most widely used trend-following approaches in technical analysis.
- Moving averages are lagging indicators, so crossover signals confirm a move rather than predict it. Accepting that limitation is the starting point for using the method well.
- The strategy performs best in trending conditions and struggles in ranging markets, where repeated whipsaws can erode an account.
- Results depend far more on position sizing, stop-loss placement and testing than on finding perfect indicator settings.
A moving average crossover strategy looks simple on a chart, and that simplicity is exactly why so many traders misuse it. This guide takes it apart properly. We start with what the strategy is and how the signal forms. Next, we compare the most common moving average combinations and settle the question of which settings suit which style.
Then, we move to practical work, setting it up on MetaTrader 4 or MetaTrader 5, adapting it for fast trading, and testing it before risking capital. The closing sections cover risk control and the errors that cost traders the most.
What Is A Moving Average Crossover Strategy?

You need to understand what the indicator does to your price data and what a crossing line represents, before applying any settings.
How Moving Averages Smooth Price Data
A moving average takes a set number of past closing prices and averages them. Subsequently, it plots that average as a line. As each new candle forms, the oldest price drops out and the newest one enters.
The purpose is noise reduction. Raw price action is jagged, so the average strips out much of that noise and leaves the underlying direction visible.
Two variations dominate:
- Simple moving average (SMA): Weights every price equally. Smoother, slower, less reactive.
- Exponential moving average (EMA): Weights recent prices more heavily. Faster to respond, and faster to produce false turns.
The trade-off never disappears. More smoothing means fewer false signals but later entries.
What Happens When Two Moving Averages Cross
A moving average crossover strategy uses two lines with different periods. The shorter reacts quickly to new data. The longer reacts slowly.
When the fast line crosses above the slow line, recent prices are rising faster than the longer-term average. That is a bullish crossover. When it crosses below, you have a bearish crossover.
Two crossings carry their own names:
- Golden cross: The 50-period average crosses above the 200-period, often read as a longer-term bullish signal.
- Death cross: The 50-period average crosses below the 200-period, often read as bearish.
Pro tip: A crossover confirms, it does not forecast. By the time two averages cross, part of the move has already happened.
Which Moving Average Crossover Is The Best?
Which moving average crossover is the best? There is no universal answer, and any source offering one is overselling. The right combination depends on your timeframe, holding period and tolerance for false signals.
Comparing Popular Moving Average Combinations
The pairings below are illustrative starting points for your own testing, not recommendations.
| MA combination | Type | Typical timeframe | Signal frequency | Generally suited to |
| 5 and 13 | EMA | 1 to 5 minute | Very high | Scalping |
| 9 and 21 | EMA | 15 minute to 1 hour | High | Intraday trading |
| 20 and 50 | EMA or SMA | 1 hour to 4 hour | Moderate | Swing trading |
| 50 and 200 | SMA | Daily | Low | Position trading |
A simple principle sits behind that table. Faster pairs give more signals with a lower proportion of good ones. Slower pairs give fewer, cleaner signals that arrive later. Neither is superior.
SMA Versus EMA In A Moving Average Crossover Strategy
The choice comes down to what you value more:
- Choose EMA for shorter timeframes and earlier entries, accepting more false signals.
- Choose SMA for longer timeframes and cleaner signals, accepting later entries.
- Avoid mixing types arbitrarily. If you use both, know why.
Pro tip: Resist adjusting periods after a losing run. Every change resets your evidence base to zero.
How To Set Up A Moving Average Crossover Strategy On MT4 And MT5
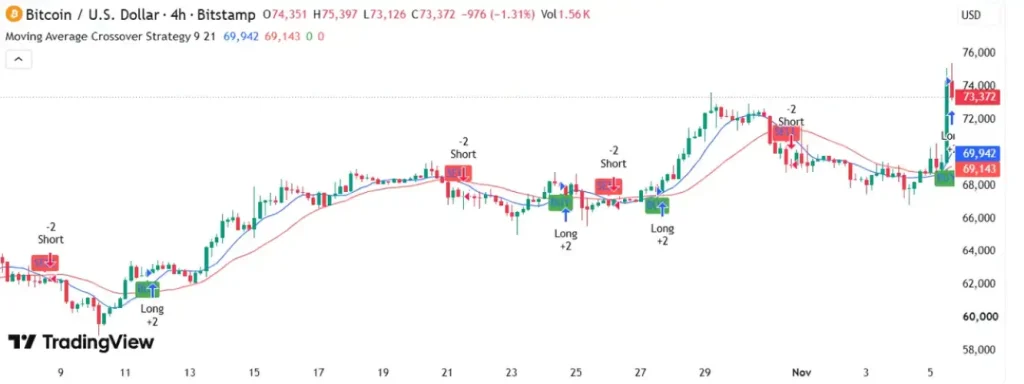
Source: TradingView
Both platforms handle this identically, so the steps apply whichever you use.
Step By Step Platform Setup
- Open your chart: Select your instrument and set your working timeframe.
- Add the fast moving average: Set your chosen period, then pick SMA or EMA.
- Add the slow moving average: Repeat with the longer period.
- Colour them differently: Make the fast line visually obvious.
- Apply to close: Use closing prices for consistency.
- Save as a template: This applies identical settings across instruments in seconds.
- Write your rules down: Entry, exit, stop and target should exist before your first trade.
Entry And Exit Rules With A Simple Example
Vague rules invite improvisation, and improvisation is where discipline breaks down.
Consider this illustrative rule set using a 20 and 50 EMA on a four-hour chart:
- Entry: Go long on the close of the candle where the 20 EMA closes above the 50 EMA.
- Stop-loss: Place below the most recent swing low.
- Take-profit: Target a risk-reward ratio of at least 1:2.
- Exit: Close if the 20 EMA closes back below the 50 EMA.
Now add illustrative numbers. An entry at 1.1000 with a swing low at 1.0950 gives a 50 pip stop. A 1:2 ratio sets the target at 1.1100.
The sequence matters. The chart determines the stop distance. The stop distance determines the position size. Never the other way round.
Using A Moving Average Crossover Strategy For Scalping
Applying the method to very short timeframes changes the calculations considerably, and not in the trader’s favour.
1. Settings And Timeframes For Fast Trading
A moving average crossover strategy for scalping typically uses fast EMA pairs such as 5 and 13 on one or five minute charts. Signals arrive frequently and holding periods are measured in minutes.
Most scalpers apply constraints to make that workable. Trade only during high liquidity sessions such as the London to New York overlap.
Take signals only in the direction of a higher timeframe trend. Avoid the minutes surrounding major economic releases. Set a daily loss limit and stop when it is reached.
2. Costs That Erode Scalping Profits
Transaction costs matter far more at high frequency, and this is where scalping plans quietly fail.
Work through this illustrative example:
- Trade size: 0.1 lots, giving a pip value of roughly $1
- Average spread: 1.0 pip, costing about $1 per round trip
- Trades per day: 20, giving a daily cost of $20
- Cost across 20 trading days: $400
On an illustrative $5,000 account, that cost arrives before a single losing trade is counted. Your edge has to clear it first.
Pro tip: Calculate your expected monthly cost before committing to scalping. If your average winner is smaller than two or three times the spread, the calculations is working against you.
How To Backtest A Moving Average Crossover Strategy
Testing separates an idea from a strategy. It is also the step most traders skip.
What To Measure In Your Backtest
A moving average crossover strategy backtest should record more than a profit figure. A single number hides the behaviour that determines whether you can actually trade the system.
| Metric | What it tells you |
| Win rate | The proportion of trades closing in profit |
| Average win and loss | Whether winners meaningfully outsize losers |
| Maximum drawdown | The largest peak-to-trough fall in account value |
| Expectancy | The average result you can expect per trade |
| Longest losing streak | Whether you could psychologically survive the system |
Expectancy is worth calculating by hand. Using illustrative results:
- Win rate: 40%
- Average win: 60 pips
- Average loss: 30 pips
- Expectancy = (0.40 × 60) − (0.60 × 30) = 24 − 18 = +6 pips per trade
That illustrative system loses more often than it wins and still returns a positive expectancy. This is the core insight of trend-following. You are not trying to be right often. You are trying to be right big and wrong small.
Common Backtesting Errors To Avoid
A flawed test is worse than no test, because it creates false confidence:
- Too small a sample: Thirty trades tell you little. Aim for a few hundred.
- One market condition only: Include trending, ranging and volatile periods.
- Ignoring costs: Exclude spread and swap and the results will not survive live trading.
- Curve fitting: Tweaking settings until history looks perfect produces a system tuned to the past.
- Hindsight entries: Use the MT4 or MT5 strategy tester rather than marking a completed chart.
Risk Management For A Moving Average Crossover Strategy
Signals get you into the market. Risk control decides how long you stay in it.
1. Position Sizing And Stop Placement
Size every position from your stop distance, not your conviction. Using an illustrative $10,000 account and a 1% risk rule on a major pair:
- Maximum risk per trade: $100
- Stop distance from the chart: 50 pips
- Pip value per standard lot: approximately $10
- Risk per standard lot: 50 × $10 = $500
- Position size: $100 ÷ $500 = 0.2 lots
Run that calculation before every entry. It takes seconds and removes the most common cause of account damage. Remember too that leverage amplifies both directions. The leverage available to you is a ceiling, not a target.
2. Filtering Out False Signals And Whipsaws
In sideways markets, price can cross the averages repeatedly, producing a run of small losses. Several filters help:
- Higher timeframe alignment: Take signals only when they match the longer timeframe direction.
- Confirmation candle: Wait for a close beyond the crossover before entering.
- Momentum filter: Use Relative Strength Index (RSI) or Moving Average Convergence Divergence (MACD) as a secondary check, not a second signal.
- Volatility check: Skip signals when Average True Range (ATR) shows unusually compressed conditions.
- Fewer instruments: Deep familiarity with two or three markets beats shallow coverage of ten.
Pro tip: Add one filter at a time and retest after each. Stacking four at once makes it impossible to know which one helped.
Common Mistakes To Avoid
Most losses come from repeatable behaviour rather than bad indicators:
- Trading every crossover: Signals in a ranging market are noise, not opportunity.
- Widening the stop: This converts a planned small loss into an unplanned large one.
- Over-optimising settings: Perfect historical performance rarely survives live markets.
- Skipping the journal: Without records, the same mistake repeats unnoticed.
- Expecting prediction: The strategy confirms trends. That is the whole design.
- Adding indicators after losses: Complexity is usually a response to discomfort.
A moving average crossover confirms a trend change only after it’s already happened . In other words, this means by the time you see it, some of the moves are gone. However, momentum divergence catches that same shift while it’s still forming, often days before the crossover ever fires.
Frequently Asked Questions
Q1: Is a moving average crossover strategy profitable?
It can be, though profitability depends on execution rather than the signal. Trend-following systems often win less than half their trades while remaining positive overall. This is because winners are allowed to run further than losers. Costs, position sizing and discipline matter more than indicator settings.
Q2: Is a moving average crossover strategy good for beginners?
Yes, it is one of the more accessible starting points. The rules are visual and objective, which removes much of the guesswork that troubles new traders. Beginners should still start on a demo account, keep position sizes small, and use a stop-loss on every trade.
Q3: Which timeframe works best for a moving average crossover strategy?
Higher timeframes such as the four-hour and daily generally produce fewer but cleaner signals, since there is less noise to distort the averages. Lower timeframes produce more signals and more false ones. Match the timeframe to how long you can realistically monitor a position.
Q4: Can a moving average crossover strategy be automated?
Yes. The rules are objective, which suits an expert advisor on MetaTrader 4 or MetaTrader 5. VT Markets supports both platforms. Automation removes emotional interference from execution. However, it does not remove the need for periodic testing as conditions change.
Start Building Your Moving Average Crossover Strategy With VT Markets
With the moving average crossover strategy, understand what the signal confirms rather than forecasts. Choose settings that match your timeframe instead of chasing a perfect combination. Test before risking capital, size every position from your stop.
Accept that a run of small losses is a feature of trend-following, not evidence that something is broken.
With VT Markets, you can build and test your moving average crossover strategy on MetaTrader 4 and MetaTrader 5, with the charting tools, order types and risk controls needed to trade it properly.
Create a live VT Markets account today to access our platform features, including market insights and educational content.








