


Key Takeaways:
- The equity curve indicates a provider’s account balance over time, search for stready, incremental growth.
- Maximum Drawdown (MDD) under 20% is manageable; over 50% is a critical red flag.
- Win rate itself is misleading. Continuously weigh it against the risk/reward ratio.
- Transparent, rule-based strategies from providers are a green flag; Martingale approaches are not.
- Always calculate your net return after all fees, not the provider’s gross figures.
- Past performance does not guarantee similar outcomes for copiers because of execution timing and account size differences.
Copy trading is one of the fastest-growing methods to enter financial markets, and there are simple reasons for this. For starters, you don’t need to spend years mastering charts and strategies. Instead, you only follow a skilled trader and let their trades automatically mirror in your account.
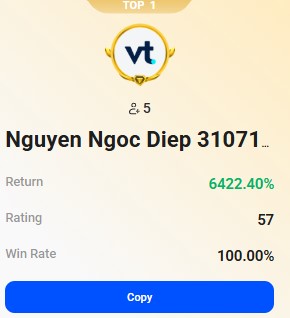
However, here is the part many beginners miss: choosing the right copy trading providers is not as simple as picking whoever sits at the top of the leaderboard.
If you are exploring VT Markets copy trading and want to find genuinely profitable providers (not just temporarily lucky), this guide is for you. Whether you are new to copy trading for beginners or already have some experience, understanding how to read performance data properly is the single most important skill you can develop.
In this article, we will analyse every key metric, what it really means, and how to use it to protect your capital and grow your account with confidence.
Key Metrics to Evaluate Copy Trading Providers
| Metric | What It Shows |
| Equity curve | Consistency of performance |
| Drawdown | Risk exposure |
| Win rate | Frequency of winning trades |
| Risk/reward | Profit potential per trade |
| Trade history | Strategy discipline |
The Equity Curve: Your First Look at a Provider on VT Markets Copy Trading
The equity curve is a line chart plotting a trader’s account balance over time. Think of it as a health report for the provider’s strategy. It tells you, at a glance, whether the growth has been earned or manufactured.
Here is what each pattern typically signals:
| Equity Curve Pattern | What It Means | Action |
| Smooth, gradual upward slope | Consistent, controlled growth with manageable risk | Green flag: Worth investigating further |
| Sharp spikes followed by drops | High-risk, erratic behaviour; possibly over-leveraged | Caution: Check the drawdown carefully |
| Long flat line, then sudden jump | The strategy may have stopped working or has been restarted | Red flag: Ask why |
| Steady line, brief dips, then recovery | Normal drawdown periods with disciplined recovery | Green flag: Shows resilience |
Pro Tip: Filter by providers with at least 3, 6, and 12 months of equity curve history. Shorter track records, say three months or less, are far too easy to fabricate with one lucky streak.
Maximum Drawdown (MDD): How Much Has the Provider Actually Lost?
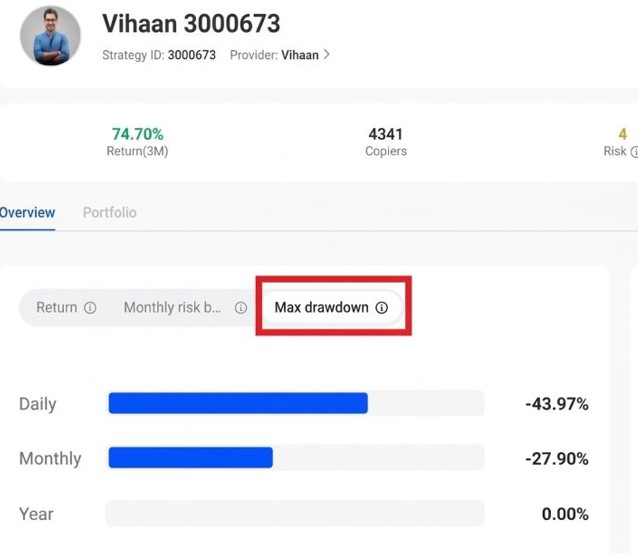
Maximum Drawdown, commonly referred to as MDD, measures the largest fall from a peak to a trough before a new high is reached. It is one of the most apparent numbers in a provider’s profile because it reflects the actual results.
Simple example: A provider’s account grows to USD 100, then falls to USD 60 before recovering. MDD is 40%.
As a general rule of thumb:
- Below 20% MDD: Generally manageable for most copiers.
- 20%–35% MDD: Moderate risk, so assess whether the strategy justifies it.
- Above 50% MDD: Serious red flag. The trader has, at some point, lost more than half their account. One repeat of that event could wipe out yours.
Any provider consistently running above 50% is operating at a level far beyond what most institutional risk managers would accept.
Pro Tip: MDD and the equity curve tell the same story from different angles. Use them together, not in isolation.
Win Rate vs. Risk/Reward Ratio: The Most Misunderstood Metrics
A high win rate is one of the most appealing statistics in copy trading. However, win rate alone can be a misleading statistic if other vital metrics are ignored.
Here is a robust illustration:
| Scenario | Win Rate | Risk/Reward Ratio | Net Result After 10 Trades |
| Provider A (Sustainable) | 60% | 3:1 (risk USD10, target USD30) | 6 wins × USD30 = USD180; 4 losses × USD10 = USD40; Net: USD140 |
| Provider B (Dangerous) | 90% | 1:10 (risk USD100, target USD10) | 9 wins × USD10 = USD90; 1 loss × USD100 = USD100; Net: – USD10 |
Provider B wins 90% of trades; however, it still ends up in the red. This is not a theoretical edge case. It describes a real pattern called the Martingale-adjacent strategy, in which one tragic losing trade wipes out small, frequent profits.
The sustainable benchmark to look for: A win rate of around 55%–65% paired with a minimum 2:1 risk-to-reward ratio. A provider achieving 60% with 3:1 is, by most professional standards, authentically remarkable.
Pro Tip:If a provider shows a 90%+ win rate with no clear explanation of how losses are managed, treat it as a red flag rather than a unique selling point.
Strategy Transparency: Do You Know What You Are Copying?
Trustworthy providers describe their strategy. If a provider cannot, or will not, explain their entry rules, exit rules, and risk management approach in plain English, you are allocating your funds without understanding where they are heading.
Here is a straightforward checklist to assess the transparency of a strategy:
| Check | Green Flag | Red Flag |
| Entry/exit rules | Clearly documented and rule-based | Vague, absent, or described only as ‘intuition’ |
| Risk management | Stop-losses on every trade, defined lot sizing | No stop-losses; recovery strategies after losses |
| Strategy type | Trend-following, breakout, mean-reversion with logic | Martingale, grid trading, or undefined |
| Leverage use | Conservative leverage with clear logic and justification | Extremely high leverage with no explanation |
| Trade frequency | Consistent with stated strategy | Erratic, likely emotional decision-making |
Martingale strategies, which refer to position sizes doubling after a loss to recover, can produce steady short-term returns but may carry higher risk. Even if they produce consistent short-term gains, the eventual large loss can be disastrous, especially if your account size varies from the provider’s.
Pro Tip: Ask yourself: if this provider stopped trading tomorrow, could I comprehend and replicate their strategy? If the answer is no, that deserves a lot of cautious thinking.
Asset Concentration: Is Performance Built on One Market?
Some providers achieve astonishing numbers by trading a single asset, maybe gold, or a specific currency pair, during a period when that market happens to trend strongly in one direction. This is not necessarily dishonest, but it does carry a specific risk. When that market reverses or enters a range-bound phase, the entire strategy can unfold quickly.
What to look for:
- Diversified across multiple assets: EUR/USD, GBP/JPY, Gold, Oil, and Indices, a green flag for robustness.
- Heavy focus on one pair or one commodity: A potential vulnerability when that market changes character.
- Consistent performance across different market conditions: This is the gold standard. Can the provider produce results in trending and ranging markets alike?
Spreading across asset classes does not eliminate risk, but it does reduce the impact of any single market moving against you.
Fees: What Are You Actually Keeping?
This is one of the most overlooked areas in copy trading, particularly for those asking the question: can copy trading be profitable? The honest answer is yes, but only if you calculate your net return properly.
Here are the typical fee layers to be aware of:
| Fee Type | Typical Range | Example Impact |
| Performance fee | 5%–30% of profits | 20% fee on a 10% gain leaves you with 8% net |
| Monthly subscription | Varies by provider | Fixed cost regardless of performance |
| Spread per trade | Built into the execution price | Widens your effective entry/exit costs |
| Commission per trade | Per lot, varies by account type | Compounds across a high-frequency strategy |
Worked example:
A provider achieves 10% gross return in a month. After a 20% performance fee, your net gain is 8%. If monthly spreads and commissions cost a further 1.5%, your actual return is 6.5% — not 10%.
Always request or calculate the all-in cost before committing to a provider. Gross return figures shown on leaderboards do not account for the fees you personally pay.
Pro Tip:When evaluating any copy trading tips from forums or social channels, check whether the returns quoted are gross or net. Gross figures are almost always used because they look better.
Trade History: Reading Between the Lines
On the VT Markets copy trading platform, traders can review full trade histories, including entry price, stop-loss levels, and lot sizing. This transparency allows copiers to evaluate discipline and risk management before allocating funds.
Here is what to look for:
- Consistent lot sizing: A disciplined provider uses similar position sizes relative to their account. Erratic sizing, especially unusually large trades after a losing streak, suggests emotional or recovery-driven trading.
- Stop-losses on every trade: The absence of stop-losses is one of the clearest signs of reckless risk management.
- Trade duration consistency: If a provider claims to be a swing trader, but half their trades are closed within minutes, the strategy description does not match the execution.
- Absence of overnight or weekend holding without justification: Some strategies legitimately hold positions, but unexplained overnight exposure on high-leverage accounts adds risk.
| What You See in Trade History | What It Actually Means |
| Uniform lot sizes (e.g., 0.10 lots per trade) | Disciplined, mechanical execution — a positive sign |
| Doubling lot size after a loss | Martingale behaviour — significant risk flag |
| No stop-loss on any trade | High exposure; one bad trade can be destructive |
| 3–6 months of history only | Inadequate — could reflect one market regime |
| 12+ months across varied conditions | More reliable proof of a consistent edge |
Industry standards generally consider a track record of 12 months or more as meaningfully reliable for assessing a copy trading provider.
Why Your Results on VT Markets Copy Trading May Differ from the Provider’s
This is something every copier must understand before committing real capital. This is particularly relevant when exploring the best apps for copy trading. It is where performance statistics are prominently displayed.
Even with a legitimately strong provider, your account results can differ from theirs for several important reasons:
- Entry timing: Your copy trade is executed moments after the provider’s. In fast-moving markets, even a two-second delay can shift your entry price significantly.
- Account size differences: If your account is significantly smaller or larger than the provider’s, the trade scaling may not be perfectly proportional.
- Risk settings: If you copy at 50% of the provider’s risk level, your gains and losses are both halved, which is fine. However, the percentages shown on the leaderboard may not reflect your experience.
- Slippage: Execution prices in copy trading are not always identical to the signal provider’s, particularly during high-volatility events.
None of this means copy trading cannot be profitable. It absolutely can be! Nevertheless, this means that the provider’s historical performance is a guide, not a guarantee. Past performance is not indicative of equivalent future results for copiers.
Pro Tip: Set your initial copy allocation conservatively. Starting at 25%–50% of the provider’s suggested risk level gives you time to observe real execution before scaling up.
FAQs
Q1: What metrics should you check before copying a trader?
When analysing copy trading providers and copying a trader, review the following metrics:
- Consistent equity growth
- Manageable drawdowns
- Balanced win rate and risk-reward ratio
- Transparent strategy rules
- Clear trade history with disciplined position sizing
Q2: Can copy trading be profitable for beginners?
Yes. Copy trading for beginners can be a profitable and educational experience, on the condition that you choose providers carefully, using the metrics above.
The key is understanding that profitability depends on the provider’s performance, your own fee structure, risk settings, and how closely you monitor the account.
Q3: What is a good Maximum Drawdown for a copy trading provider?
Generally speaking, an MDD below 20% is considered manageable for most retail copiers. Between 20% and 35% may still be acceptable if the strategy’s returns are strong enough to justify it. Anything above 50% would be too risky and requires further considerations.
Q4: How many providers should I copy at once?
Most experienced copy traders recommend starting with two to three providers across different strategies and asset classes. This reduces single-provider concentration risk. Spreading across five or more providers with small allocations can further reduce volatility in your overall portfolio.
Q5: Which are the best apps for copy trading?
The best apps for copy trading combine transparent provider statistics with reliable execution and regulated oversight. When assessing platforms, look for clearly displayed equity curves, full trade history access, fee breakdowns, and the ability to set your own risk parameters independently of the provider’s settings.
VT Markets’ copy trading platform allows traders to monitor the provider statistics in intuitive user interface and automatically replicate trades from high-performing providers.
Q6: How do I know if a provider is using a Martingale strategy?
Look at the trade history for increasing lot sizes following consecutive losses. If a provider regularly doubles or significantly increases position size after a drawdown period, that is a strong indicator of Martingale or recovery-style trading, both of which carry elevated risk for copiers.
Start Copy Trading with VT Markets Today
If you are ready to explore copy trading, VT Markets provides access to tools and platforms to help you get started. Trade on the robust VT Markets app, designed for speed, reliability, and advanced trading features.
For ongoing support, our Help Centre offers resources and platform guidance to help you build confidence as you learn.
Open your account with VT Markets today and access secure, transparent, and competitive copy trading across some of the world’s most popular markets.
Create your VT Markets copy trading account or log in now.


