






Key Points
- Australian equities remain sensitive to higher US Treasury yields, rising oil prices and renewed inflation concerns.
- Markets are watching upcoming Australian labour data for clues on the Reserve Bank of Australia’s interest-rate outlook.
- The RBA has signalled that persistent inflation could require further policy tightening.
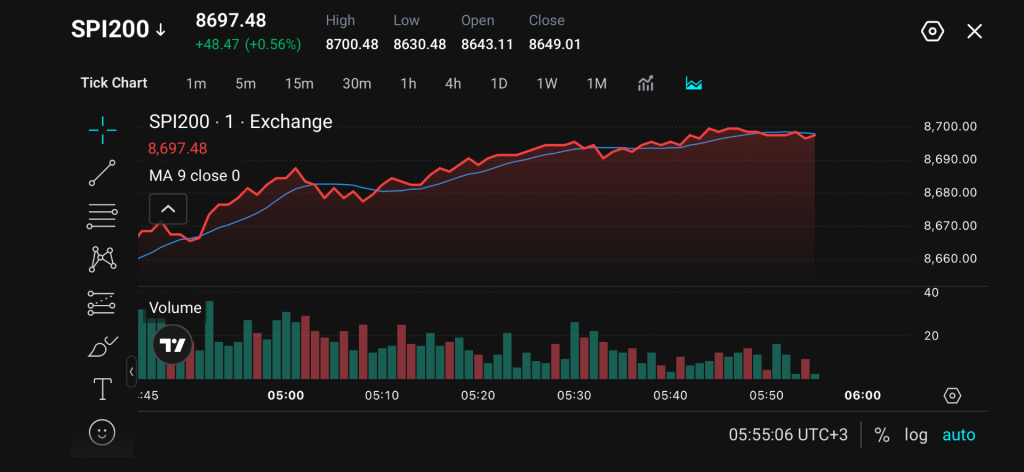
- SPI200 recovered to around 8,697 after falling toward the 8,630 support area during the session.
Market Move
Australian equity futures rebounded after opening weakness, with SPI200 climbing to around 8,697 after testing a session low near 8,630.
SPI200 moves higher throughout the session, recovering from the early decline and gradually forming higher lows. The index traded above the 9-period moving average, suggesting short-term buying momentum has improved.
However, price action stalled near the 8,700 resistance zone, indicating traders remain cautious ahead of key economic data and central bank signals.
Why Traders Are Watching SPI200
Traders are closely monitoring SPI200 as Australian equities recover ahead of key labour market data, which could influence expectations around the Reserve Bank of Australia’s (RBA) future policy direction.
SPI200’s recovery followed earlier pressure from Wall Street losses, rising US Treasury yields and renewed inflation concerns. Higher bond yields have put additional pressure on stocks, while oil prices above USD 103 have increased focus on potential inflation pressures.
These factors have affected the outlook for interest rates, with traders assessing whether central banks may maintain a conservative stance.
Key Trading Levels
| Level | Price Area | Explanation |
| Resistance 1 | 8,700 | Immediate resistance zone where the latest rebound slowed |
| Resistance 2 | 8,750 | Break above this level could signal stronger short-term recovery momentum |
| Support 1 | 8,630 | Session low and key near-term support area |
| Support 2 | 8,600 | Psychological support level if selling pressure returns |
| Moving Average | Around 8,690 | Short-term trend reference based on the chart |
SPI200 is currently testing the 8,700 resistance area after recovering from the session low. Holding above the 8,690 moving average could keep short-term momentum positive, while a break below 8,630 may indicate renewed downside pressure.
Bullish and Bearish Setups
| Scenario | Conditions | Potential Outcome |
| Bullish Setup | SPI200 breaks above 8,700 and maintains momentum above the short-term moving average | Buyers may target 8,750 resistance as sentiment improves |
| Bearish Setup | SPI200 falls below 8,630 support | Selling pressure may increase towards 8,600 |
For a bullish scenario, it will depend on whether buyers can push the index above the 8,700 resistance zone. If so, 8,750 will become the next target level.
For a bearish setup, sellers need to regain control below the 8,630 support area, potentially increasing pressure towards 8,600.
Disclaimer
The price levels and market scenarios above reflect the author’s assessment at the time of writing. They do not represent financial advice or an official recommendation from VT Markets. Traders should conduct their own analysis and manage risk carefully.
SPI200 Prediction: What’s Next
SPI200 remains influenced by a combination of domestic monetary policy expectations and global market conditions.
Australian employment data will be closely watched after previous labour figures showed weaker employment conditions and a rise in unemployment. A stronger labour market could support expectations for continued economic strength, boosting the SPI200. While weaker data may increase uncertainty around the RBA’s policy path, leading to a potential decline in the SPI200.
Traders are also monitoring oil prices and geopolitical developments, as higher energy costs may contribute to inflation pressures and influence central bank decisions.
Trade SPI200 with VT Markets
Access SPI200 trading opportunities with competitive conditions, advanced platforms and market tools designed to help traders monitor global indices.
Monitor SPI200 price action alongside USDX, forex, indices and other global CFD markets at VT Markets.
Start an account and trade index CFDs today.
Frequently Asked Questions
What is SPI200?
SPI200 is an Australian stock index futures instrument that tracks the performance of major Australian equities, commonly reflecting movements in the ASX 200 market.
Why did SPI200 recover after falling earlier?
SPI200 recovered as buyers returned after the initial sell-off, with the index moving back above its short-term moving average and approaching the 8,700 resistance area.
What levels should traders watch for SPI200?
Traders are monitoring 8,700 as resistance and 8,630 as support. A breakout or breakdown from these levels may provide further directional clues.
How do interest rates affect SPI200?
Higher interest rates can increase borrowing costs and affect equity valuations, while changing rate expectations can influence investor sentiment.
What factors could move SPI200 next?
Key factors include Australian labour data, RBA policy expectations, US Treasury yields, oil prices and broader global risk sentiment.
Start trading now — click here to create your real VT Markets account.








