






Nebius shares came under heavy selling pressure after the AI cloud company reported a sharp increase in third-quarter revenue but lowered the timing of part of its growth expectations. The results showed continued expansion in AI infrastructure demand, yet the market focused on delays to third-party data-centre capacity and a much larger capital-spending programme. The move also pressured other AI infrastructure stocks as investors reassessed the cost and pace of the sector’s expansion.
Key Points
- NBIS closed at $128.64, down 16.84% on 12 November after the Q3 earnings release.
- Q3 revenue surged 571% year-on-year to $980.8 million, ahead of the roughly $907.5 million consensus estimate, but Nebius now expects 2026 revenue at the low end of its previous $3.0–$3.4 billion range.
- Traders are watching $130 resistance and $120 support, while the 4H chart shows NBIS trading below its 50 EMA at $162.64 with RSI at 40.92.
Why worth watching
Nebius delivered rapid top-line growth in the third quarter, with revenue rising 571% year-on-year to $980.8 million. Adjusted EBITDA also turned positive at $465.8 million, highlighting the scale of the company’s AI cloud expansion.
However, investors focused on the timing of that growth after Nebius said some third-party capacity expected to come online in 2026 has shifted into the first half of 2027. The company therefore expects 2026 revenue at the low end of its previous $3.0–$3.4 billion range.
Capital spending has also moved higher. Nebius now expects approximately $27 billion of 2026 capital expenditure, above its previous $20–$25 billion range, while its initial 2027 outlook includes $40–$45 billion of capex alongside a $12–$13 billion revenue target.
The scale of the planned investment has shifted attention towards funding requirements, execution and the timing of profitability. Nebius expects to reach pre-tax breakeven by the fourth quarter of 2027.
The sell-off also spread across other AI infrastructure names, including CoreWeave earlier in the week, and IREN, reinforcing the market’s focus on the cost of building AI capacity and the returns that operators can generate from that spending.
Prepare for fast market changes: ‘What is a Stock Market Crash: Understanding the Sell-Off’
Key trading levels
- At $162.64: 50 EMA and major near-term recovery resistance
- At $130: Immediate resistance and psychological level
- At $128.64: Recent closing price
- At $120: Near-term support area
- At $113.37: Recent low and deeper downside reference
Use VT Markets’ tools to monitor support, resistance and momentum as the next Nebius setup develops.
Technical analysis
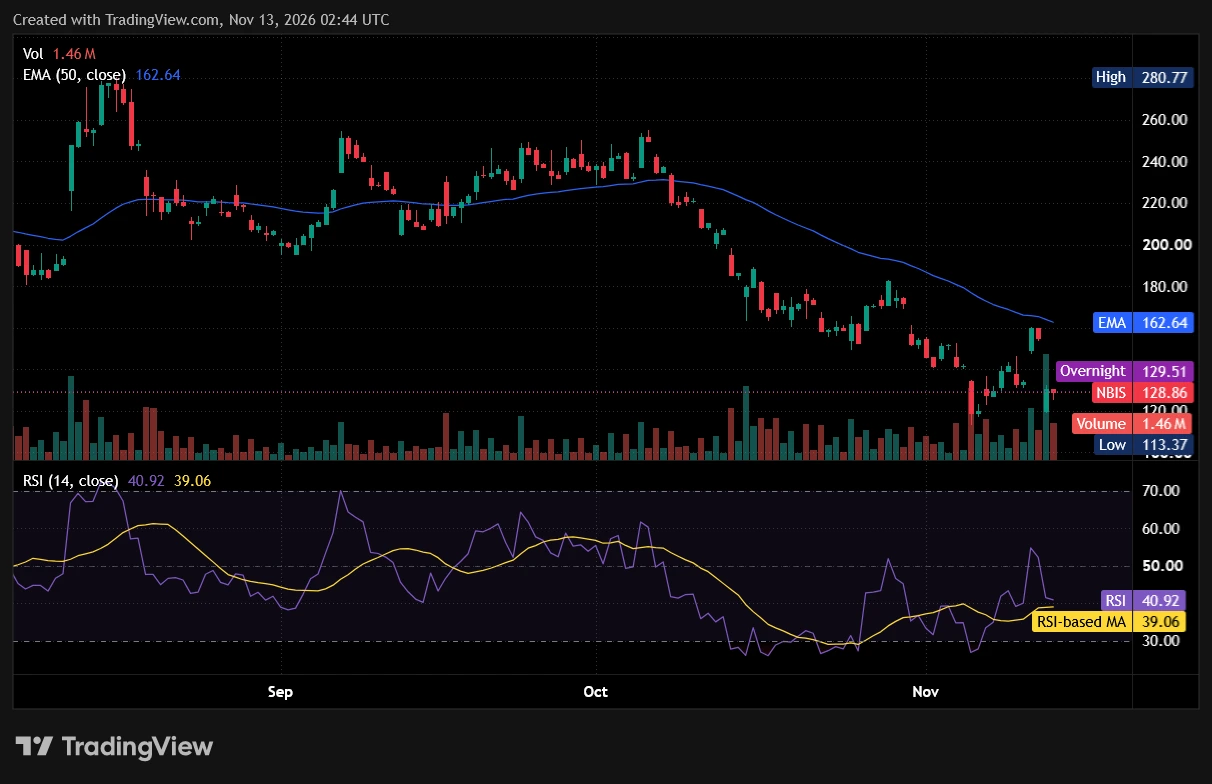
NBIS is trading near $128.86 on the supplied 4H chart, well below the 50 EMA at $162.64 after the stock’s sharp decline from the September and October highs. The broader price structure remains weak, with the recent rebound failing to recover the moving average and the latest move returning price towards the lower end of the recent range.
The RSI (14) is at 40.92, above the oversold 30 area but below the neutral 50 level. This indicates that selling pressure has eased from the more extreme levels seen earlier in November, although momentum remains relatively weak. The RSI recovery therefore points to some stabilisation rather than a confirmed reversal.
The immediate technical range sits between $120 support and $130 resistance.
A sustained move above $130 would suggest that buyers are beginning to absorb the post-earnings selling and could bring the 50 EMA at $162.64 into focus as a wider recovery reference. Conversely, a break below $120 would weaken the recent stabilisation and put the $113.37 low back into focus.
- Bullish scenario: NBIS holds above $120 and breaks through $130, indicating that selling pressure is beginning to ease. A sustained recovery above $130 would strengthen the short-term setup and shift attention towards the 50 EMA at $162.64.
- Bearish scenario: NBIS fails to hold $120 and selling pressure resumes. A break below the recent $113.37 low would weaken the current stabilisation attempt and suggest that the post-earnings downtrend remains dominant.
The price levels and trade scenarios above reflect the author’s view at the time of writing and do not represent financial advice or an official recommendation from VT Markets. Traders should conduct their own analysis and manage risk carefully.
Next market drivers
Beyond the chart, traders are watching Nebius’ progress in bringing delayed data-centre capacity online, the pace of AI infrastructure spending and the company’s 2027 growth targets. Broader sentiment across AI infrastructure stocks will also remain relevant, particularly as investors assess whether rising capital expenditure can translate into sustained revenue growth and profitability.
Read about the industry’s progress: ‘The AI Credit Line Just Got Expensive‘
Trade Nebius and share CFDs with VT Markets
Nebius is a Nasdaq-listed AI cloud company that provides infrastructure for developers and businesses building AI applications. Its shares can be sensitive to earnings growth, data-centre capacity, capital expenditure, financing conditions and broader sentiment towards AI infrastructure companies.
VT Markets offers access to more than 800 share CFDs across major global markets, allowing traders to speculate on share price movements without owning the underlying shares. Check individual instrument availability and trading conditions on VT Markets APP.
Frequently Asked Questions
What is happening to Nebius stock?
Nebius shares fell sharply after its Q3 earnings as investors focused on delayed data-centre capacity, a lower 2026 revenue outlook and higher planned capital expenditure despite strong revenue growth.
How is Nebius stock different from a Nebius CFD?
Nebius stock represents ownership in the underlying company. A Nebius CFD allows traders to speculate on the share price movement without owning the underlying shares.
Can I trade Nebius with VT Markets?
VT Markets offers more than 800 share CFDs across global markets. Whether NBIS is currently available depends on the live instrument list for the relevant VT Markets account and platform, so traders should check the current platform specifications before trading.
Trade Share CFDs | Read Economic Insights | Sign Up with VT Markets
Start trading now — click here to create your real VT Markets account.



