





Key Points:
- Gold retreats towards the $4,300 area after a sharp decline as traders took profits following the recent rally.
- The precious metal moved lower after reaching a two-month high, as investors reassessed whether inflation-related momentum could continue.
- Softer US inflation data reduced expectations of further Federal Reserve tightening, but the absence of fresh catalysts encouraged some profit-taking.
- Traders are monitoring Federal Reserve expectations, US dollar movements and upcoming economic data for the next direction in XAUUSD.
- Gold remains sensitive to changes in interest-rate expectations because higher yields can increase the opportunity cost of holding non-yielding assets.
Gold prices retreated towards the $4,300 area after a sharp pullback as traders locked in gains from the recent rally and reassessed the outlook for inflation, interest rates and Federal Reserve policy.
The move followed a period of strength for bullion, supported by softer US inflation expectations and reduced concerns over near-term rate hikes.
However, after reaching recent highs, gold faced selling pressure as some investors took profits and waited for clearer signals on the next phase of monetary policy.
Recent market attention has shifted from the strength of the rally towards whether gold can maintain its momentum after the correction.
Why Traders Are Watching Gold
Gold remains closely tied to interest-rate expectations, as softer inflation data has reduced concerns over further Federal Reserve tightening and supported demand for the non-yielding asset.
However, traders are monitoring incoming US inflation data, dollar strength, and Treasury yields, since a stronger currency or rising yields increase the opportunity cost of holding gold.
Meanwhile, the market is assessing whether gold’s recent price decline is just a brief pullback following strong gains or the start of a new trading range.
Short-term volatility will likely continue to be driven by shifting market positioning and ongoing profit-taking as investors adjust to the evolving monetary landscape.
Key Trading Levels
| Price Level | What Traders Are Watching |
| $4,365 | Recent intraday high and immediate resistance area |
| $4,350 | Short-term resistance after the recent recovery attempt |
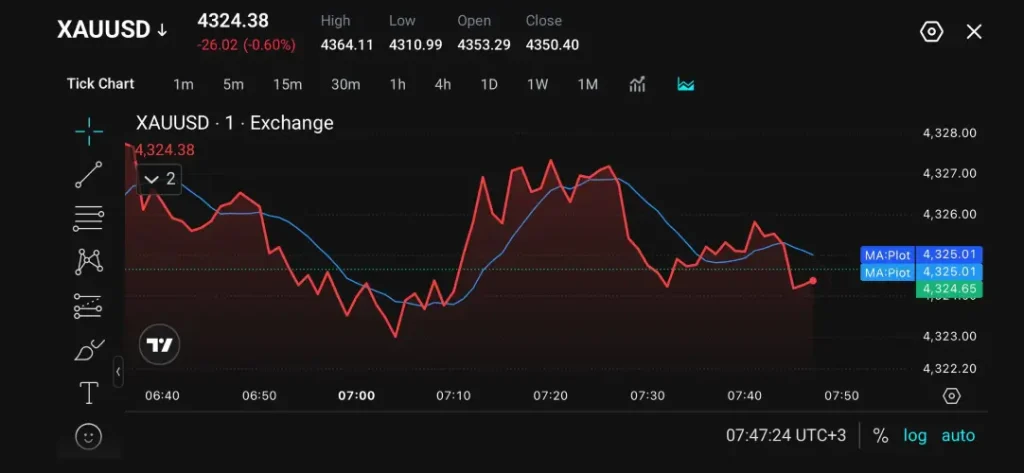
| $4,325 | Current trading area and near-term price reference |
| $4,310 | Intraday low and key support level |
| $4,300 | Psychological support area if downside pressure continues |
Gold is trading around the $4,325 area after recovering from the session low near $4,310.
A move above $4,350 could strengthen short-term momentum and bring the $4,365 resistance area back into focus.
On the downside, a break below $4,310 could signal renewed selling pressure, with the $4,300 support zone becoming the next level to monitor.
Bullish and Bearish Setups
| Setup | Trigger | Potential Market Reaction |
| Recovery Continuation | Hold above $4,325 | XAUUSD may retest the $4,350 resistance area |
| Bullish Breakout | Break above $4,365 | Momentum could strengthen towards higher levels |
| Range Consolidation | Hold between $4,310 and $4,350 | Gold may remain rangebound as traders assess direction |
| Bearish Breakdown | Fall below $4,310 | Selling pressure could increase towards $4,300 |
The bullish scenario depends on gold maintaining support above the $4,325 area and recovering towards the $4,350 to $4,365 resistance zone. A sustained move above $4,365 could indicate renewed buying interest.
The bearish scenario becomes more relevant if XAUUSD breaks below $4,310, which could signal weakening momentum and expose the $4,300 support area.
Disclaimer
The price levels and market scenarios above reflect the author’s view at the time of writing and do not represent financial advice or an official recommendation from VT Markets. Traders should conduct their own analysis and manage risk carefully.
Trade Gold CFDs with VT Markets
Gold remains one of the most actively monitored markets as traders assess changes in inflation expectations, interest-rate outlooks and global risk sentiment.
With VT Markets, traders can access gold CFDs alongside other global markets, including forex, indices, commodities and shares.
The platform provides tools to monitor price movements, analyse charts and track key technical levels as market conditions develop.
Start trading gold CFDs with VT Markets today.
Why Trade Gold as a CFD?
Gold CFDs allow traders to follow price movements in the precious metal without owning physical gold.
This flexibility allows traders to monitor how gold responds to major market drivers, including inflation data, central bank policy expectations and movements in the US dollar.
With VT Markets, traders can access gold price movements alongside other CFD markets through one trading account.
What to Watch Next
Gold’s next direction will depend largely on how upcoming economic data influences Federal Reserve expectations.
Key factors include:
- US Inflation Data: The pace of inflation trends and their impact on rate expectations.
- Federal Reserve Policy Signals: Any changes in policymakers’ views on future interest-rate decisions.
- Treasury Yields: Movements in yields that could influence demand for non-yielding assets.
- US Dollar Direction: Dollar strength or weakness that may affect XAUUSD.
- Market Positioning: Ongoing profit-taking and changes in investor positioning after gold’s strong rally.
From a technical perspective, traders are watching whether gold can break above $4,350, while $4,310 remains the key short-term support level if downside pressure returns.
Frequently Asked Questions
Why did gold fall after reaching recent highs?
Gold declined as some investors took profits after the recent rally, while markets reassessed whether the previous momentum could continue.
How do interest rates affect gold prices?
Higher interest rates can increase the opportunity cost of holding gold because the metal does not generate interest income. Lower rate expectations can support gold demand.
Why is the US dollar important for gold?
Gold is priced in US dollars, so changes in the dollar can influence how attractive gold is for international buyers.
What are the key gold price levels traders are watching?
Traders are monitoring the $4,350 resistance area, while $4,310 and $4,300 are key support levels if downside pressure continues.
Could gold recover after the pullback?
A recovery would depend on whether buyers regain momentum and whether broader factors, including Fed expectations and dollar movements, become supportive.
Start trading now — click here to create your real VT Markets account.








