






Key Points
- US stocks erased Wednesday’s rally. The Dow fell 3.4%, the S&P 500 lost 4.4% and the Nasdaq Composite dropped 5.5% on Thursday.
- AI policy concerns hit technology shares. Investors reassessed the outlook for data-centre expansion following the Democrats’ congressional victory.
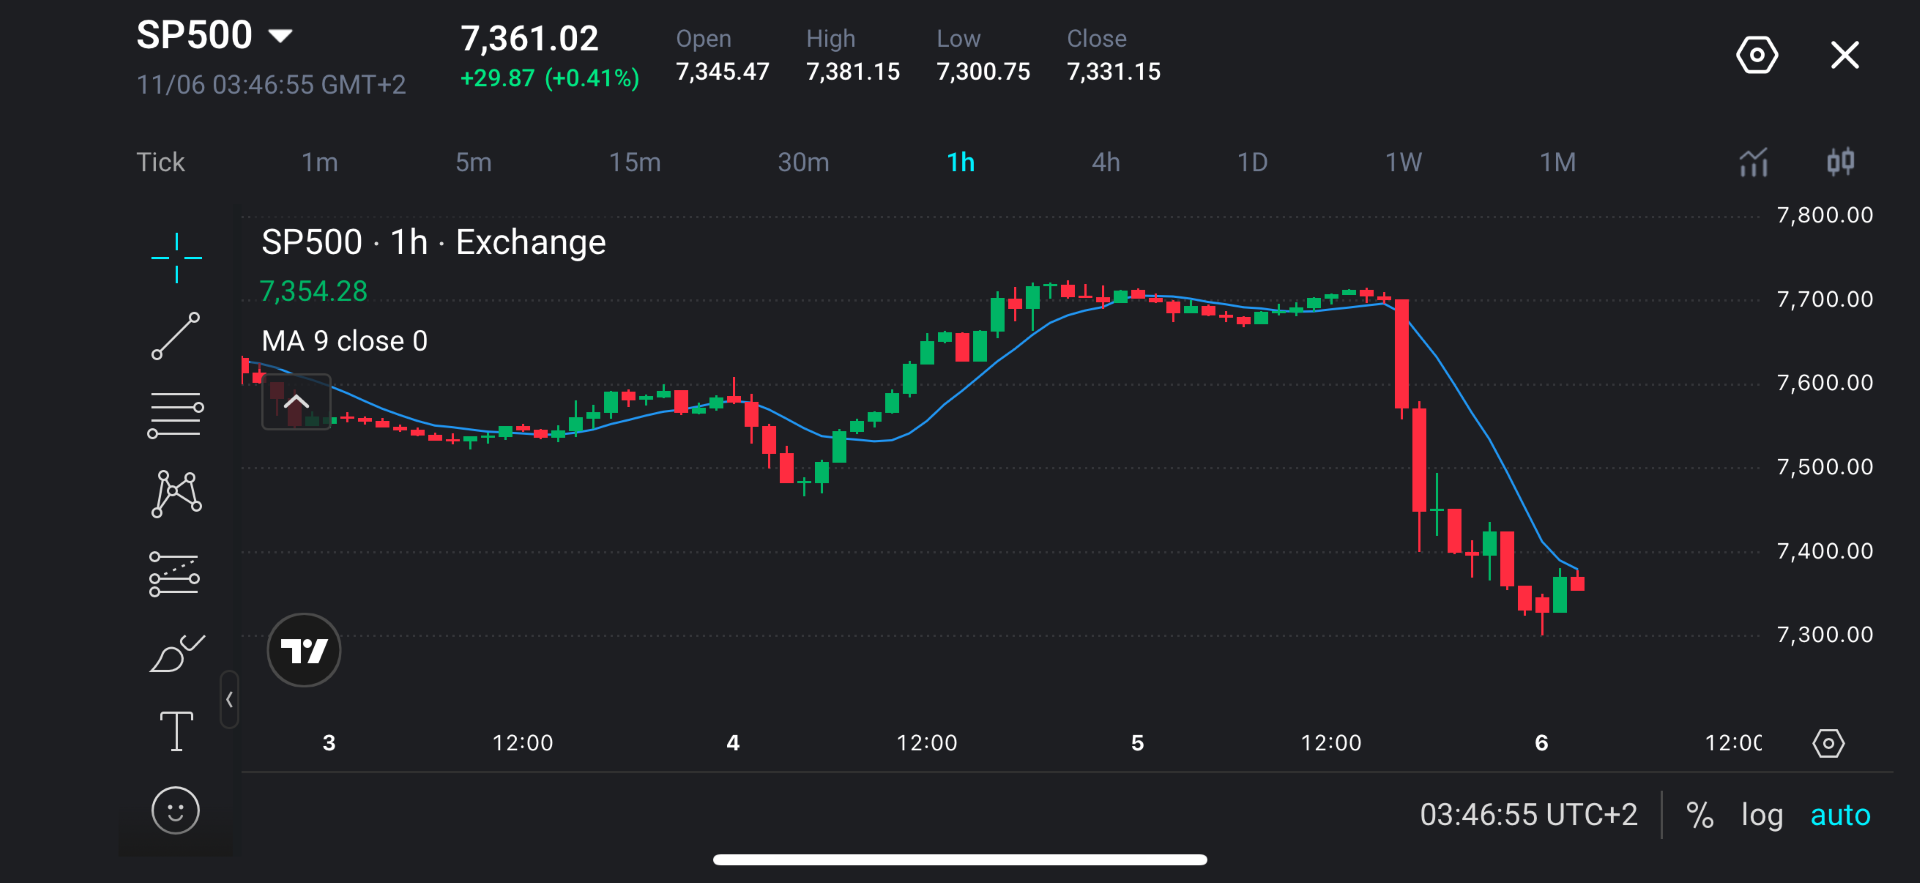
- SP500 remains vulnerable below 7,400. The supplied hourly chart shows a sharp decline towards 7,300, with the rebound yet to establish a sustained recovery.
- Employment data is the next major catalyst. Friday’s US jobs report could influence growth expectations, Treasury yields and the appetite for equities.
Market Move
US stocks plunged on Thursday, 5 November, as heavy selling in AI and semiconductor shares spread across Wall Street. The decline erased Wednesday’s post-election gains, reversing optimism that followed the removal of election uncertainty.
The Dow Jones Industrial Average fell 1,833.06 points, or 3.4%, to 51,523.06. The S&P 500 dropped 334.89 points, or 4.4%, to 7,353.73, while the Nasdaq Composite lost 5.5% to 24,315. Small-cap stocks also retreated, with the Russell 2000 falling 4.4%, showing that selling extended beyond large technology companies.
Retail investors joined the selling. According to reports, individual investors sold a net of $265 million in individual US stocks, their largest daily net selling total since 2020.
Why Traders Are Watching
Thursday’s reversal showed that investors were already considering how a Democratic-controlled Congress could affect business investment, regulation and corporate earnings. Technology shares bore the brunt of the sell-off as investors questioned whether tighter oversight of AI infrastructure could weaken spending and earnings expectations. Concerns on data-centre development turned into a broader reduction in exposure to US equities.
Oil continues to be another source of uncertainty in the market. Prices have recovered as investors monitor developments in Iran. Brent traded around $98 per barrel, while WTI was around $90, reversing part of the previous session’s decline. If prices continue rising, it could further pressure corporate margins.
Key Trading Levels
| Level | Technical role | What traders are watching |
| 7,380–7,400 | Initial resistance | Recent rebound highs and the nearby falling nine-period moving average. |
| 7,450 | Secondary resistance | An intermediate level within Thursday’s sharp decline. |
| 7,480–7,500 | Recovery barrier | Earlier support and a psychological level that could attract renewed selling. |
| 7,550–7,600 | Higher resistance | A broader recovery zone containing previous trading activity. |
| 7,330–7,350 | Immediate support | The recent candle cluster beneath the displayed price. |
| 7,300–7,310 | Main near-term support | The latest low area, including the displayed low of 7,300.75. |
| 7,250, then 7,200 | Downside reference levels | Round-number areas below the visible low. |
SP500 remains weak after the sharp decline from around 7,700. Price is trading close to a falling nine-period moving average, while the latest bounce has yet to reclaim 7,400.
A sustained recovery above 7,380–7,400 would be an initial sign that selling pressure is easing. However, a stronger recovery would require follow-through towards 7,450 and 7,480–7,500. Below the market, 7,300–7,310 is the clearest near-term support area.
Bullish and Bearish Setups
| Scenario | Trigger | Potential levels |
| Bullish setup | Support holds around 7,300–7,330, followed by an hourly close above 7,400 and a successful retest. | 7,450, then 7,480–7,500. |
| Bearish setup | A rebound fails around 7,380–7,400, followed by a sustained break below 7,300 and a failed recovery attempt. | 7,250, then 7,200. |
The bullish setup requires evidence that buyers can defend the recent low and reclaim nearby resistance. Holding above 7,400 after a retest would strengthen the case for a recovery towards 7,450–7,500. A return below 7,330 would weaken that recovery attempt.
The bearish setup follows the prevailing short-term direction. Rejection near 7,400, followed by a break beneath 7,300, would suggest sellers remain in control. A sustained recovery above 7,400 would weaken the immediate bearish case.
Disclaimer
The price levels and market scenarios above reflect the author’s assessment at the time of writing. They do not represent financial advice or an official recommendation from VT Markets. Traders should conduct their own analysis and manage risk carefully.
SP500 Prediction: What Could Move Prices?
The next major catalyst is Friday’s job report. US-based employers reported 43,994 announced job cuts in October, down sharply from a year earlier and the lowest October total since 2023. However, this does not indicate stronger permanent hiring as employers may retain existing staff without adding permanent roles. Seasonal hiring for the holidays can also lift recruitment numbers temporarily.
Friday’s jobs report will provide a broader picture of hiring, unemployment and wage growth.
Stock prices could recover if:
- AI and semiconductor shares stabilise. Reduced selling in major technology stocks could help the index establish a floor.
- Employment data supports steady growth. Resilient hiring with contained wage pressure could improve confidence without sharply lifting yields.
- Policy proposals appear less restrictive than feared. Clearer guidance on data-centre development could reduce uncertainty around investment plans.
- Oil prices ease. Lower energy costs could improve the outlook for inflation and corporate margins.
Prices could fall further if:
- Technology selling continues. Further reductions in exposure to large index constituents could outweigh strength elsewhere.
- Regulatory concerns intensify. Concrete restrictions on AI infrastructure could trigger further revisions to earnings expectations.
- Jobs data unsettles markets. Strong wage growth could lift yields, while weak hiring could raise concerns about demand.
Trade SP500 with VT Markets
Explore index CFD trading with VT Markets and monitor SP500 alongside other global equity benchmarks.
The S&P 500 remains closely watched during periods of technology-sector volatility, major economic releases and shifting Federal Reserve expectations.
With VT Markets, traders can access SP500 and other index CFDs alongside forex, gold, oil, share CFDs, ETFs and other global markets through one platform. This allows traders to monitor broad market movements while comparing developments across technology stocks, commodities, currencies and other major asset classes.
Use VT Markets’ charting tools to monitor support, resistance, moving averages and breakout behaviour as the next SP500 setup develops.
Start a live trading account today and discover 24/7 trading.

Frequently Asked Questions (FAQs)
Why did US stocks fall on 5 November?
US stocks fell as investors sold AI and semiconductor shares amid concerns about tighter oversight of data-centre development. The selling spread across the broader market, erasing Wednesday’s post-election gains.
How much did US stocks fall?
The S&P 500 dropped 334.89 points, or 4.4%, to 7,353.73. The Dow fell 3.4%, while the Nasdaq Composite lost 5.5%.
Why do AI stocks affect the S&P 500?
The S&P 500 weights companies by their float-adjusted market value. Large technology companies therefore have a substantial influence on its performance. Heavy selling in these stocks can pull the index lower even when some other sectors hold steady.
What could support an SP500 recovery?
Stabilising technology shares, easing oil prices and employment data that supports steady growth could improve sentiment.
What could push SP500 lower?
Further technology selling, tighter restrictions on AI infrastructure or disappointing employment data could increase pressure.
Why are traders watching Friday’s US jobs report?
The report provides information on payroll growth, unemployment and wages, helping traders assess economic conditions and the interest-rate outlook. Strong wage growth could lift Treasury yields, while sharply weaker hiring could raise concerns about consumer spending and corporate earnings.
Do fewer announced job cuts mean hiring is improving?
No. Fewer announced cuts suggest employers are reducing layoffs, but they may still be cautious about recruiting. Seasonal hiring can also increase temporarily without signalling stronger demand for permanent employees.
Start trading now — click here to create your real VT Markets account.



