






Gold is most often compared with the US dollar, silver, US stock indices and bitcoin. Historically, gold has tended to move inversely to the US dollar and in the same direction as silver, while its relationship with stock indices and bitcoin has shifted over time. Correlations are not fixed and can weaken or reverse, particularly during periods of market stress.
This guide walks through each of those relationships, explains why they exist, and shows why they change. It is educational only and does not recommend trading any of the instruments mentioned.
What correlation means for traders
Correlation measures how closely two prices move in relation to each other. It is expressed as a number between -1 and +1:
- +1 means the two prices moved in the same direction every time over the period measured.
- 0 means there was no consistent relationship.
- -1 means the two prices moved in opposite directions every time.
Most real markets sit somewhere in between. A correlation of +0.7 describes a fairly strong tendency to move together. A correlation of -0.3 describes a weak tendency to move in opposite directions.
Two points matter when reading any correlation. First, a correlation is measured over a specific period. The same pair of markets can show a strong reading over one window and a weak or opposite reading over another. Second, correlation is not causation. Two prices moving together does not mean one causes the other. They may be reacting to the same third factor, such as US interest-rate expectations, or the overlap may be coincidence.
This guide does not quote correlation coefficients, because a figure only means something when it names its data source, the instruments and the time window. Where a relationship is described, it is described in terms of how markets have tended to behave.
Gold and the US dollar
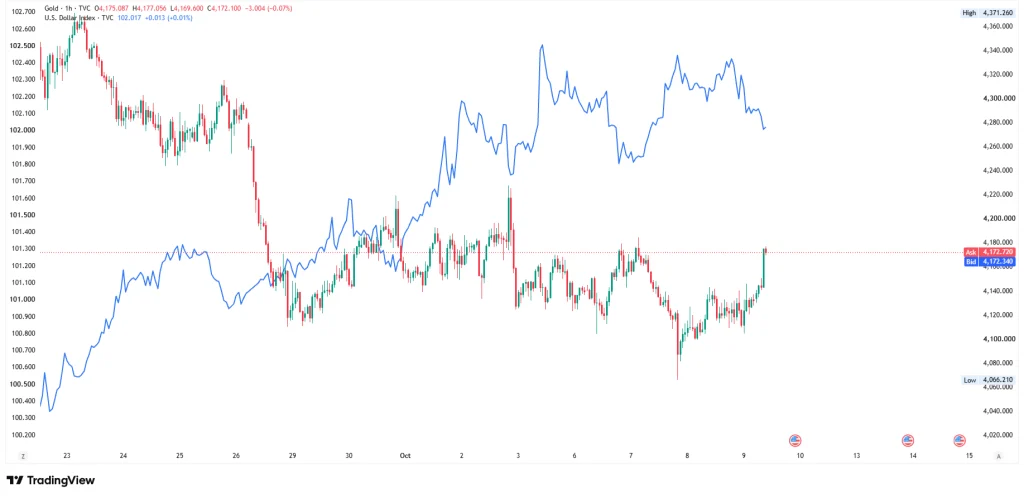
Gold has tended to move inversely to the US dollar. When the dollar has strengthened, gold has often weakened, and when the dollar has weakened, gold has often strengthened. There are two main reasons.
Gold is priced in US dollars. The gold price is quoted in dollars, so a stronger dollar makes gold more expensive for buyers using other currencies. That has tended to weigh on demand and on the dollar price. A weaker dollar has tended to have the opposite effect.
Real yields. A real yield is the interest rate on a government bond after inflation is subtracted. Gold pays no interest, so when real yields rise, holding gold has tended to look less attractive against interest-bearing assets. When real yields fall, that comparison has tended to improve. Real yields also connect to the dollar, because higher US yields have often supported the currency. The Federal Reserve’s policy decisions and communications feed into both. The guide to US Treasury yields and gold explains why traders watch real rates, and the World Gold Council publishes regular research on how the dollar and real yields relate to gold demand.
The dollar’s strength is commonly tracked with the US Dollar Index (DXY), which measures the dollar against a basket of six major currencies. The US dollar index guide explains how it is built, and the beginner’s guide to gold versus the US dollar covers the gold side of the link.
Recent months show the pattern and its limits. Based on monthly Yahoo Finance data, gold fell from about $4,600 at the start of June 2026 to about $4,040 by the end of the month, while the US Dollar Index rose from about 99 to about 101. In August, gold climbed from about $4,140 to about $4,480, peaking near $4,750, while the index edged down from about 99.7 to 99.4. In September, gold slipped back to about $4,190 as the index rose to about 101.5. Across April to September 2026, gold and the index moved in opposite directions in five of the six months. In April, both fell. Six months is a short window, and it says nothing about the next one.
Gold and silver
Gold and silver have often moved in the same direction. They share several drivers: the US dollar, real yields and safe-haven demand. A safe haven is an asset that investors have historically turned to during uncertainty.
Silver differs from gold in one important way. A large share of silver demand comes from industry, including electronics and solar panels, so silver can respond to economic growth and manufacturing news that has less effect on gold. Silver is also a smaller market, and it has historically moved more sharply than gold in percentage terms.
The same months show both sides. In June 2026, silver fell from about $74 to about $59.50 an ounce as gold fell, and in August it rose from about $58 to about $66, with a high near $71, as gold rose. In July, silver slipped from about $59 to about $57.50 while gold edged higher, so the two did not move together every month. Silver’s August range, about $58 to $71, was also wider relative to its price than gold’s, about $4,075 to $4,755.
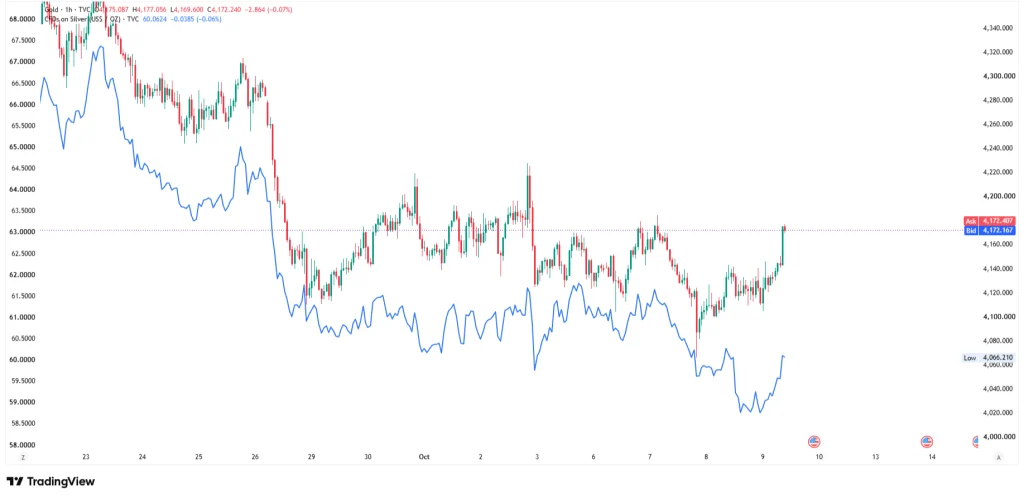
That means the two are related but not interchangeable. The full comparison, including the gold/silver ratio, is in XAUUSD vs XAGUSD: Gold vs Silver for Traders.
Gold and EURUSD
The forex pair most closely associated with gold is EURUSD. Both are priced against the US dollar. XAUUSD is gold in dollars, and EURUSD is the price of one euro in dollars, so when the dollar has weakened, both have tended to rise, and when it has strengthened, both have tended to fall.
The euro also carries the largest weight in the US Dollar Index, which links EURUSD, the dollar index and gold together. The relationship is not fixed. The European Central Bank’s policy, euro-area economic shocks and gold-specific drivers such as safe-haven demand can all cause the two to move apart.
Recent months show how loosely the link holds. In June 2026, gold fell while EURUSD rose from about 1.141 to 1.152. In July both rose, with EURUSD moving from about 1.154 to 1.159. In August they split: gold climbed to about $4,480 while EURUSD fell from about 1.162 to 1.134. In September both fell, and EURUSD ended the month near 1.122. Over the four months, the two moved the same way twice and in opposite directions twice.
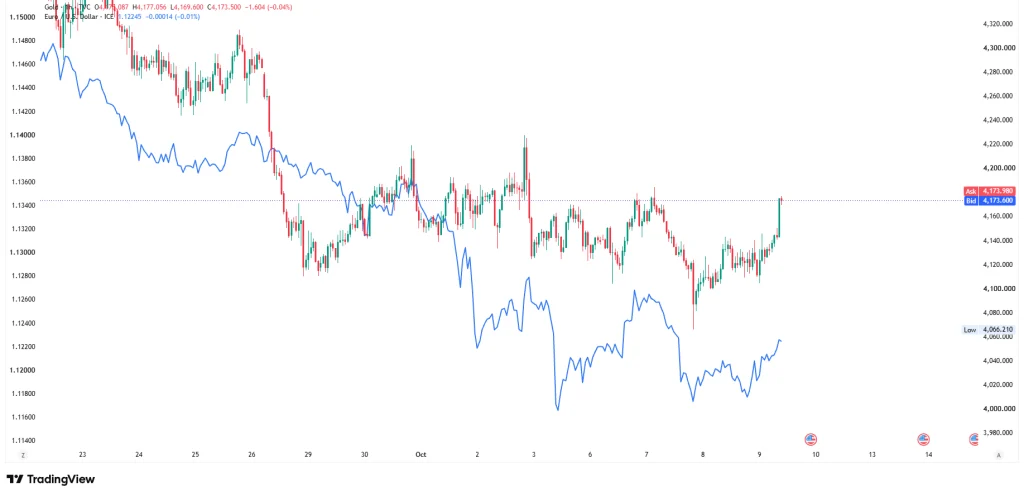
The details, including the events that move both markets, are in Gold and EURUSD Correlation Explained.
Gold and stock indices (NAS100, S&P 500)
The link between gold and stock indices depends on market mood. In a risk-on environment, investors are willing to hold assets linked to growth, such as technology shares, and demand for safe havens can fade. In a risk-off environment, investors move away from those assets, and gold has often attracted demand. This is the pattern behind the idea that gold rises when stocks fall.
It has not held consistently. Gold and stock indices have sometimes moved in opposite directions and sometimes together, particularly when interest-rate expectations drove both. Falling real yields, for example, can support both gold and growth-oriented shares. Because the relationship varies from one period to the next, it cannot be described with a single number.
Recent months were mixed. In June 2026, gold fell from about $4,600 to about $4,040 while the NAS100 finished almost where it started, near 30,300. In July, gold rose while the NAS100 fell from about 29,900 to about 28,300. In August both rose, with the NAS100 closing near 29,500. In September, gold slipped to about $4,190 while the NAS100 climbed to a close near 30,400.
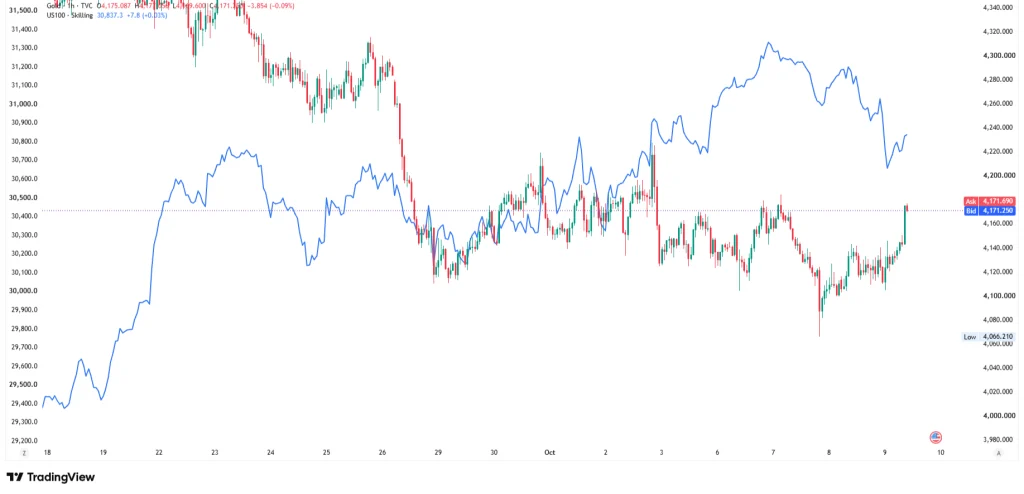
The NAS100 tracks the 100 largest non-financial companies listed on the Nasdaq stock exchange, so it is heavily weighted to technology. The S&P 500 covers 500 large US companies across sectors, and its relationship with gold can differ from the NAS100’s for that reason. See Gold vs NASDAQ 100 and the gold vs S&P 500 comparison for more.
Gold and bitcoin
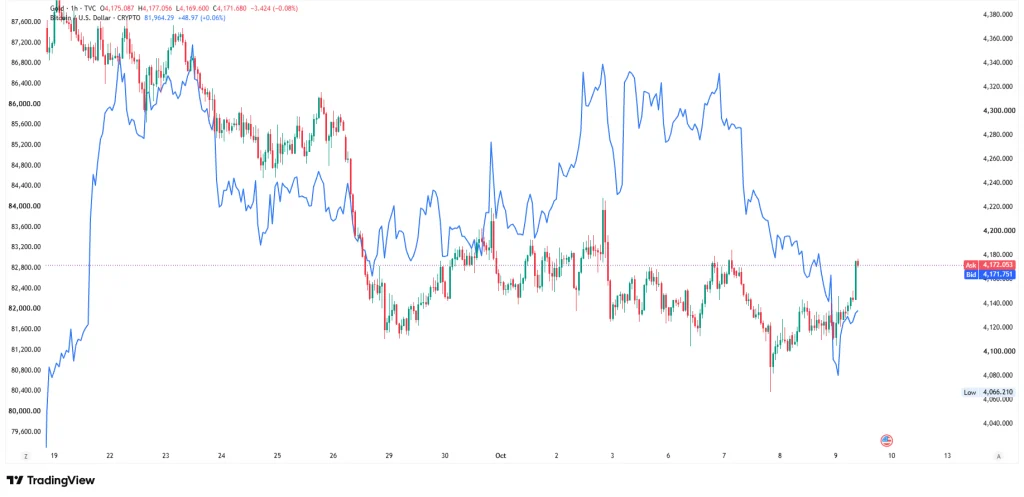
Bitcoin is sometimes compared with gold because its supply is capped. Supporters of the comparison point to that limit, and to the fact that no government or central bank issues bitcoin, as features that echo gold’s scarcity. The two markets are still driven by very different forces. Gold has tended to respond to the US dollar, real yields and central-bank buying, while bitcoin’s price has responded more to adoption, regulation, liquidity and events within the crypto industry.
The relationship between their prices has varied over time. There have been periods when gold and bitcoin moved in the same direction, and periods when they moved independently or in opposite directions, so no single figure describes it. Bitcoin has also historically been far more volatile than gold, with larger and faster price swings, and it has a much shorter history, having launched in 2009.
Recent months show how different the two are in scale. Bitcoin fell from about $73,600 to about $58,600 in June 2026 as gold fell, then rose in July and August as gold rose, reaching a high near $81,300 in August. In September it climbed again, to about $83,500, while gold slipped to about $4,190, so the pattern of the previous three months did not continue. Bitcoin’s monthly ranges were also wider relative to its price than gold’s.
Gold vs Bitcoin: Is Bitcoin Really “Digital Gold”? looks at where the comparison works and where it breaks down.
What gold traders also trade
Based on VT Markets client data in August 2026, EURUSD was the instrument most often traded alongside gold (29.6%), followed by the NAS100 (25.6%), BTCUSD (22.7%) and XAGUSD (10.3%).
This describes what clients have done. It is not a recommendation to trade any of these instruments, and it says nothing about whether any of them suits a particular person. Each of the four is covered in this guide because it is a market that gold has been compared with, and each has its own drivers, hours and risks. EURUSD shares gold’s dollar link, the NAS100 answers to some of the same interest-rate news, XAGUSD shares most of gold’s drivers, and BTCUSD has largely separate ones. That makes it useful to know, before adding a second market, how much of the first market’s exposure it repeats.
Why correlations change
Correlations are not fixed, and there are a few reasons they move.
Regime shifts. A regime is a lasting change in the market backdrop, such as a move from rising to falling interest rates, or from low to high inflation. When the backdrop changes, the forces that drive each market change too, and a relationship that held in one regime may weaken or reverse in the next.
Periods of stress. During market stress, investors often sell many assets at once to raise cash. Relationships that were stable in calm conditions can break down, and markets that normally move apart can briefly move together. Gold itself has not always behaved as a safe haven in such periods.
Changing drivers. The dominant driver of a market can change. Gold may respond mainly to real yields for a period, then mainly to safe-haven demand or central-bank buying.
Correlations change. Always check how a market behaves before you trade it, and check again over a recent period rather than relying on a figure from earlier.
Correlation also has an implication for exposure that is often misunderstood. Each CFD position is leveraged and carries its own margin and risk of loss. Two positions mean more total exposure, not less. If two markets have moved together in the past, holding both concentrates exposure to the same driver. If they have moved apart, both positions can still lose at the same time, because the relationship can break without warning.
Before trading a new instrument
Each instrument has its own contract specifications, trading hours, spreads and margin requirements, and they are different from those of gold. Before trading anything new, it helps to read those details on the VT Markets trading conditions page rather than assuming they match gold. Precious metals, currency pairs, indices and cryptocurrencies each behave differently, with different volatility and different hours.
For any second market, four questions are worth working through:
- How much of the exposure is shared? If a market has moved closely with gold, a second position may add to the same risk instead of a different one. Each position is a separate leveraged position with its own margin.
- What does the recent window show? Relationships have held in some months and not in others, and a long-run figure can hide that.
- Which events move both? FOMC meetings, US CPI and non-farm payrolls can move the dollar, gold, EURUSD and stock indices around the same time, so one release can affect several open positions together.
- Do the trading hours match? Hours differ by instrument. On the trading conditions page, for example, EURUSD opens at 00:01 platform time (GMT+3) and gold and silver at 01:01, so one can be open when the other is not.
A demo account lets someone see how an instrument moves, and how position sizes and margin work, without using real money.
FAQ
What assets are correlated with gold?
Gold is most often compared with the US dollar, silver, EURUSD, US stock indices and bitcoin. It has tended to move inversely to the dollar and in the same direction as silver and EURUSD. Its relationship with stock indices and bitcoin has varied over time, and none of these relationships is fixed.
Which forex pair correlates with gold?
EURUSD is the pair most often linked with gold. Both are priced against the US dollar, so when the dollar has weakened both have tended to rise, and when it has strengthened both have tended to fall. The relationship is not fixed, and euro-specific news can cause the two to diverge.
Why does gold move opposite to the US dollar?
Gold is priced in US dollars, so a stronger dollar makes it more expensive for buyers using other currencies, which has tended to weigh on demand. Real yields also matter: rising US yields have often supported the dollar while making non-interest-paying gold less attractive. The relationship is a tendency, not a rule.
Are gold and silver correlated?
Gold and silver have often moved in the same direction because they share drivers such as the US dollar, real yields and safe-haven demand. Silver also has large industrial demand and has historically moved more sharply than gold. The relationship is not fixed and can weaken when industrial news affects silver alone.
Is gold correlated with the stock market?
The relationship varies. Gold has sometimes risen when stocks fell, as investors moved to safe havens, and at other times moved with stocks, particularly when interest-rate expectations drove both. Because it changes with market conditions, there is no single figure that describes it, and it can reverse during periods of stress.
Do gold correlations change over time?
Yes. Correlations are measured over a specific period and can shift when the market backdrop, such as interest rates or inflation, changes. They can also break down during market stress. A relationship that held over one period may be weaker or reversed over another, so it is not a reliable rule.
You can explore how these markets behave on a demo account before trading with real money.
Risk warning: CFDs are complex instruments and come with a high risk of losing money rapidly due to leverage. Gold is a volatile instrument, and prices can move sharply against a position. Silver is a volatile instrument, and prices can move sharply against a position. Currency pairs can be volatile, and prices can move sharply against a position. Stock indices are volatile instruments, and prices can move sharply against a position. Cryptocurrencies are highly volatile instruments, and prices can move sharply against a position. You should consider whether you understand how CFDs work and whether you can afford to take the high risk of losing your money. This article is for informational purposes only and does not constitute investment advice or a recommendation to trade any instrument.
Availability of cryptocurrency CFDs varies by jurisdiction.








