






Key Points
- US rejection of Iran’s peace proposal and ongoing Houthi strikes on Saudi Arabia have reignited Middle East supply concerns.
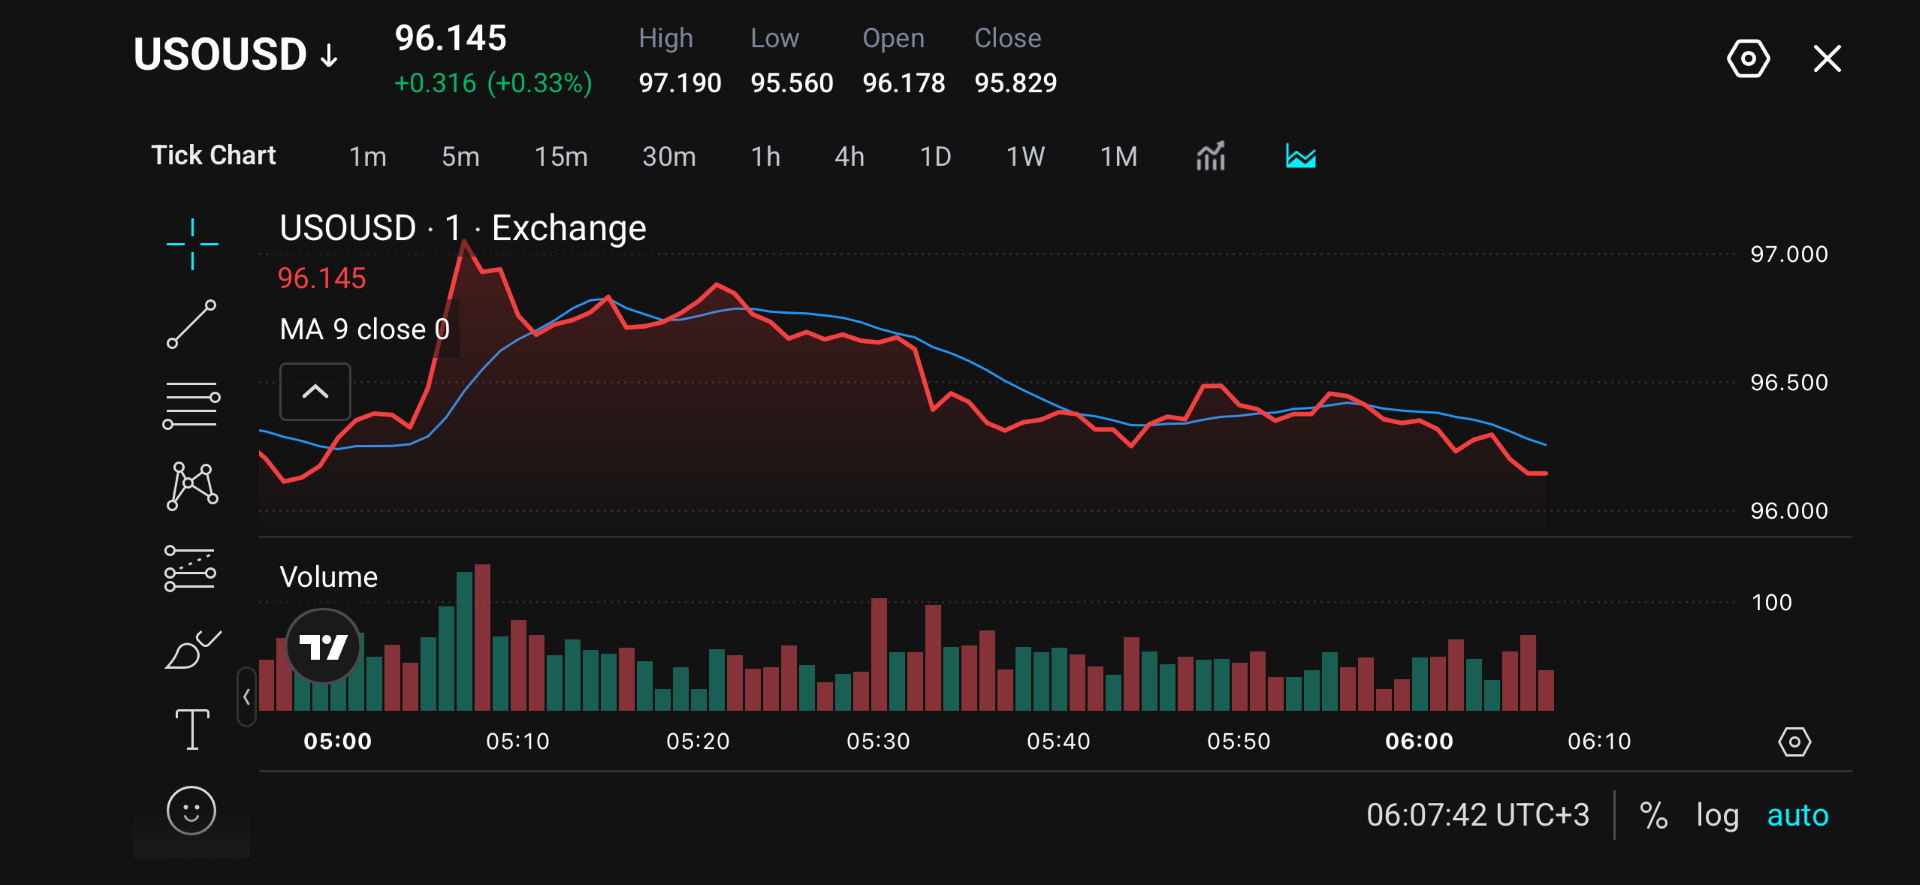
- USOUSD is experiencing short-term bullish momentum, hovering at 96.145, trading above its 9-period moving average at 96.000, after hitting a high of 97.190.
- Middle East exports surged to 12.8 million bpd in September as producers redirected shipments via the Strait of Hormuz.
- Discussion of potential US diesel export bans continues to fuel market volatility and global supply tightness concerns.
Market Move
Oil prices rebounded on Monday following a spike in geopolitical risk after US President Donald Trump rejected an Iranian peace deal aimed at resolving regional conflicts and reopening the Strait of Hormuz.
US West Texas Intermediate (WTI) gained 70 cents to reach $93.11 a barrel. Currently, it is trading near 96.145, holding firmly above its 9-period Moving Average near 96.000, which serves as dynamic support.
Why Traders Are Watching
Diplomatic stalemate and persistent regional security risks are likely to keep Middle East supply concerns elevated, leaving traders alert to further changes. Preliminary Kpler data shows crude exports from key Middle Eastern producers rebounded to 12.8 million barrels per day (bpd) in September as Saudi Arabia and the UAE increased shipments, while flows through the Strait of Hormuz recovered to around 7.4 million bpd.
However, regional exports remain well below pre-war levels, and continued missile, drone and tanker attacks leave supply routes vulnerable. Meanwhile, discussions over possible US restrictions on diesel exports have raised concerns about tighter European fuel supplies and renewed inflationary pressure, although US officials have pushed back against a blanket export ban.
Key Trading Levels
| Technical Level Type | Price / Range | Market Context & Analysis |
| Session High (Resistance) | 97.19 | Intraday peak and primary liquidity target for buyers. |
| Immediate Resistance Zone | 96.500 – 97.000 | Overhead consolidation region and supply cap. |
| Current Market Price | 96.145 | Trading +0.33% above the open with positive momentum. |
| Dynamic Support (MA 9) | 96 | 9-period Moving Average providing immediate trend support. |
| Session Low (Major Support) | 95.56 | Intraday baseline and critical demand floor. |
A breakout above the immediate resistance zone at 96.500 opens the path back toward the session high at 97.190. Conversely, losing the 96.000 support level would expose the market to a drop back down to the primary demand floor at 95.560.
Bullish and Bearish Setups
| Scenario | Entry Condition | Upside Target | Stop Loss | Strategy Context |
| Bullish Breakout | Break & close above 96.500 | 97.190 (High) / 98.000 | Below 96.000 | Momentum push on geopolitical risk updates. |
| Bearish Breakdown | Sustained move below 96.000 | 95.560 (Low) / 95.000 | Above 96.500 | Pullback triggered by US export policy headlines or profit-taking. |
The bullish scenario relies on buyers clearing the 96.500 resistance area to fuel a retest of the 97.190 high and potentially target 98.000.
On the flip side, the bearish scenario triggers if USOUSD breaks below the 96.000 moving average support, signaling a deeper pullback toward 95.560 and 95.000.
Disclaimer
The price levels and market scenarios above reflect the author’s assessment at the time of writing. They do not represent financial advice or an official recommendation from VT Markets. Traders should conduct their own analysis and manage risk carefully.
USOUSD Prediction: Key Drivers
Oil prices could face downward pressure if diplomatic progress reduces the geopolitical risk premium. A recovery in Middle East exports, higher US oil production, or the avoidance of US diesel export restrictions could further ease supply concerns and weigh on prices.
Conversely, USOUSD could gain if diplomatic talks break down, energy infrastructure comes under direct attack, or shipping disruptions persist. Any new US restrictions on refined product exports could tighten global fuel supplies, potentially providing further support to oil prices.
Beyond supply-side developments, broader oil sentiment will remain sensitive to movements in the US Dollar Index (DXY), global interest rate expectations, and macroeconomic indicators that influence industrial activity and energy demand.
Trade USOUSD with VT Markets
Oil prices can respond quickly to changes in global supply expectations, geopolitical developments, inventory data and shipping disruptions. These factors can influence price momentum and create periods of increased market volatility.
With VT Markets’ charting and market-analysis tools, traders can monitor price momentum, identify key support and resistance levels, and assess potential USOUSD setups.
Start trading energy CFDs with VT Markets.
Frequently Asked Questions
What is USOUSD?
USOUSD is the symbol used to trade spot or CFD contracts tracking the price of US West Texas Intermediate (WTI) crude oil against the US Dollar.
Why did oil prices rebound on Monday?
Oil prices rose over 1% after US President Donald Trump rejected an Iranian peace proposal, keeping geopolitical risk premiums high across Middle Eastern supply channels.
How do geopolitical tensions in the Middle East impact crude oil prices?
Conflicts in key production areas or shipping routes raise fears of supply disruptions, driving crude oil prices higher as market participants price in risk.
What is the significance of the Strait of Hormuz for oil traders?
The Strait of Hormuz is one of the world’s most critical maritime oil transit chokepoints. Any threat or disruption to tanker flows directly impacts global supply balances and triggers immediate price spikes.
What key technical levels should traders monitor on USOUSD?
Traders are closely watching 96.000 (dynamic MA 9 support), 96.500 (resistance boundary), 97.190 (session high), and 95.560 (session low support).
Start trading now — click here to create your real VT Markets account.








