






Semiconductor stocks are facing renewed pressure as investors reassess the strength of the AI-driven rally and recent gains across chipmakers. VanEck Semiconductor ETF (SMH) tracks a broad basket of semiconductor companies and remains a key gauge for whether the current pullback represents a normal consolidation phase or a deeper shift in sector sentiment.
Key Points
- SMH traded near 569.77, with semiconductor stocks under pressure as investors reassessed AI-related valuations and chip sector momentum.
- The semiconductor sector has seen renewed selling across several chip names, increasing focus on whether AI infrastructure demand can continue supporting earnings expectations.
- Traders are watching 590 resistance and 565 support, while the ETF remains between its 50-day moving average and Bollinger Band midpoint.
Why Worth Watching
SMH is closely watched as a broader measure of the semiconductor sector’s health because it provides exposure to major chip companies across AI infrastructure, memory, foundries and semiconductor equipment. The ETF’s performance often reflects investor confidence in the longer-term AI investment cycle.
The recent weakness comes as several semiconductor stocks have moved lower, prompting investors to reassess valuations after a strong AI-driven advance. While demand for AI infrastructure remains a major long-term theme, the market has become more selective as traders focus on whether large investments in chips, data centres and related infrastructure can continue translating into earnings growth.
The semiconductor sector also remains closely linked to broader technology sentiment. Chip demand expectations, AI spending plans from major technology companies, semiconductor supply trends and earnings outlooks remain key factors influencing investor positioning.
Key Trading Level
- At 611: Upper Bollinger Band and near-term breakout resistance
- At 590: 50-day moving average and medium-term trend recovery level
- At 565: Bollinger Band midpoint and immediate pivot
- At 550: Recent consolidation support
- At 519: Lower Bollinger Band and downside volatility boundary
- At 492: Recent swing low and major downside reference
For SMH, the immediate focus is whether the ETF can stabilise above its Bollinger Band midpoint and regain the 50-day moving average, which would suggest the recent pullback remains contained.
Technical Analysis
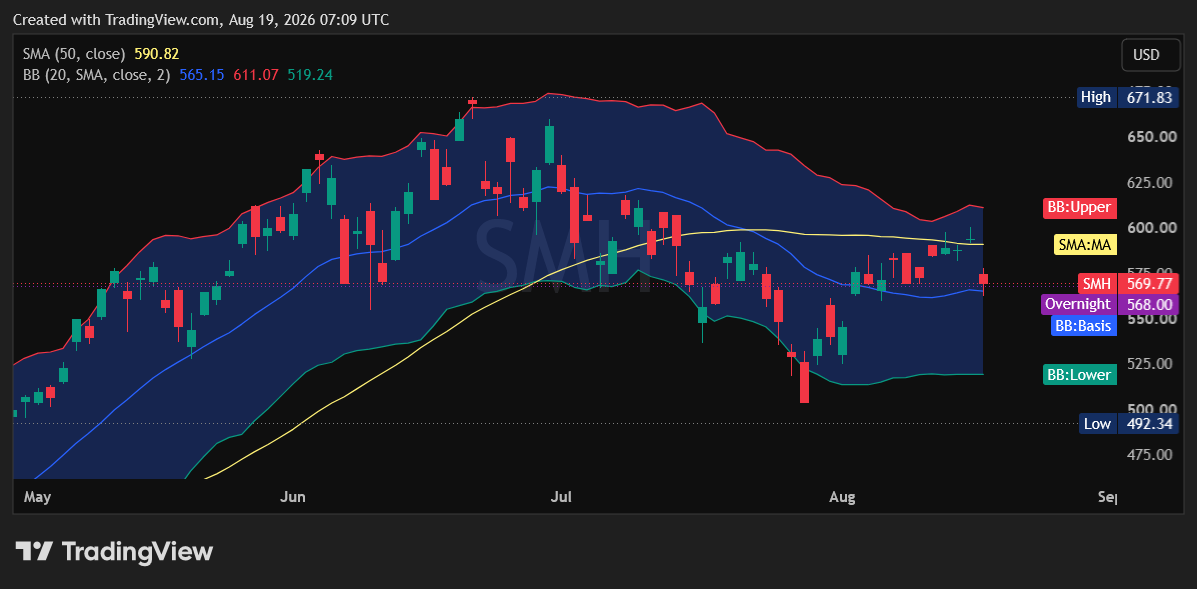
As of 19 August, SMH is trading near 569.77, following a pullback from its July highs after the ETF struggled to maintain momentum near the upper end of its recent range.
The ETF is currently positioned between two important technical references. The 50-day moving average sits at 590.82, while the Bollinger Band midpoint is at 565.15. This places the current price close to the middle of the recent volatility range, suggesting the sector is in a decision phase rather than at an extreme level.
The Bollinger Bands show an upper boundary near 611.07 and a lower boundary near 519.20. With price remaining well above the lower band, the current move reflects a sector pullback rather than a clear downside breakdown.
The immediate technical range sits between 565 support and 590 resistance.
A move above 590 would suggest buyers are regaining medium-term momentum and could bring 611 into focus. A break below 565 would weaken the short-term structure and expose the 550 support area, with 519 becoming the wider downside reference.
| Bullish Setup | Bearish Setup |
| The bullish scenario strengthens if SMH reclaims 590 and holds above the 50-day moving average. A sustained move above this level would suggest buyers are absorbing recent selling pressure and attempting to restore semiconductor sector momentum.A break above 611 would provide stronger confirmation and bring the previous high area near 672 back into focus. | The bearish scenario develops if SMH falls below 565 and loses the Bollinger Band midpoint. A move under this level would indicate that sellers are gaining control of the short-term trend.Further weakness below 550 could expose the lower Bollinger Band near 519, while a break below 492 would signal a deeper deterioration in the semiconductor sector structure. |
Disclaimer
The price levels and trade scenarios above reflect the author’s view at the time of writing and do not represent financial advice or an official recommendation from VT Markets. Traders should conduct their own analysis and manage risk carefully.
Market Drivers To Watch Next
Beyond the chart, traders are watching semiconductor earnings, AI infrastructure spending trends, chip demand expectations and broader technology sentiment. The next direction for VanEck Semiconductor ETF (SMH) may depend on whether investors view the current weakness as a valuation reset within the AI cycle or a broader reassessment of semiconductor growth expectations.
Trade SMH With VT Markets
The VanEck Semiconductor ETF CFD gives traders exposure to the price movements of the VanEck Semiconductor ETF without owning the underlying ETF.
Because SMH tracks a concentrated basket of semiconductor companies, it provides a broad view of AI, chip manufacturing and semiconductor equipment sentiment. It’s price movements are influenced by factors including AI investment trends, chip demand expectations, technology earnings and broader market conditions.
Explore ETFs CFD trading with VT Markets.
TL;DR
Why Is SMH Under Pressure?
SMH is under pressure as semiconductor stocks face renewed selling and investors reassess AI-related valuations, chip demand expectations and sector momentum.
What Is the Key Level to Watch for SMH?
The key levels are 590 resistance and 565 support. A move above 590 would improve the short-term outlook, while a break below 565 could increase downside pressure.
Can SMH Recover?
SMH could recover if buyers regain control above the 50-day moving average and push price toward the upper Bollinger Band near 611.
Can I Trade SMH With VT Markets?
Yes. VT Markets offers SMH CFDs, allowing traders to gain exposure to semiconductor ETF price movements without owning the underlying ETF.
Start trading now — click here to create your real VT Markets account.








