





Oil market signals are data points that reveal changes in future supply, demand and price expectations for crude oil. Unlike headlines that describe events after they happen, oil market signals help traders understand what the market is anticipating by analysing factors such as OPEC+ decisions, inventory data, the futures curve, the US dollar and global demand conditions. This guide explains how to identify and interpret key oil market signals, why crude oil prices can react differently from news headlines, how supply and demand factors influence Brent crude oil, how to read futures curve movements such as contango and backwardation, and how traders can build a structured oil analysis routine using platforms such as MetaTrader 4 and MetaTrader 5.
Key Takeaways:
- Prices move on expectations, not headlines. Signals hint at what happens next; headlines just report what already happened.
- OPEC+ cuts rarely deliver in full. The market prices in shortfalls early, so actual surprises are often much smaller than the announced figure.
- Inventory reports trade on the surprise, not the number. A smaller than expected draw can still send prices lower.
- The futures curve leads the news. Contango and backwardation often shift before inventory data catches up.
- A routine beats reacting. Structured charts and volatility-based position sizing keep risk steady, whatever the headlines say.
Oil headlines travel faster than oil barrels. A single line about a production cut, a refinery outage or a shipping disruption can dominate a news cycle for days. Yet the price often moves before the headline lands, or refuses to move at all once it does.
That gap between the story and the chart is where most retail traders lose money. The reason is simple. Headlines report events, while prices respond to oil market signals, and the two are not the same.
This guide explains oil market signals, from leading and lagging indicators to supply, demand, and Brent crude price drivers. It also covers the futures curve and how to track these signals on MT4 and MT5.
What Oil Market Signals Actually Are
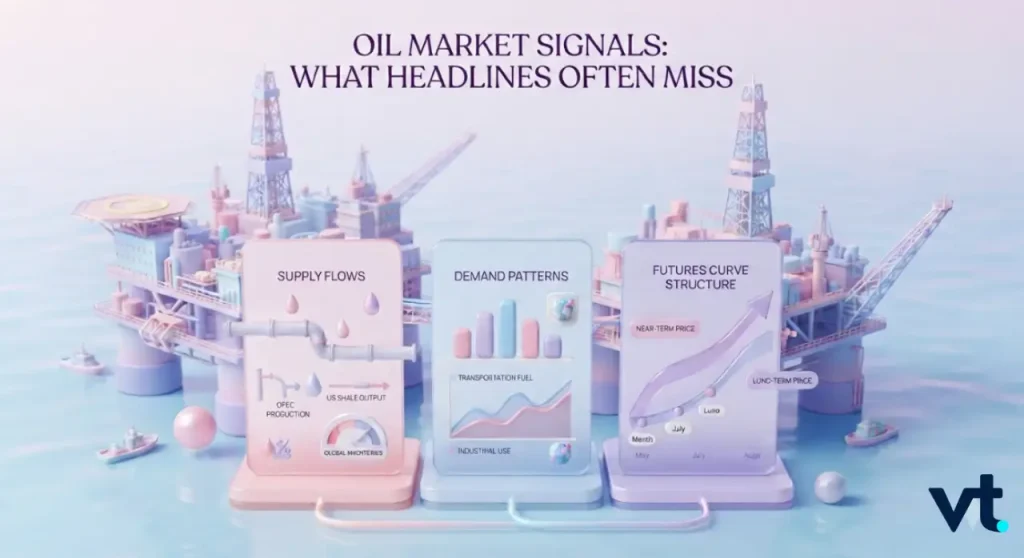
An oil market signal is any piece of data that changes the market’s expectation of future supply or demand. Headlines describe what has happened. Signals hint at what happens next. The distinction matters because oil is priced on expectations, not on today’s barrels.
Most confusion comes from treating every data release as equally important. It is not. Some signals arrive early and shape the trend. Others confirm a move that has already played out.
Leading And Lagging Oil Market Signals
Leading indicators tend to move ahead of price. Lagging indicators confirm what has already occurred. Both have a place, but only if you know which is which.
| Signal type | Examples | What it tells you |
| Leading | Rig counts, futures curve shape, refinery margins, freight rates | Where supply and demand are heading |
| Coincident | Weekly inventory data, refinery utilisation | Where the balance sits right now |
| Lagging | Monthly production statistics, quarterly earnings | Confirmation of a completed move |
A common mistake is building a whole trading idea on lagging data. By the time monthly production figures are published, the market has usually priced them in.
Fundamental And Technical Crude Oil Market Signals
Crude oil market signals fall into two broad families, and experienced traders read both.
- Fundamental signals cover physical supply and demand:OPEC+ production decisions, EIA inventory data, refinery runs, and global consumption trends.
- Technical signals cover price behaviour: trend structure, volume, volatility ranges, and momentum.
- Positioning signals cover what traders themselves are doing, such as open interest and the balance of speculative versus commercial positions.
Fundamentals explain why a move should happen. Technicals show whether it is actually happening. Positioning shows how crowded the idea already is. Relying on one family without the others is how traders end up right in the story and wrong in the trade.
A supply disruption may justify higher prices. However, if positioning is already heavily long, the upside can be limited. The story and the setup need to agree before the trade earns its risk.
Supply-Side Oil Market Signals The Headlines Compress
Supply headlines are the most misread category in crude oil trading. A cut announcement sounds decisive. The barrels behind it rarely are.
OPEC+ Announcements Versus Actual Barrels
An announced quota is a target, not a delivery. Compliance across member states varies, and the market prices the expected shortfall almost immediately.
Here is an illustrative example: Suppose a group announces a headline cut of 1.5 million barrels per day. Traders then assess how much is likely to be delivered.
| Component | Illustrative figure |
| Announced cut | 1,500,000 bpd |
| Expected compliance | 70% |
| Expected actual cut | 1,050,000 bpd |
| Already priced in beforehand | 900,000 bpd |
| Genuine surprise | 150,000 bpd |
In this illustration, the headline says 1.5 million. The tradable surprise is roughly a tenth of that. This is why prices sometimes fall on a cut announcement. The market had already expected more than was delivered.
Inventory Reports And The Forecast Gap
Weekly inventory data moves markets because it is timely and scheduled. However, the level itself is not the signal. The gap against consensus is:
- A draw that is smaller than forecast can be bearish, even though stocks fell.
- A build that is smaller than forecast can be bullish, even though stocks rose.
- Revisions to the previous week can matter as much as the current print.
- Product stocks such as petrol and distillates often carry more information than crude stocks alone.
For illustration:
If the market expects a draw of 3 million barrels and the report shows a draw of 1 million, that is a 2 million barrel bearish surprise. The direction was right. The magnitude was wrong, and the magnitude is what trades.
Demand Signals Behind The Brent Crude Oil Price
Demand signals are quieter than supply headlines. They also tend to set the longer trend. The Brent crude oil price functions as the global benchmark, so it reacts strongly to worldwide demand conditions rather than purely regional ones.
The Dollar Link Most Headlines Skip
Oil is priced in US dollars. When the dollar strengthens, oil becomes more expensive for buyers using other currencies, which can dampen demand. The relationship is not mechanical. Nevertheless, it is persistent enough to be worth monitoring.
A simplified illustration makes the point. Assume oil trades at USD 80 per barrel:
- With EUR/USD at 1.10, the cost is roughly EUR 72.7 per barrel.
- With EUR/USD at 1.00, the same barrel costs EUR 80.0.
- That is a 10% price rise for the European buyer with no change in the dollar price at all.
Headlines report the dollar price. Buyers experience the local price. That difference feeds through to real demand over time.
Risk Premiums And Why They Fade
Geopolitical events add a risk premium to price. That premium reflects the probability of disrupted flows, not the disruption itself:
- If physical barrels keep moving, the premium usually decays within days or weeks.
- If flows are genuinely interrupted, the premium converts into a durable repricing.
- Freight and insurance rates often confirm which of the two is happening.
Watching tanker rates alongside the headline gives a far clearer read than the headline alone. The pattern repeats often enough to be worth noting.
Price spikes on the announcement, drifts sideways while traders wait for confirmation. Then, either holds or unwinds depending on whether physical flows changed. Treating the first candle as the whole story is one of the more expensive habits in energy trading.
Reading The Oil Futures Curve
The futures curve is the single most useful signal that mainstream coverage tends to omit. It shows what the market believes about supply and demand across time.
Contango And Backwardation In Plain Terms
| Curve shape | Structure | Typical implication |
| Contango | Futures priced above spot | Comfortable or oversupplied market |
| Backwardation | Futures priced below spot | Tight near-term supply |
A steepening contango often points to building stockpiles. A deepening backwardation often points to buyers competing for immediate barrels. Crucially, the curve can shift before inventory data confirms it, which makes it a genuine leading signal.
The Brent-WTI Spread
The spread between the two benchmarks reflects regional imbalances rather than global ones:
- A widening spread often signals US supply building faster than it can be exported.
- A narrowing spread often signals stronger US demand or export pull.
- Pipeline and export bottlenecks can distort the spread independently of global fundamentals.
For oil CFD trading, the spread is useful as context even when you only trade one instrument.
Building An Oil Market Signals Routine On MT4 And MT5
Signals are only useful if you can see them consistently. This is where platform setup does real work. Traders often ask what are the best indicators for oil trading. Well, the forthright answer is that no single indicator carries the load. A structured workspace beats any one tool.
A Practical Chart And Workspace Setup
- Run a three-timeframe layout: daily for trend, four-hour for structure, one-hour for entries.
- Add Average True Range to measure oil price volatility rather than guessing at stop distance.
- Overlay a moving average pair for trend context, not for entry signals on their own.
- Keep a second chart of the US Dollar Index open beside your oil chart.
- Use the economic calendar to mark inventory releases and OPEC+ meetings in advance.
- Save the whole arrangement as a template so it loads identically every session.
MetaTrader 5 adds depth of market and a wider set of timeframes. This suits traders who want more granularity. MetaTrader 4 remains lighter and faster for straightforward setups.
Both are available through VT Markets, so the choice comes down to how you prefer to work rather than what you can access.
Pro tip: Build the template on a demo account first. Load it, trade it for two full weeks, then remove anything you never actually looked at. Most traders start with eight indicators and finish with three. A VT Markets demo account lets you run that pruning exercise in live conditions without putting capital at risk.
Sizing Positions Around Scheduled Data
Volatility around scheduled releases is normal and predictable in timing, if not direction. Position size should reflect that.
An illustrative calculation, assuming one lot equals 100 barrels:
- Account balance: USD 10,000
- Risk per trade: 1%, or USD 100
- Stop distance: USD 1.50 per barrel
- Value per barrel per lot: USD 100 per USD 1.00 move
- Position size: 100 ÷ (1.50 × 100) = 0.67 lots
If you widen the stop to USD 3.00 ahead of an inventory release, the same 1% risk supports roughly 0.33 lots. The risk stays fixed. The size adapts to conditions. That is the discipline that keeps traders in the market long enough for their read on oil market signals to pay off.
Frequently Asked Questions
What Are The Most Reliable Oil Market Signals To Watch
No single signal is reliable on its own. Most traders track a combination: weekly inventory data, OPEC+ production decisions, the shape of the futures curve, and the US dollar. The value comes from agreement between them. When three or four point the same way, the read is far stronger than any one of them in isolation.
What Is The Difference Between Contango And Backwardation
Contango is when futures prices sit above the current spot price, which usually points to a comfortable or oversupplied market. Backwardation is the reverse, with futures trading below spot, which usually points to tight near-term supply. The shift between the two states often matters more than the state itself.
Why Do Inventory Reports Cause Such Sharp Price Moves
Because they are scheduled, timely and closely forecast. Traders position ahead of the release based on consensus expectations. When the actual number differs from that consensus, positions are adjusted quickly and in volume. The move reflects the surprise, not the inventory level itself.
How Does The US Dollar Affect Oil Prices
Oil is priced in US dollars worldwide. A stronger dollar makes each barrel more expensive for buyers using other currencies, which can soften demand over time. A weaker dollar tends to have the opposite effect. The relationship is a tendency rather than a rule, so it is best used as context alongside supply and demand data.
Can I Trade Oil On MetaTrader 4 And MetaTrader 5
Yes. Both platforms support oil instruments through a broker that offers energy markets, including VT Markets. MetaTrader 5 gives you more timeframes and depth of market data. MetaTrader 4 is lighter and familiar to most traders. Either will run the three-timeframe workspace described above.
Turning Oil Market Signals Into Consistent Practice
Headlines will always arrive first and explain least. The traders who do well with energy markets are the ones who treat news as a prompt to check their data, not as a trade instruction.
Read the curve. Compare data against forecasts, not against zero. Watch the dollar. Size positions to volatility rather than to conviction. Done consistently, that process turns oil market signals from background noise into a repeatable edge.
Start by setting the three-timeframe layout, mark the next inventory release in your calendar, and run your position sizing on paper before you commit capital. Keep the log going for a full quarter. The VT Markets education library and market analysis can fill the gaps while you build that habit.
Open a live or demo account with VT Markets. Put your oil market signals routine into practice on MetaTrader 4 and MetaTrader 5, with the charting tools and market access to trade energy markets on your terms.








