





Key Takeaways
- The VT Markets app allows traders to access global markets, manage accounts, analyse charts, and monitor trading opportunities from one platform.
- Key app features include watchlists, demo and live account access, one-tap trading, TradingView charts, technical indicators, market analysis tools, and security settings.
- Traders can use the app to review price movements, follow economic events, set alerts, and manage trading activity more efficiently.
- Built-in tools such as the Economic Calendar and Trading Central analysis can support market research and trade preparation.
- Security features such as two-factor authentication help add another layer of protection to account access.
- Beginners can practise with a demo account before moving to live trading, while more experienced traders can use advanced charting and analysis tools to support their strategies.
The VT Markets app is designed to help traders access the markets, manage their accounts, and use trading tools from one mobile platform. Whether you are checking price movements, reviewing charts, following economic events, or managing account settings, the app provides a practical way to stay connected to the markets.
This guide will explain the main features and tools available in the VT Markets app and how traders can use them.
Main Features and Tools in the VT Markets App
The VT Markets app includes features for market access, chart analysis, trade execution, account management, and account security.
The table below shows some of the key tools available in the app.
| Feature or Tool | What It Helps Traders Do |
| Watchlist | Save and monitor preferred instruments |
| Demo Account | Practise trading with virtual funds |
| Live Account Access | Access real markets after account approval and funding |
| Multi-Timeframe Charts | Review price movement across different time intervals |
| One-Tap Trading | Place trades more quickly when enabled |
| TradingView Charts | Use advanced charting and drawing tools |
| Economic Calendar | Track upcoming market events |
| Trading Central Analysis | Access third-party market insights |
| Technical Indicators | Analyse trends, momentum, and volatility |
| Account Management | Manage profile, deposits, withdrawals, and settings |
| Two-Factor Authentication | Add another layer of account security |
Watchlist
A watchlist allows traders to save selected markets and monitor them in one place. Instead of searching through the full list of instruments each time, traders can create a focused list of the assets they follow most often.
This can be useful for forex pairs, commodities, indices, shares, ETFs, bonds, and crypto CFDs. Beginners may start with a small list of familiar markets, while more experienced traders may organise different watchlists by asset class, strategy, or trading session.
For example, a trader may create one watchlist for major forex pairs, another for gold and oil, and another for stock CFDs.
How to Use the Watchlist on the VT Markets App
1. Open the VT Markets app.
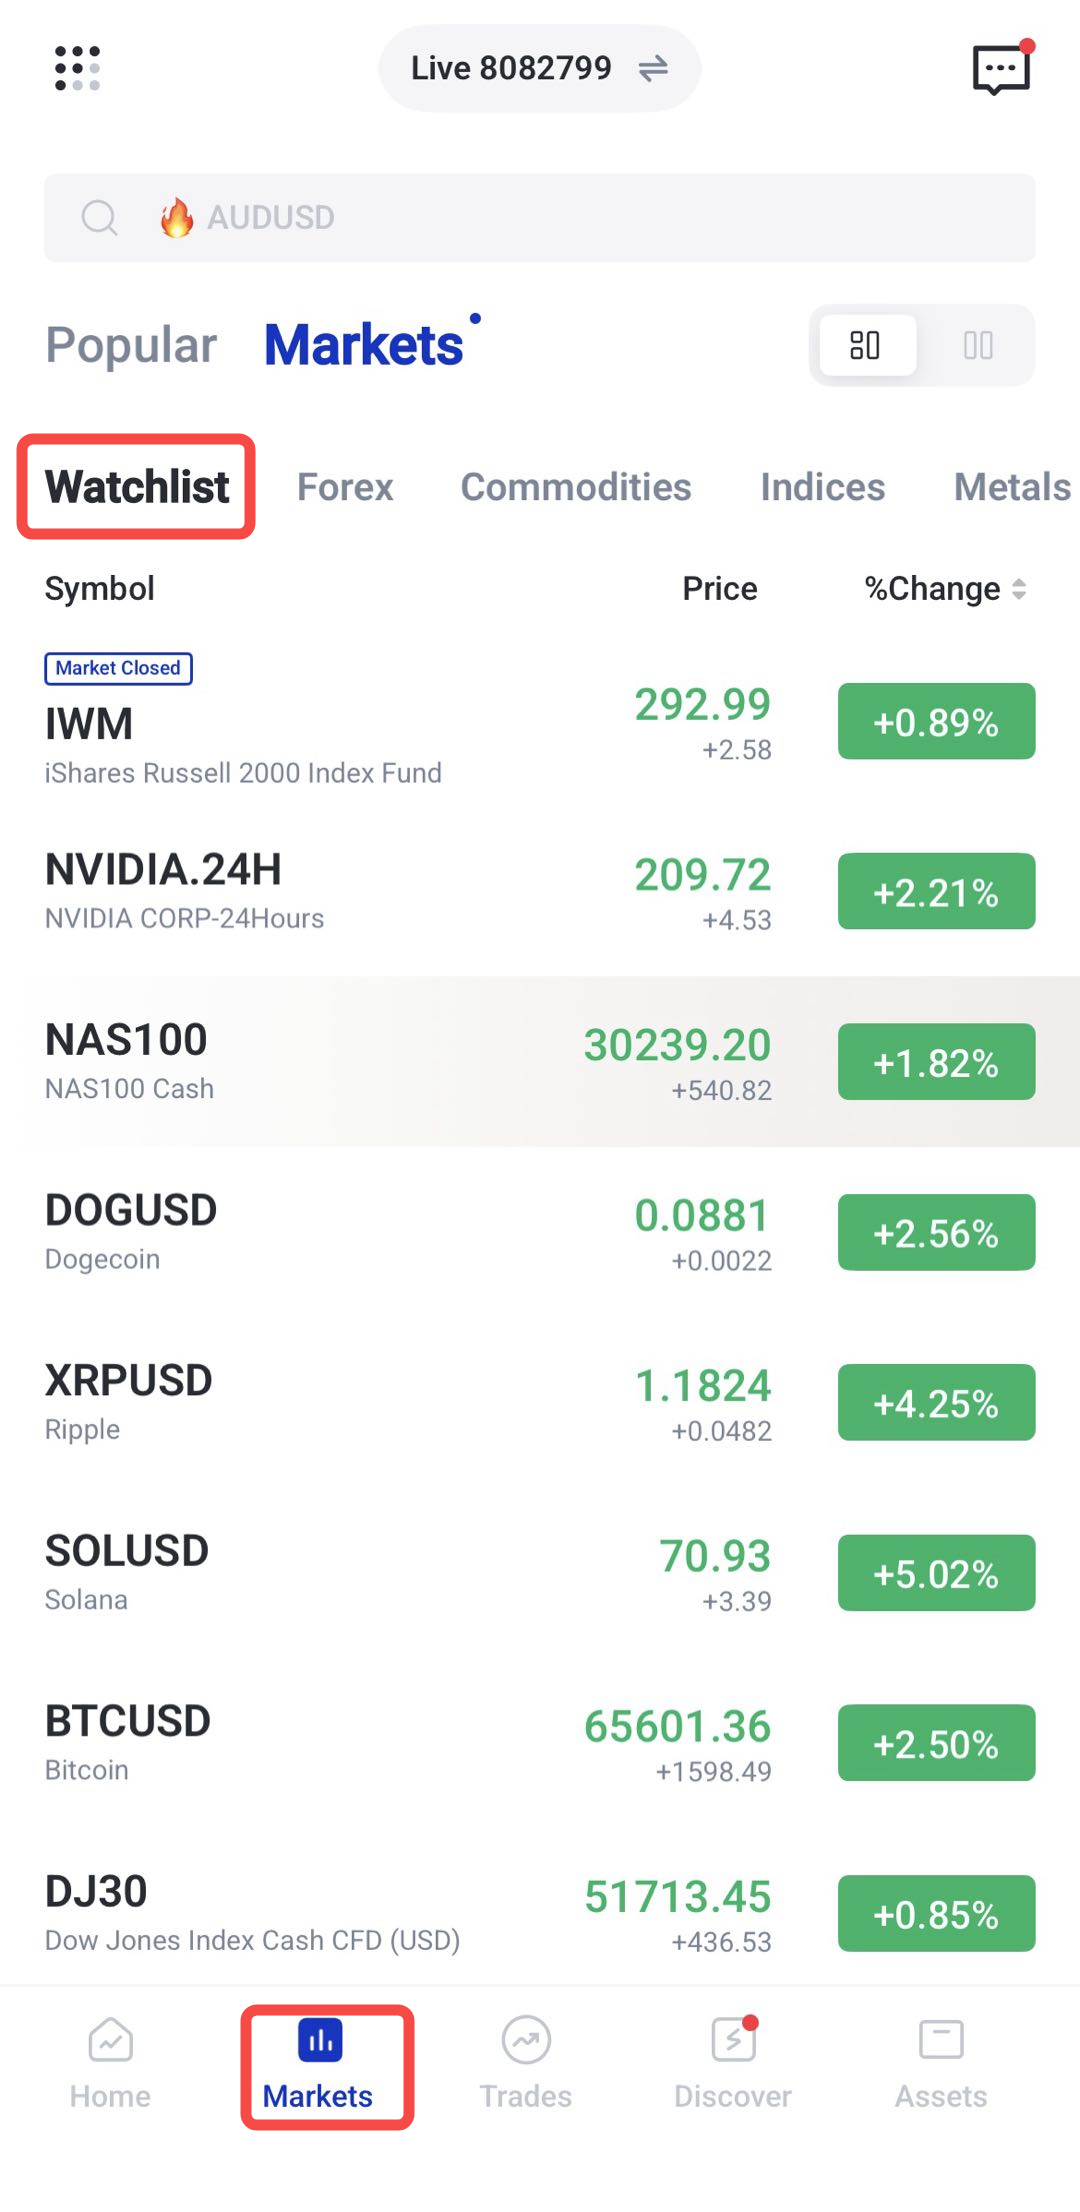
2. Go to the Markets section.
3. Select the Watchlist tab.
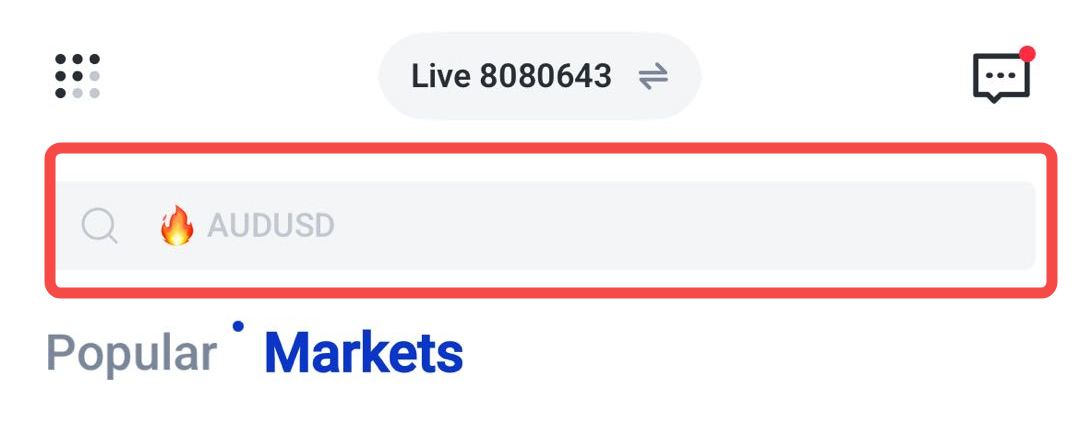
4. Search for the instrument you want to follow.
5. Tap the star icon to add the instrument to your watchlist.
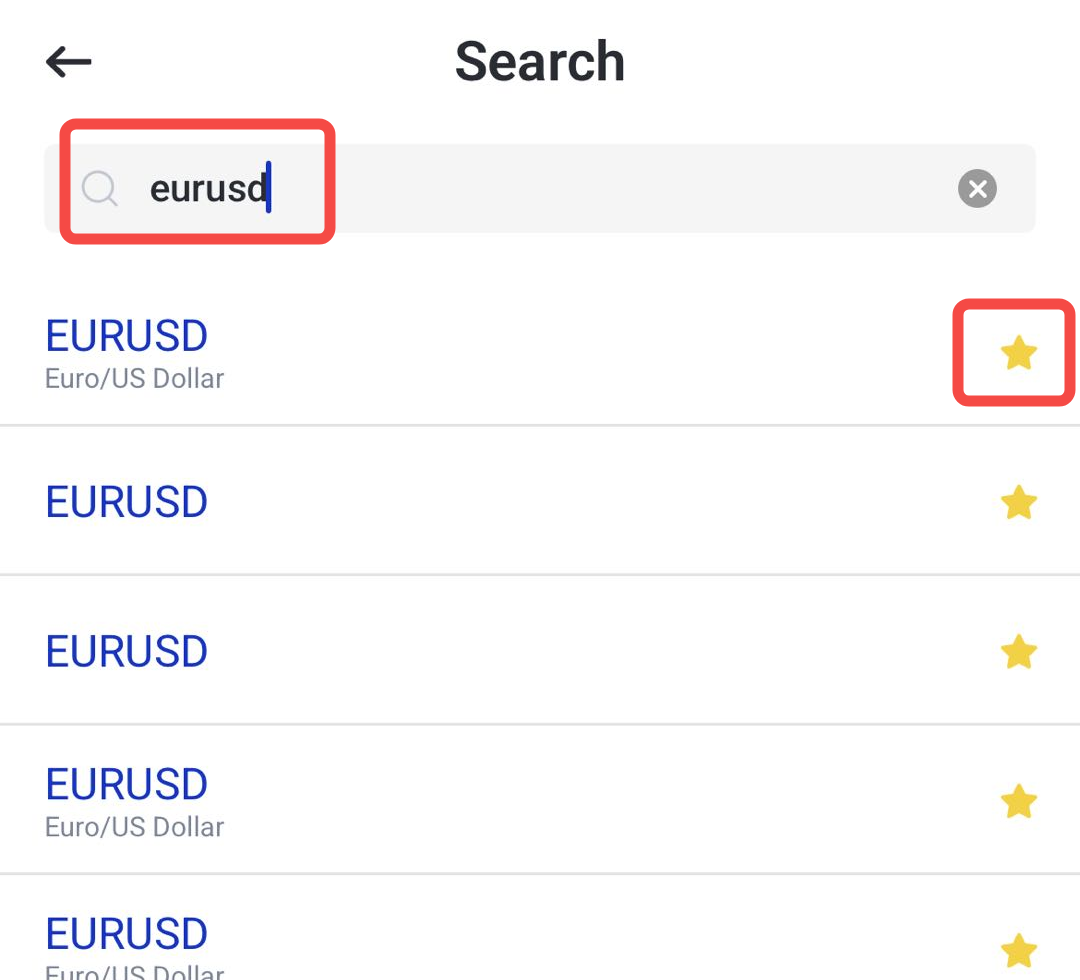
6. Repeat the process for other markets you want to monitor.
7. Rearrange your watchlist or remove instruments when needed.
8. Set price alerts if you want to be notified when a market reaches a specific level.
Demo Account
A demo account allows traders to practise trading with virtual funds. It can be used to explore the VT Markets app, test order placement, review charts, and practise strategies without using real capital.
This is useful for beginners who want to understand how trading works before using a live account. It can also help experienced traders test new approaches in a lower-risk environment.
How to Use a Demo Account on the VT Markets App
1. Open the VT Markets app.
2. Log in to your account or register if you are a new user.
3. Select or switch to a Demo Account.
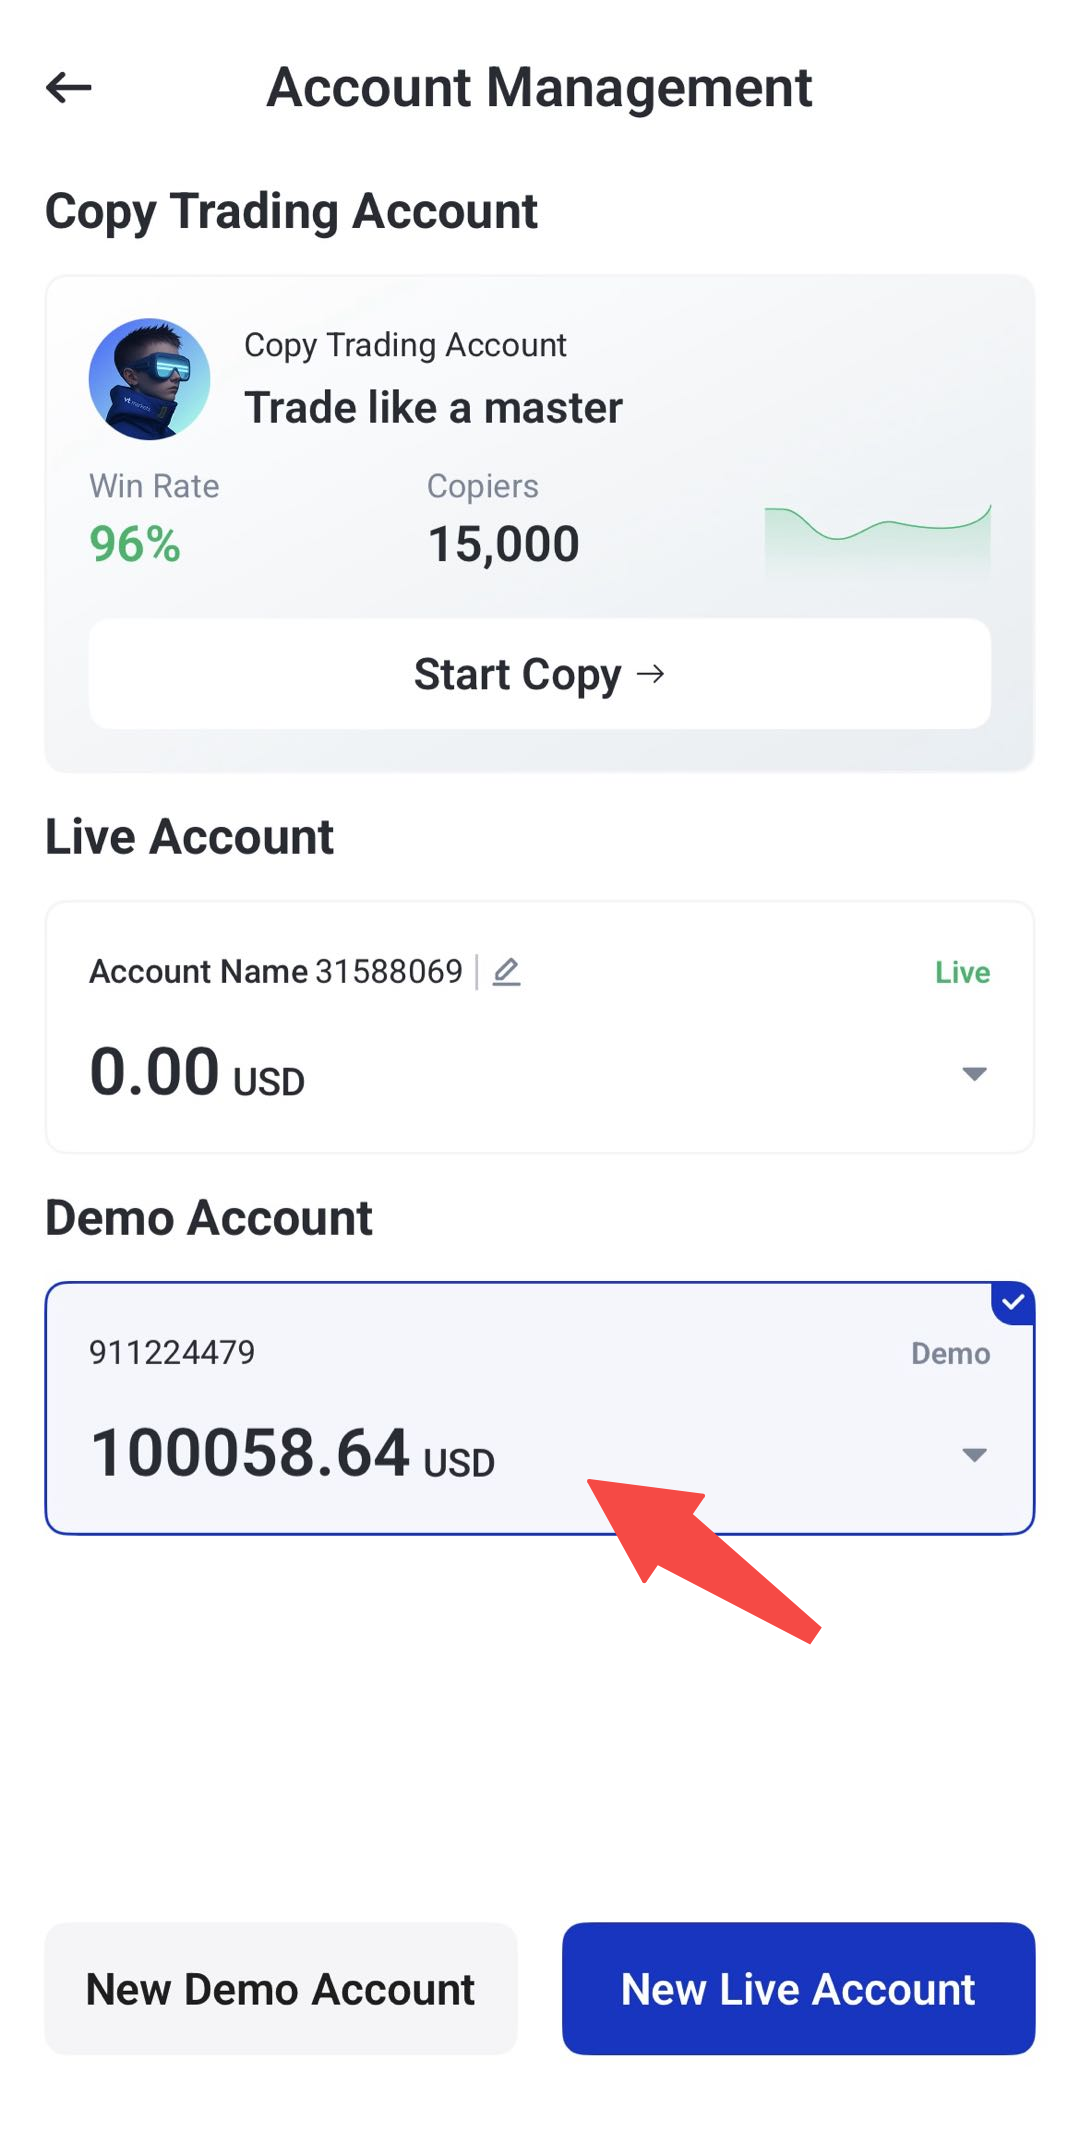
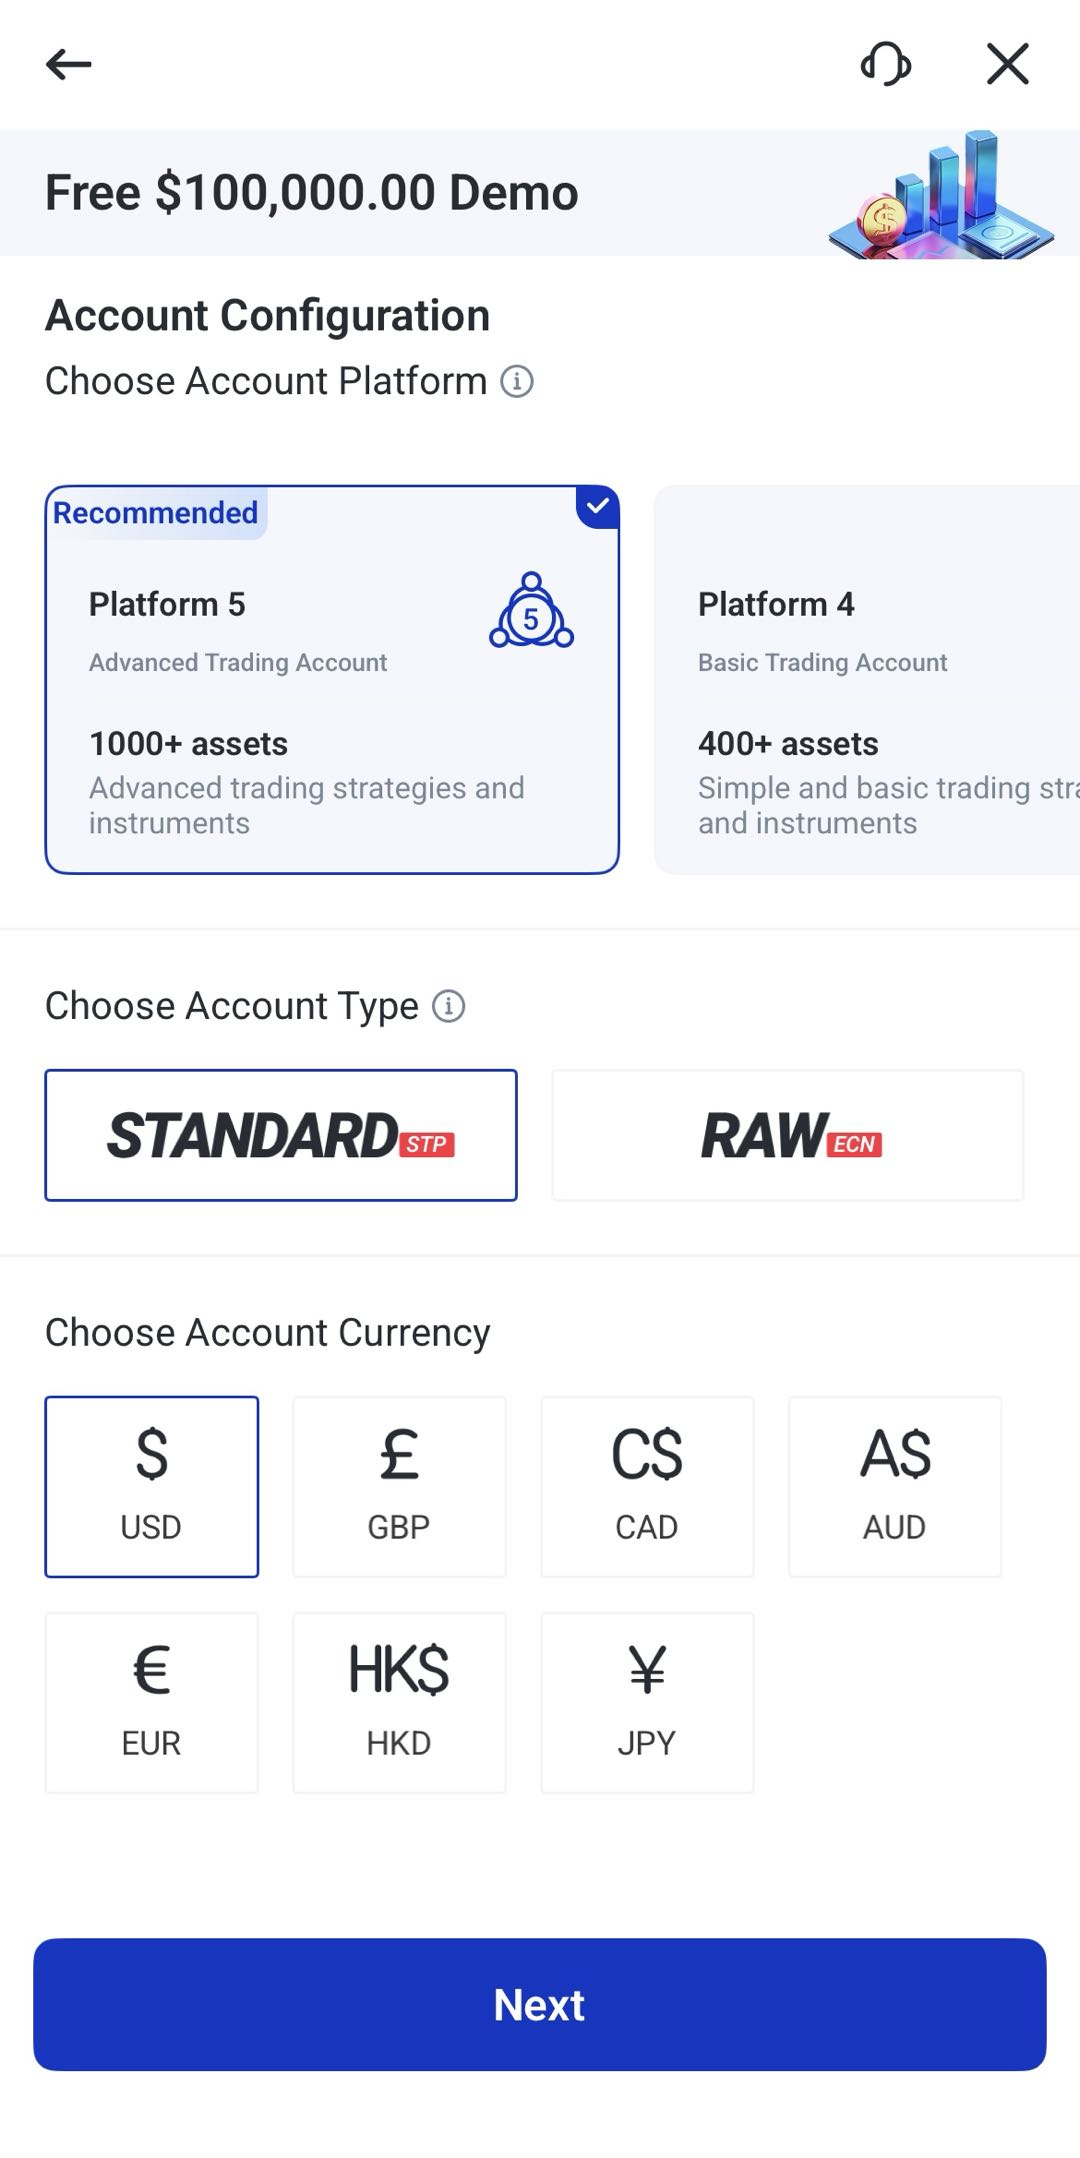
4. Select platform, account types and currencies you want in your demo account, then click next
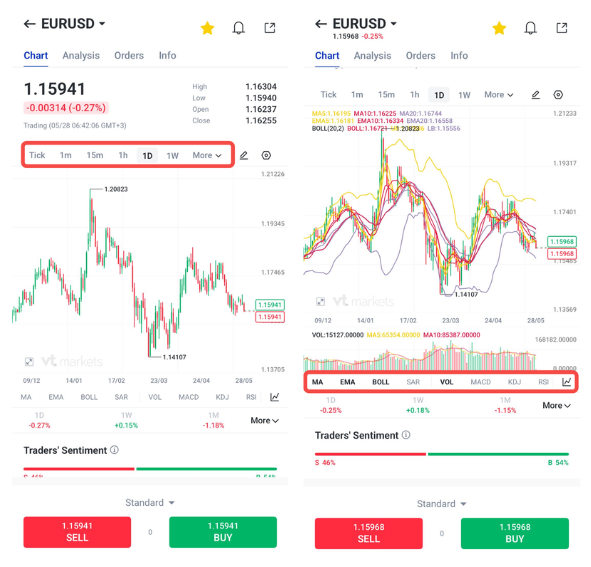
5. Open the chart or trading screen.
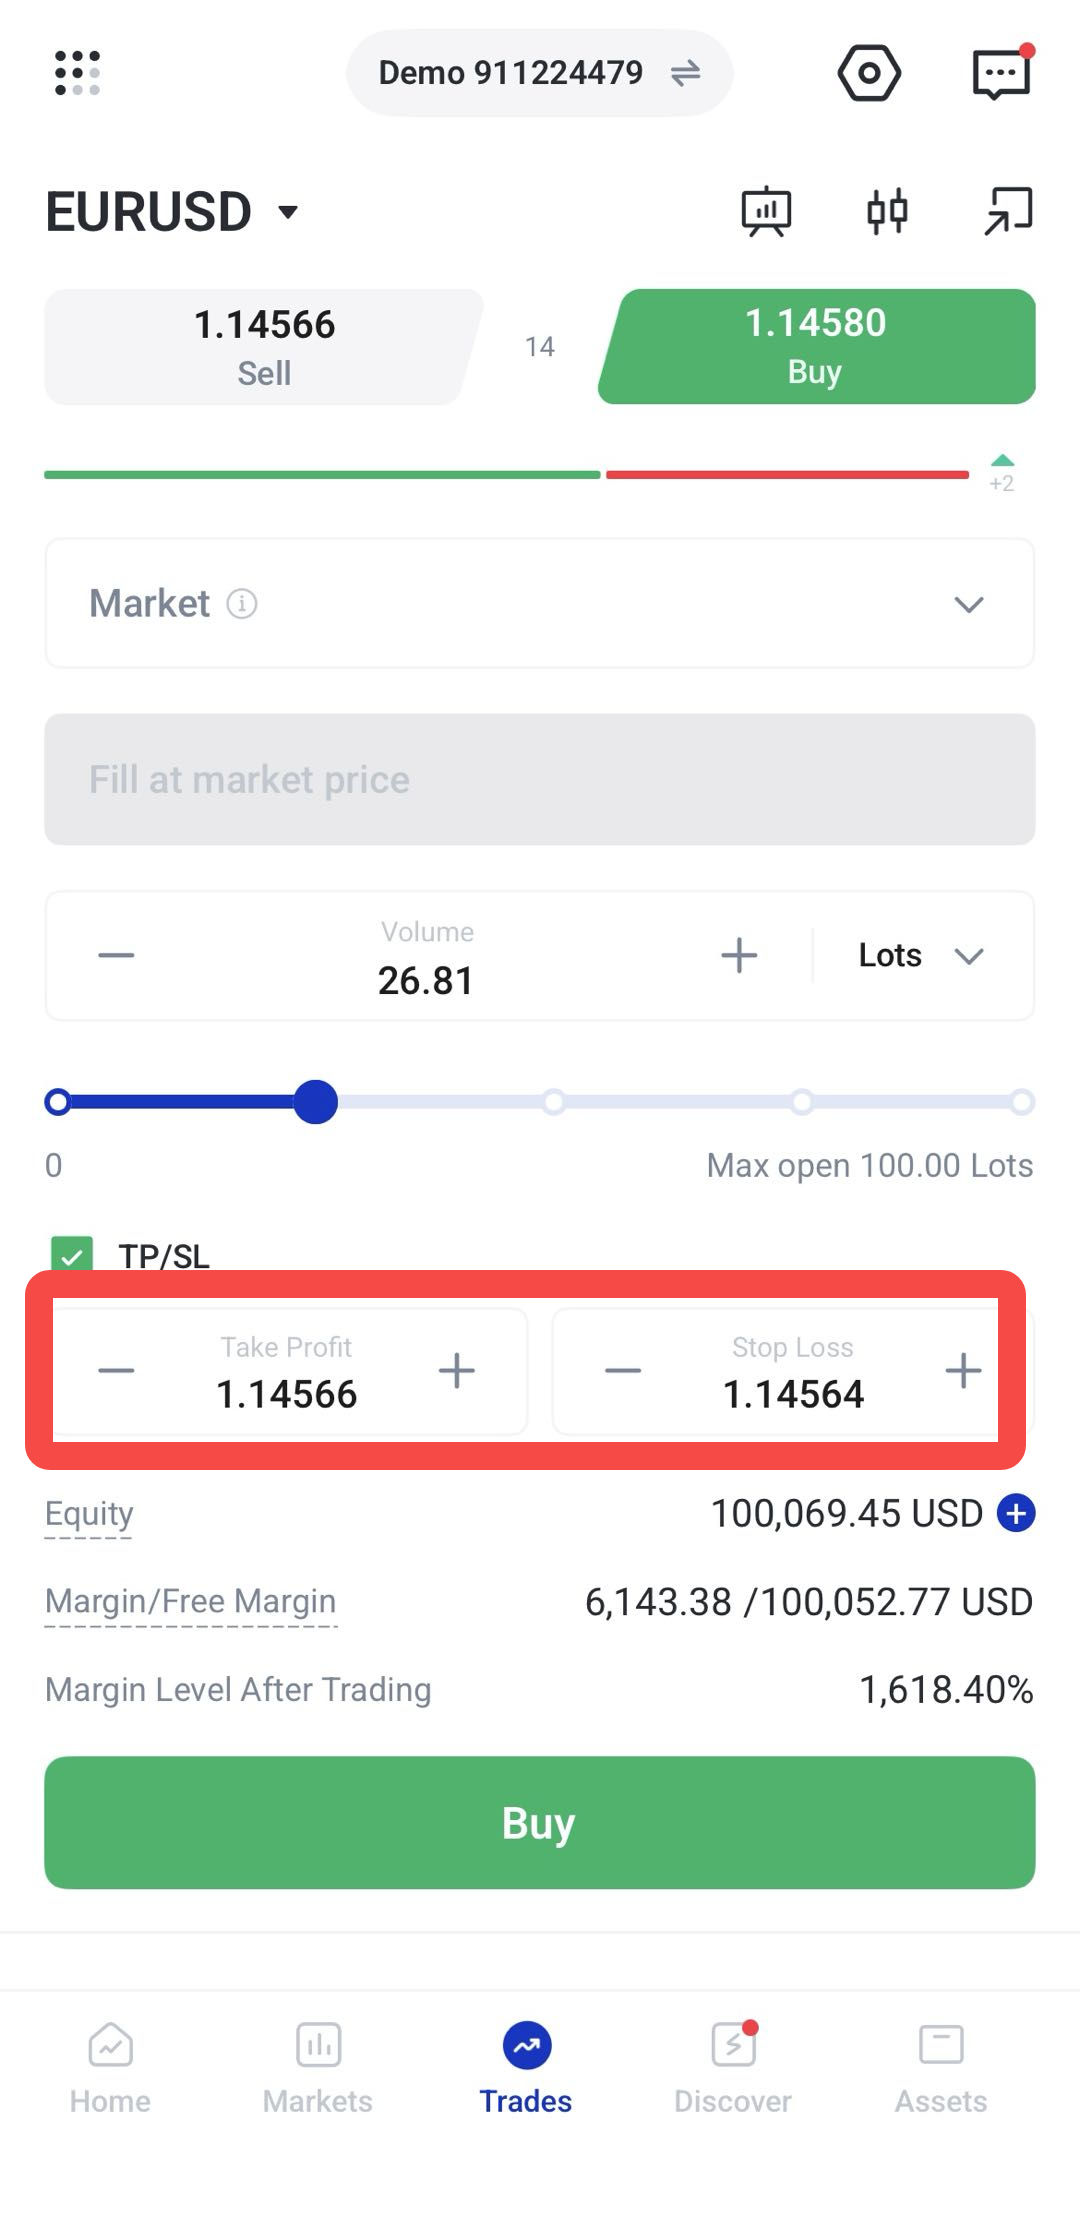
6. Set your order details, such as trade size, stop loss, and take profit.
7. Place a demo trade to buy or sell using virtual funds.
8. Monitor the position and practise closing or adjusting trades.
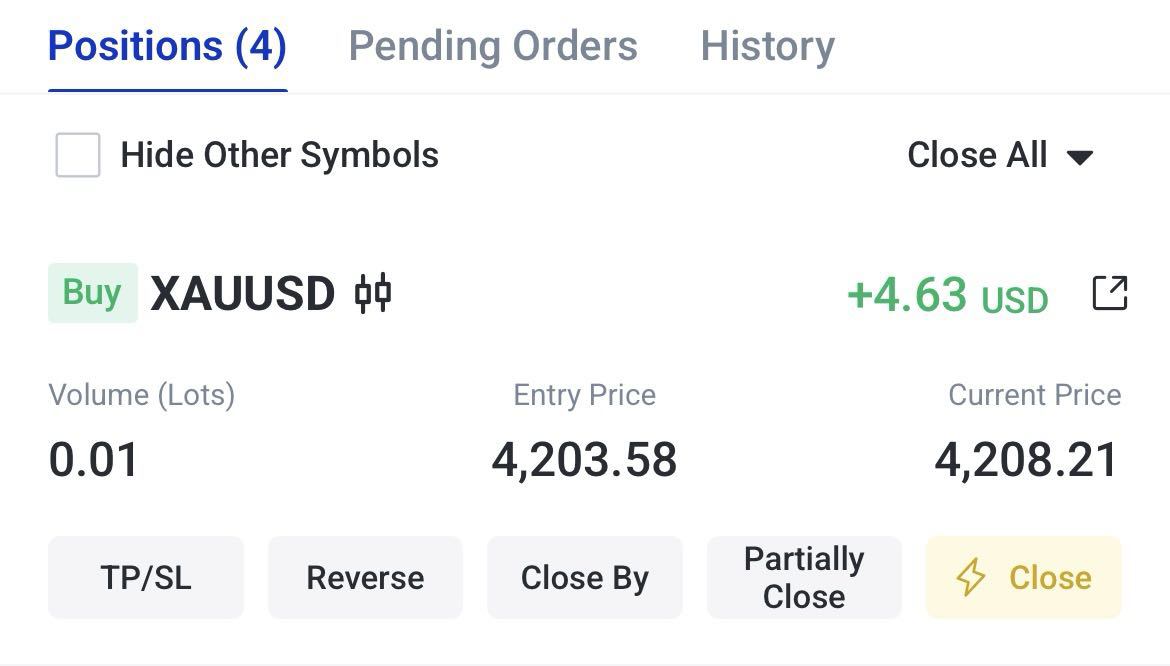
9. Review your demo trading activity to understand how the platform works.
Multi-Timeframe Analysis
Markets can look different depending on the timeframe being viewed. A short-term chart may show recent price movement, while a longer-term chart may show the broader trend.
Multi-timeframe analysis helps traders compare different chart intervals before making a trading decision. For example, a trader may review the daily chart to understand the wider trend, then use a shorter timeframe to look for possible entry or exit areas.
How to Use Multi-Timeframe Analysis on the VT Markets App
1. Open the VT Markets app.
2. Select the instrument you want to analyse.
3. Open the chart screen.
4. Tap the timeframe menu.
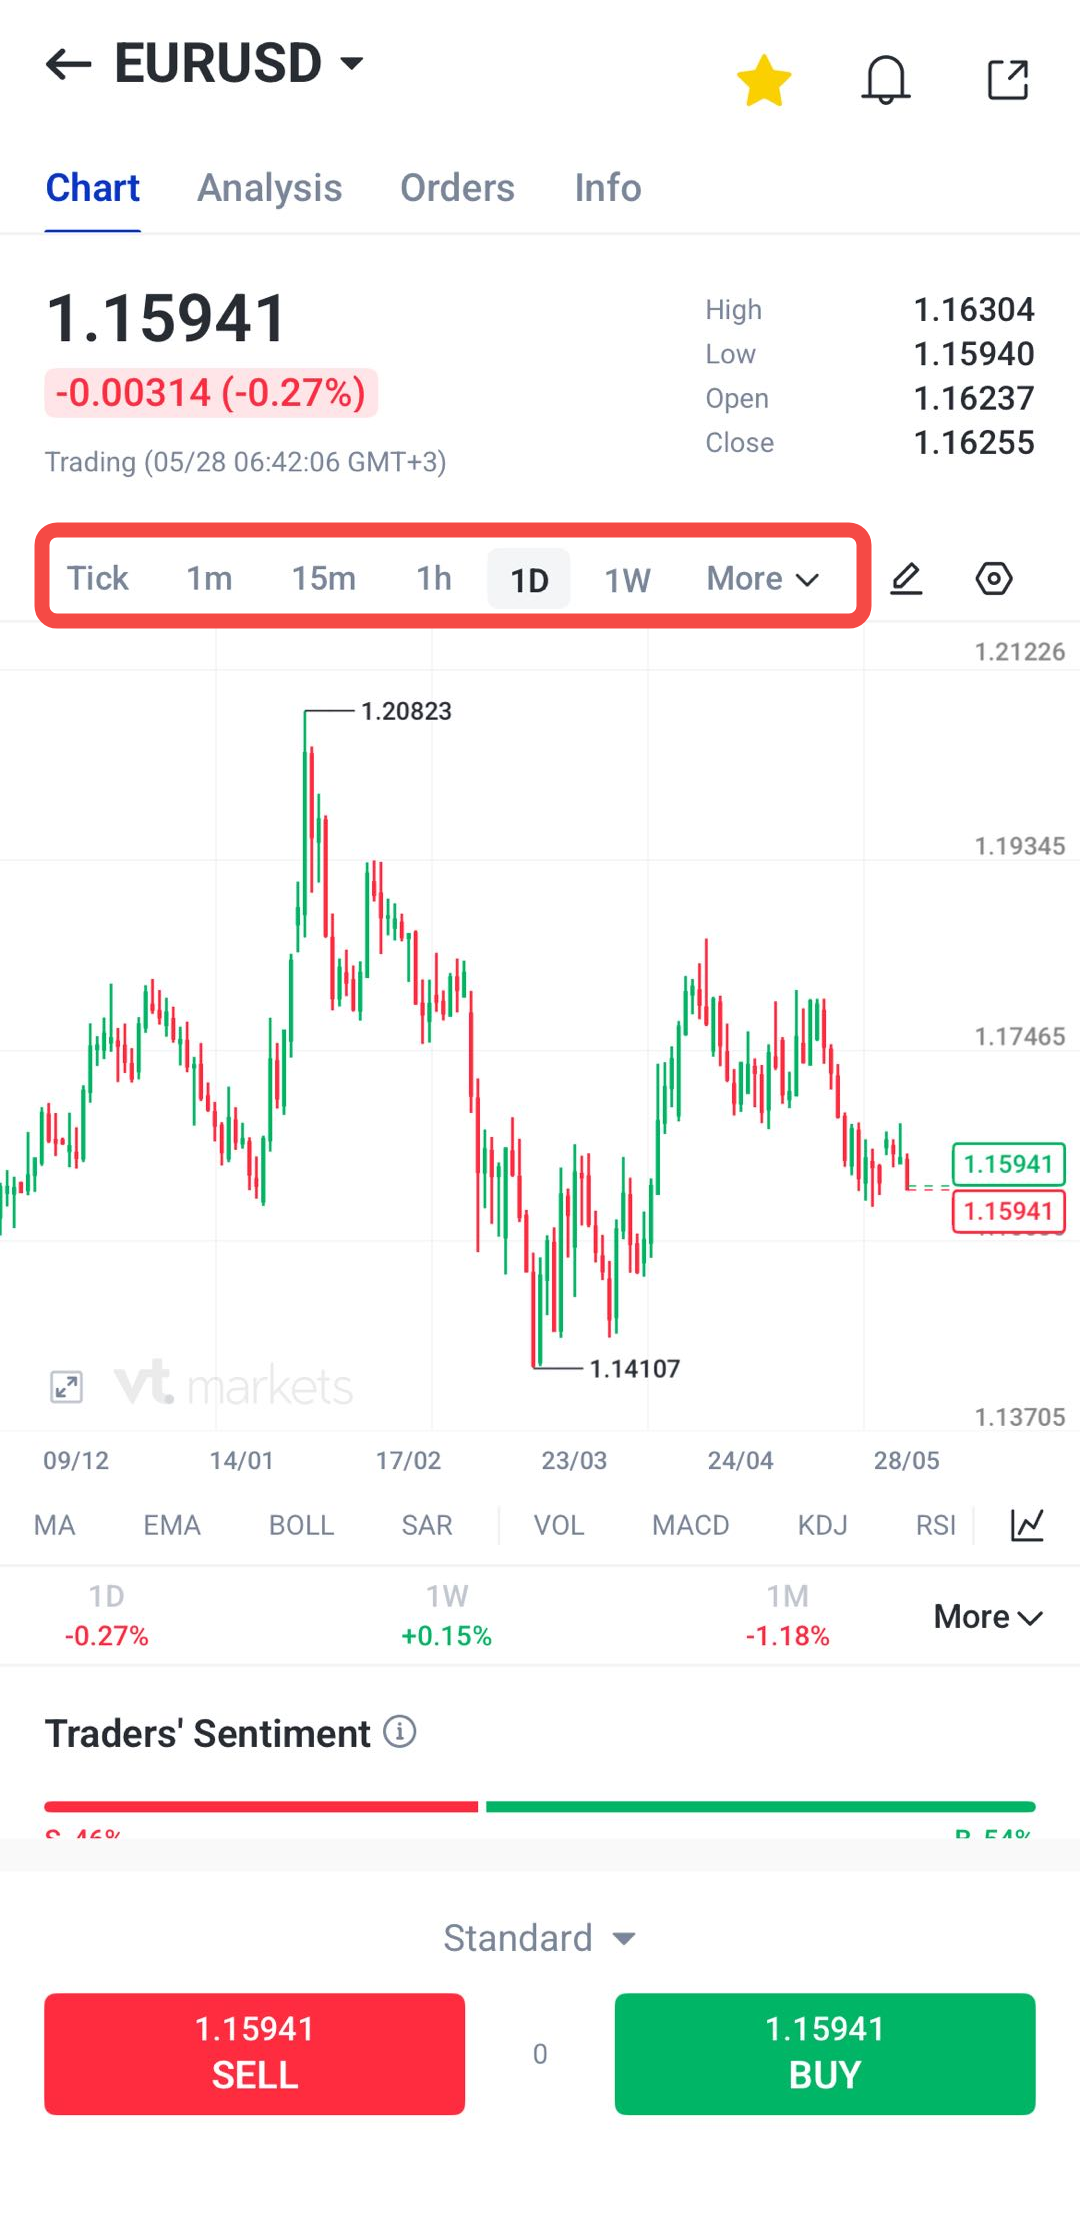
5. Choose a timeframe, such as 1 minute, 5 minutes, 1 hour, 4 hours, daily, or weekly.
6. Review how the price is moving on that timeframe.
7. Switch to another timeframe to compare short-term and long-term movement.
8. Use indicators or drawing tools if required.
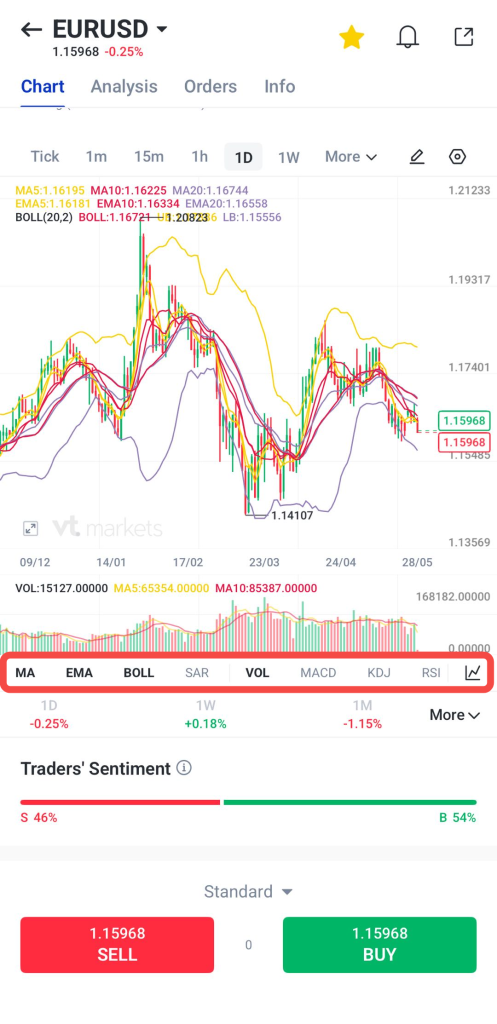
9. Review the overall trend before deciding whether to place or manage a trade.
Copy Trading
Copy Trading allows eligible users to follow selected strategy providers and automatically copy their trades. This feature may be useful for traders who want market exposure while observing how more experienced traders manage positions.
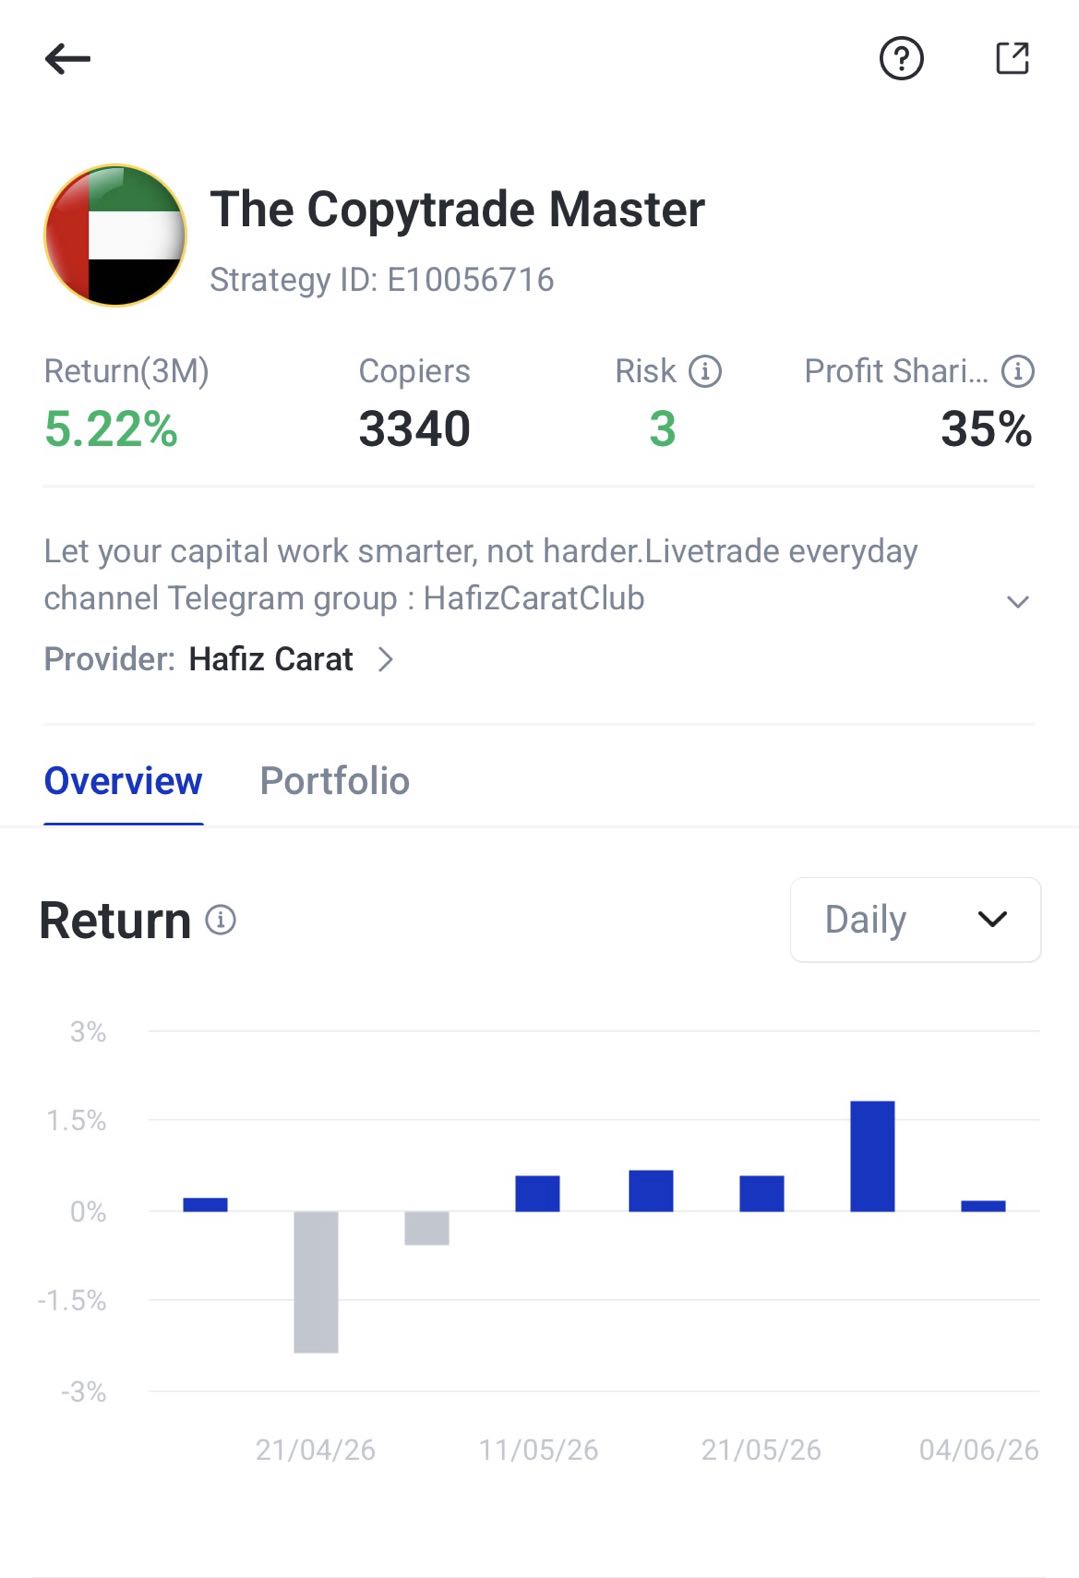
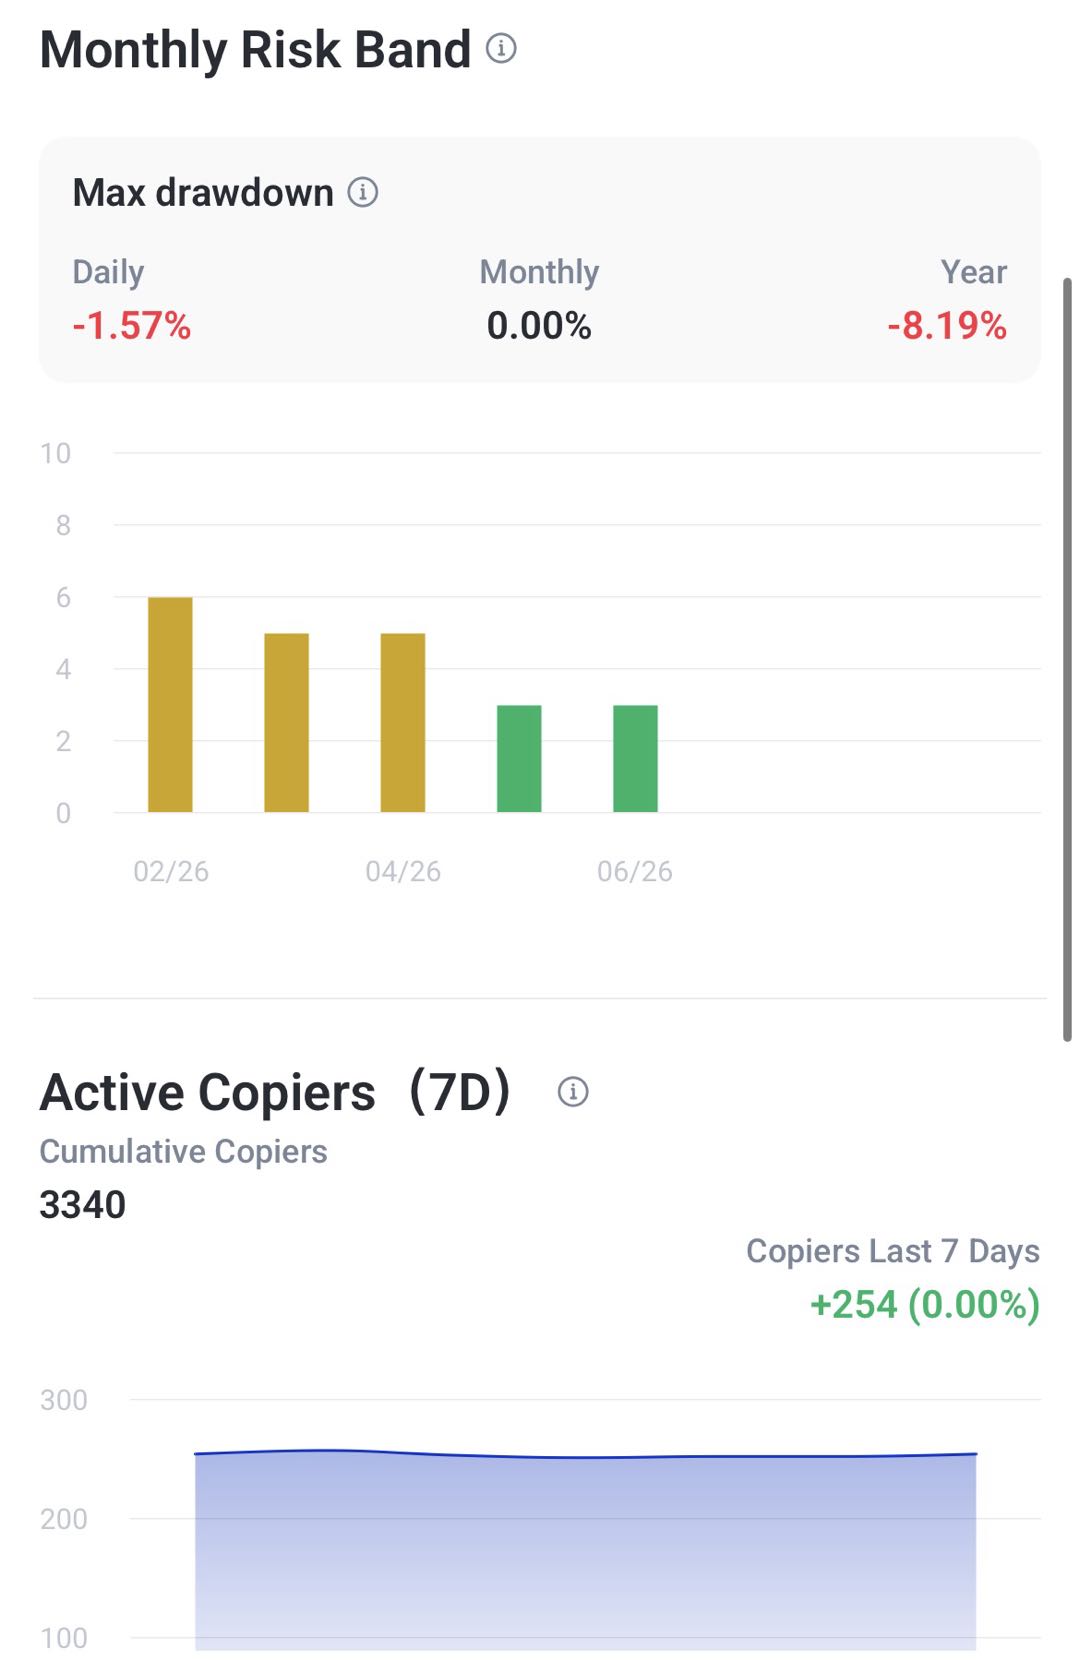
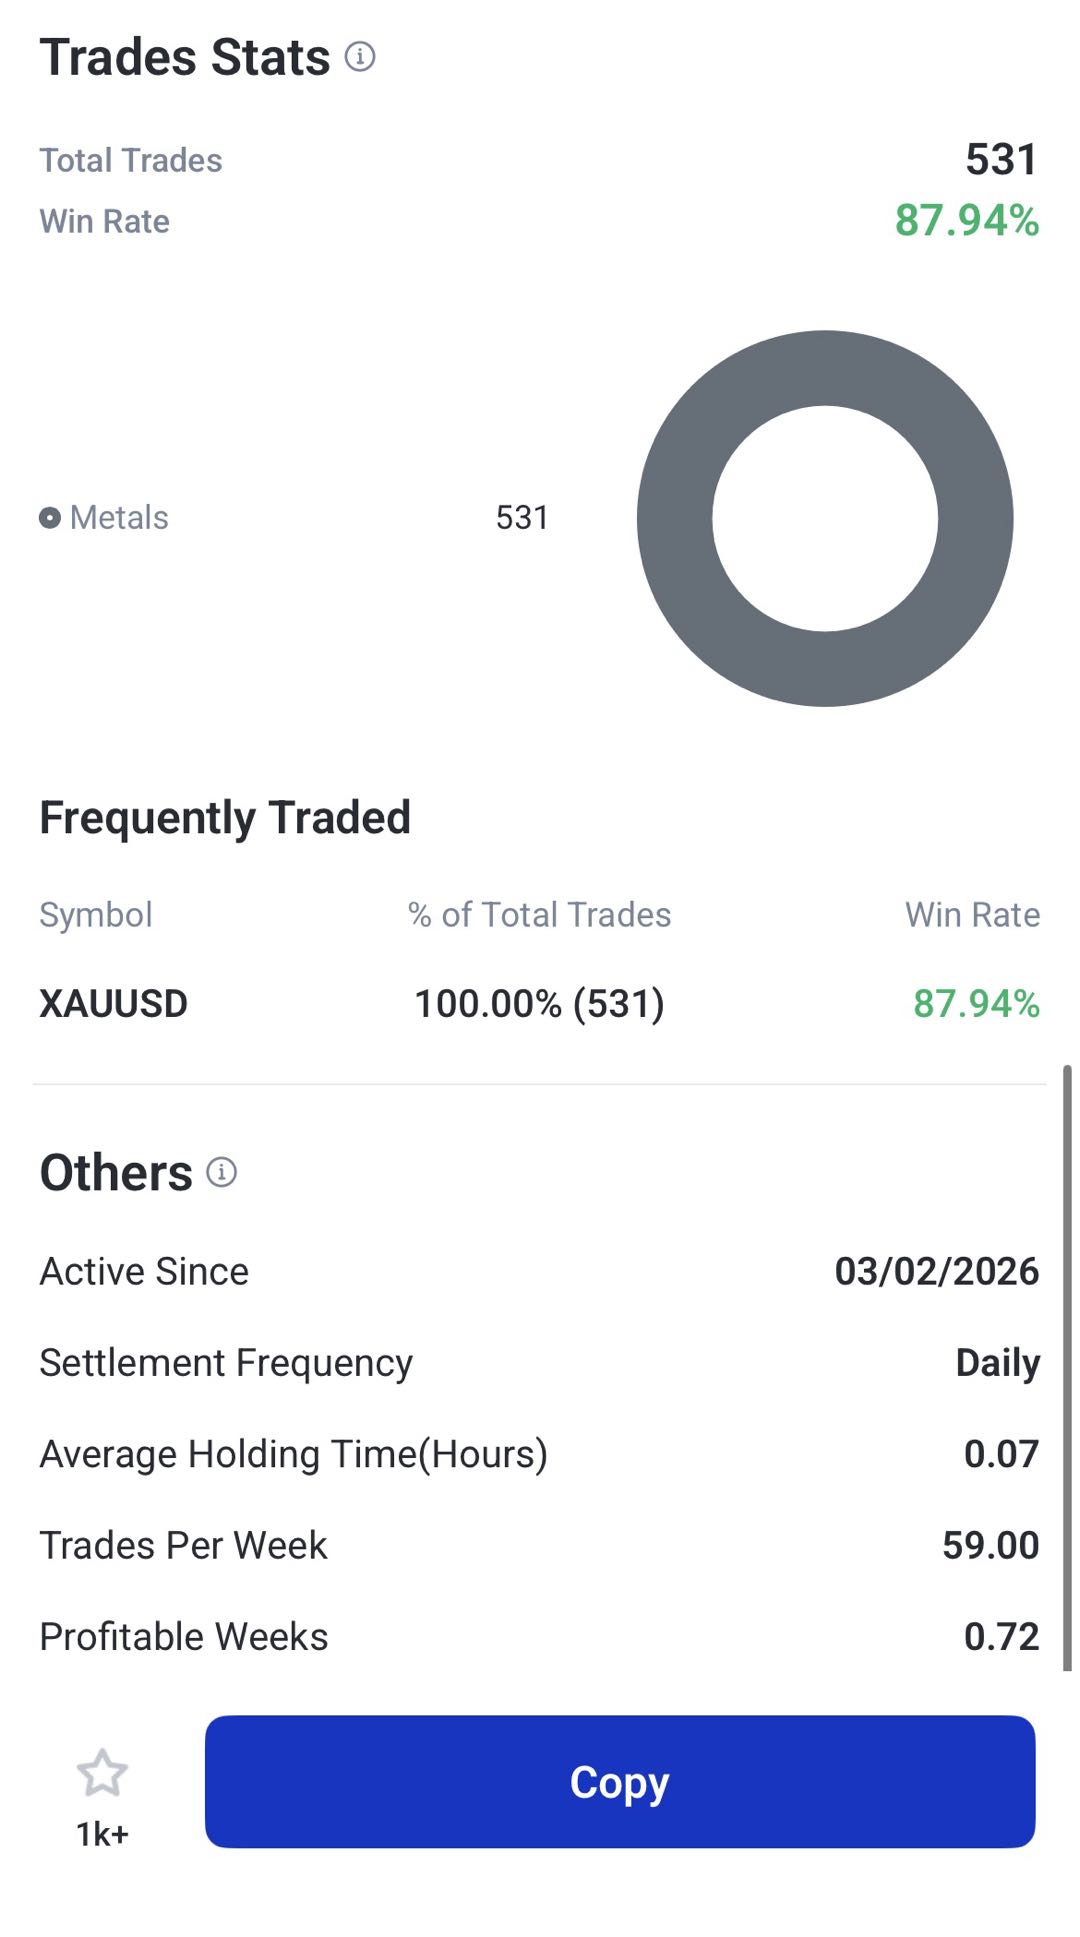
Within the Copy Trading section, users can review available strategy providers and compare information such as trading performance, risk level, trading history, and other key metrics. This helps traders assess whether a provider matches their objectives and risk tolerance.
Copy Trading does not remove trading risk. Performance can change over time, and past results do not guarantee future outcomes. Traders should monitor copied trades regularly and adjust their settings when necessary.
How to use Copy Trading on the VT Markets app:
1. Open the VT Markets app, switch your account to copy trading, then navigate to the Copy Trading section.
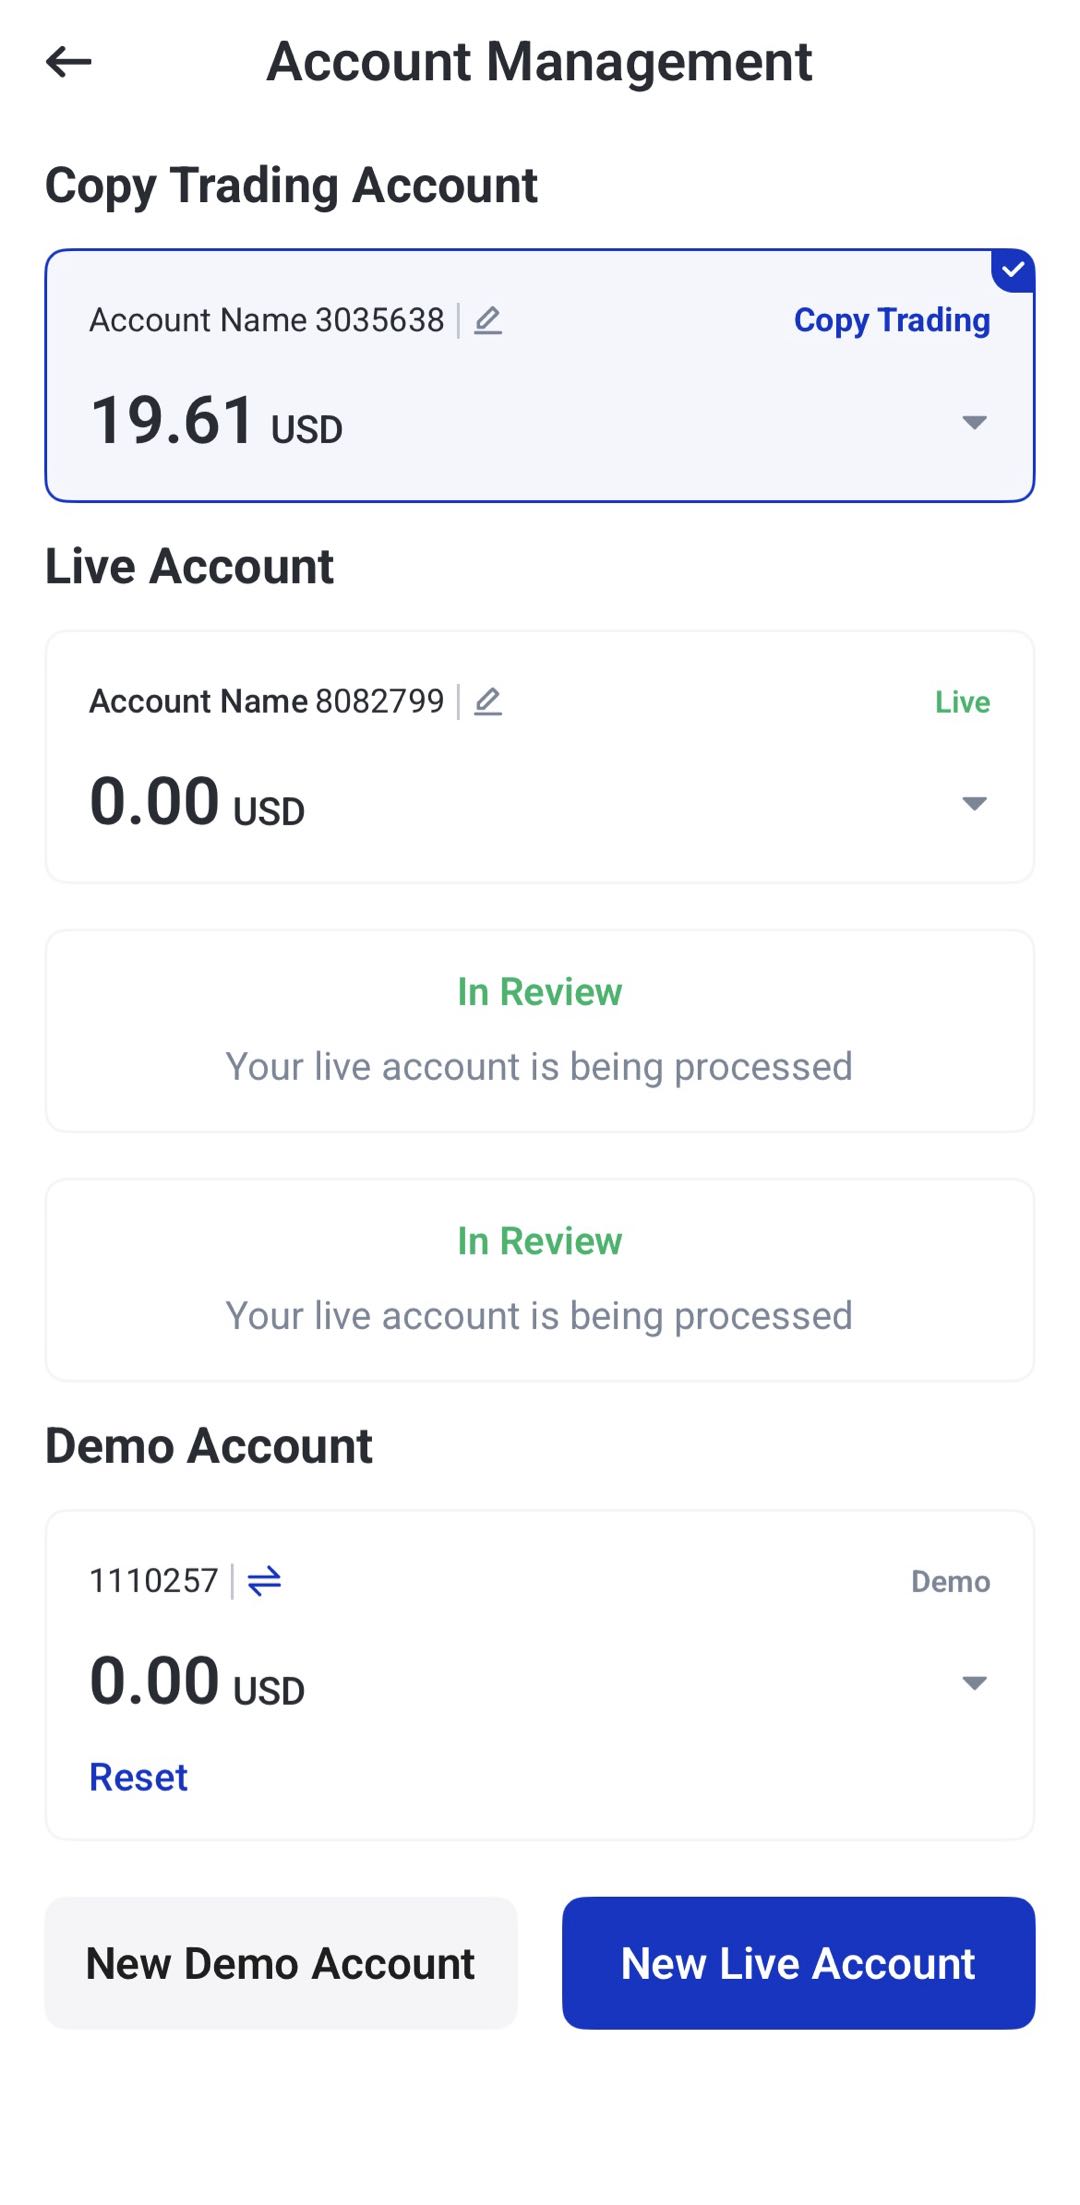
2. Browse available strategy providers or explore the Top 20 best-performing traders of the week.
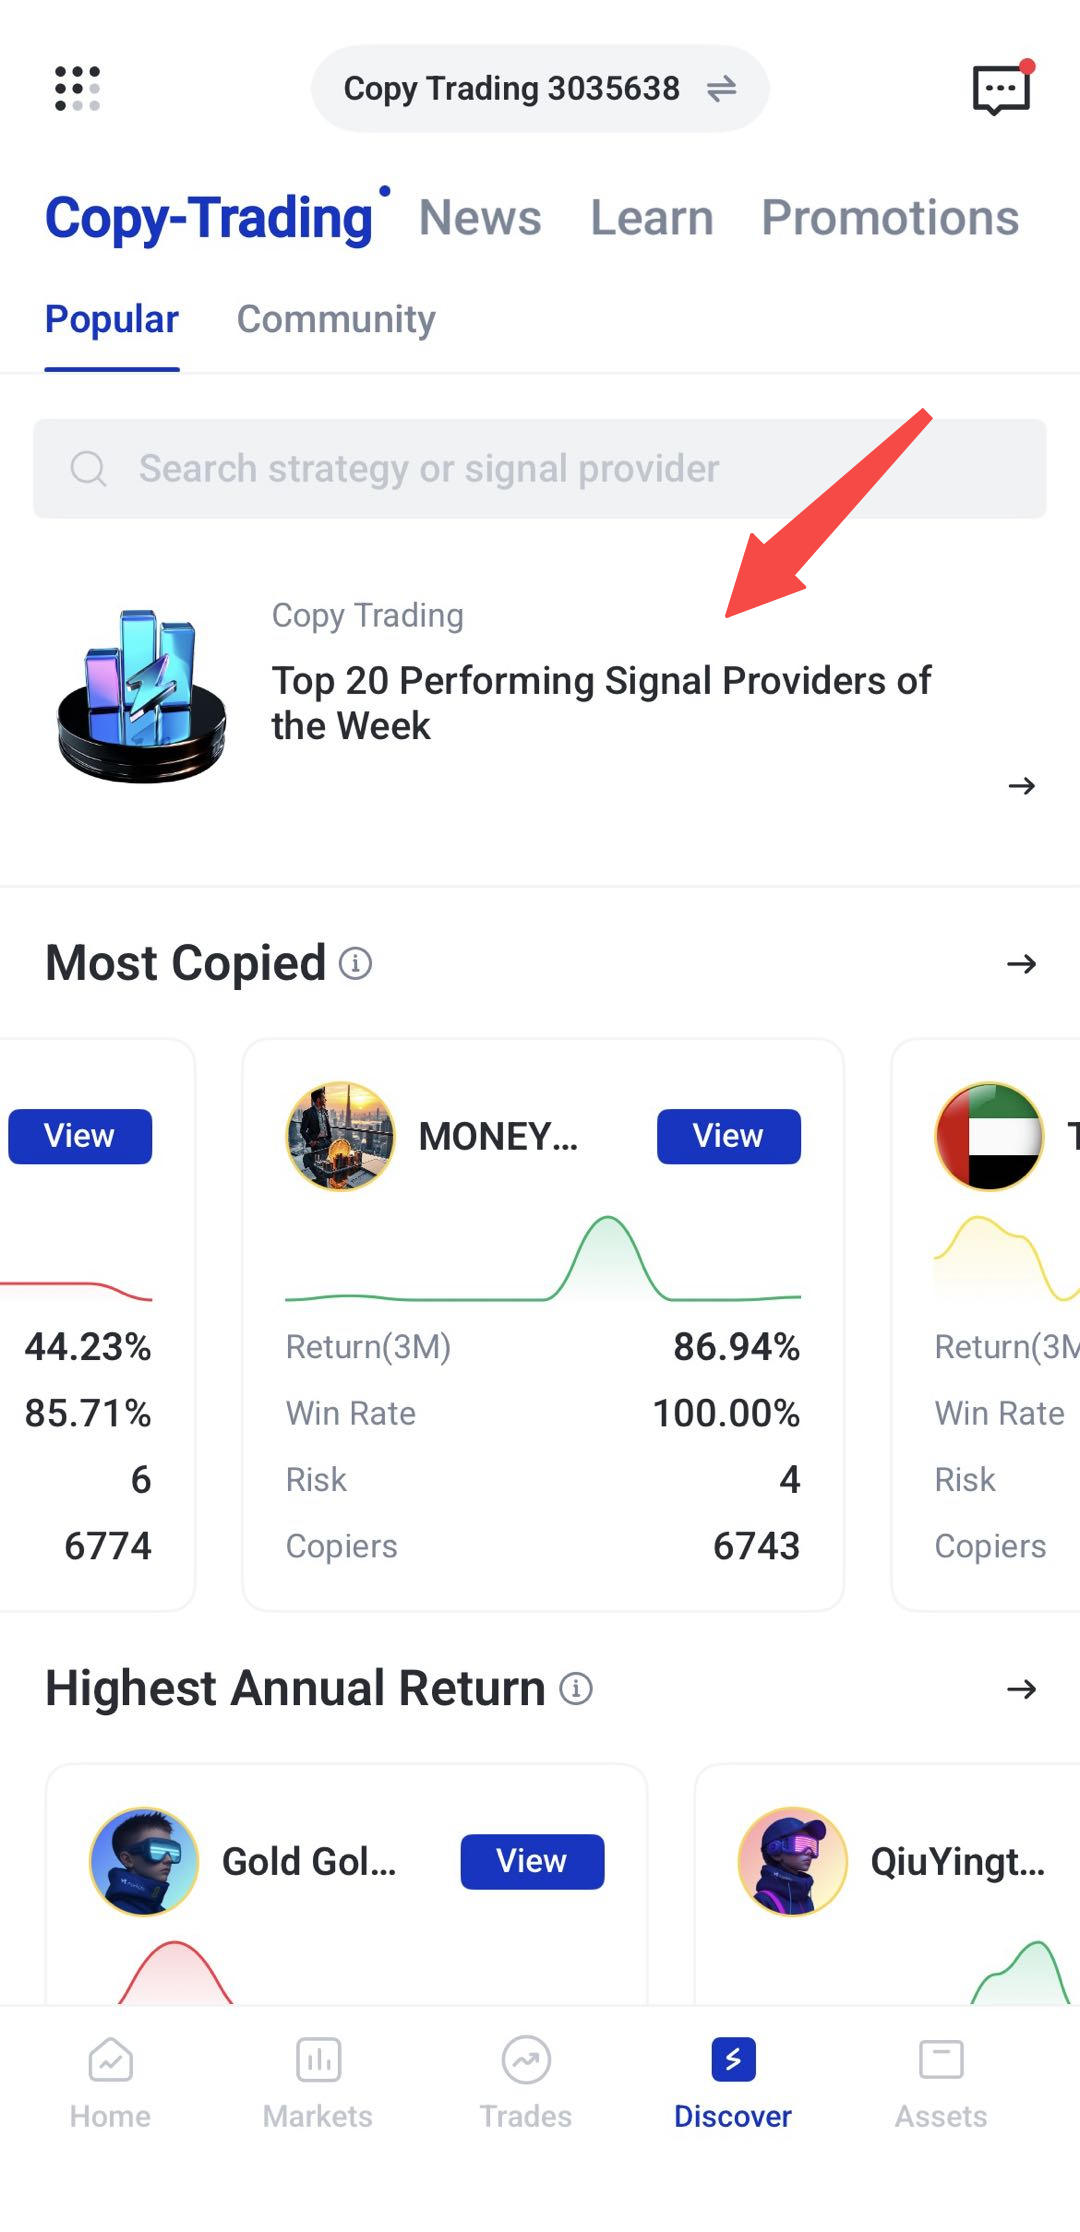
3. Compare different traders by reviewing their performance, trading history, and risk level before selecting one that suits your objectives and risk tolerance. Let’s see the example below:
4. Allocate funds and begin copying trades automatically.
5. Monitor performance regularly and adjust your settings when needed.
Want to learn more about copy trading? Read these guides:
- 5 Common Mistakes to Avoid When Copy Trading
- A Complete Beginner’s Guide to Copy Trading in 2026
- How to Choose the Right Strategy Provider
- How to Evaluate Copy Trading Providers: Key Metrics Every Trader Should Know
One-Tap Trading
One-tap trading allows traders to place orders more quickly by reducing the number of steps needed to enter or exit a position. This can be useful when markets are moving quickly.
However, faster execution also requires careful setup. Traders should review position size, stop loss, take profit, and other order settings before using this feature. Beginners may prefer to keep one-tap trading disabled until they are more familiar with order placement.
How to Use One-Tap Trading on the VT Markets App
1. Open the VT Markets app.
2. Select the instrument you want to trade.
3. Open the chart or trading screen.
4. Locate the One-Tap Trading option.
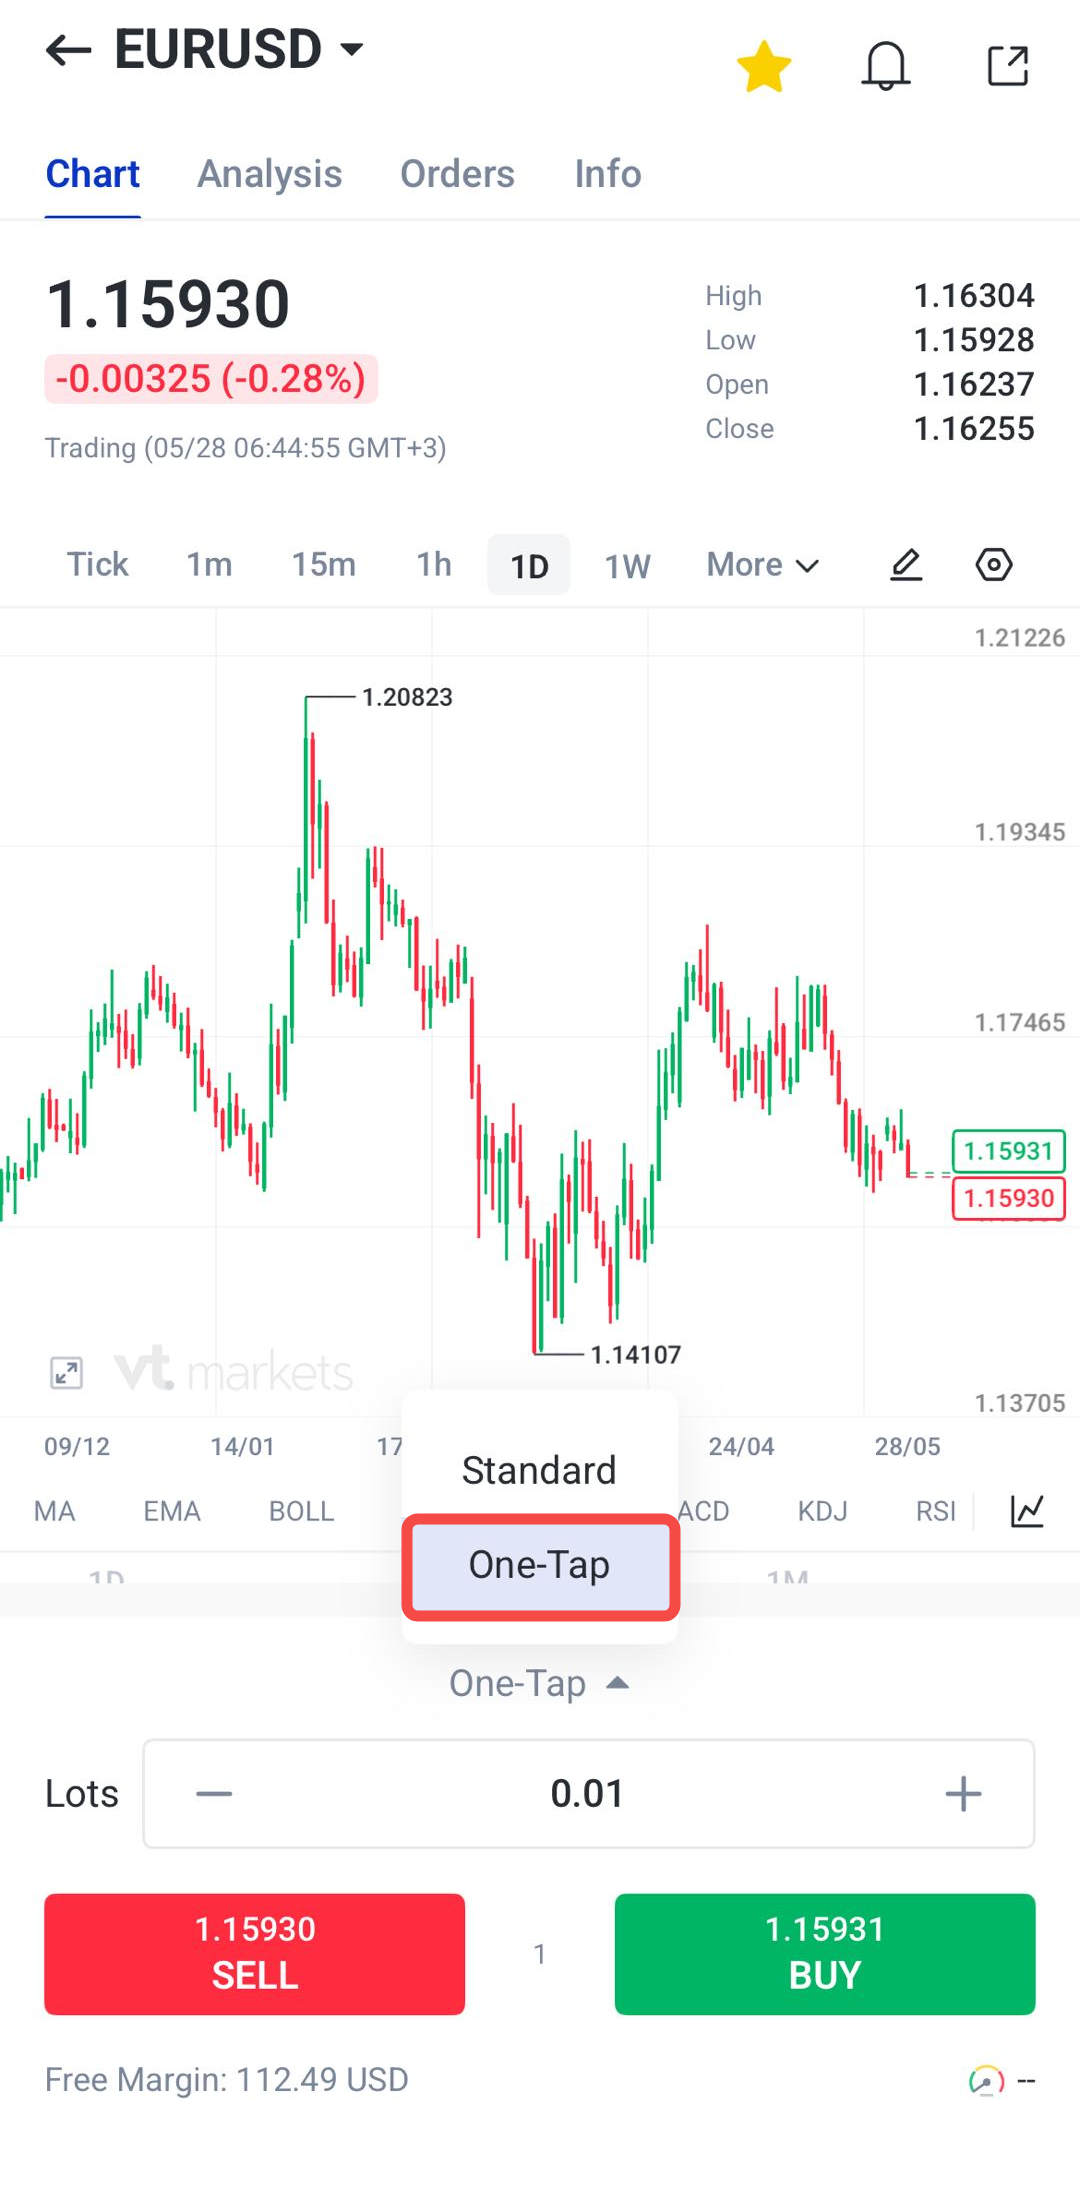
5. Review or enable the one-tap trading setting.
6. Set your trading preferences, including order size, stop loss, and take profit.
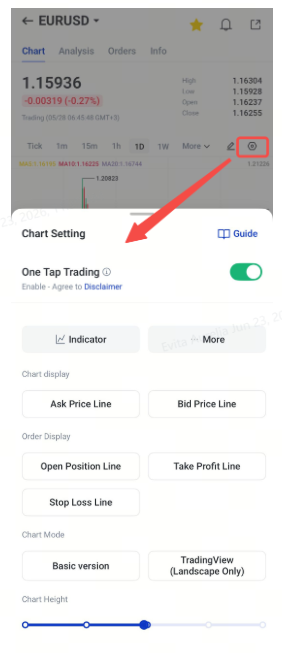
7. Check the sell and buy prices carefully.
8. Confirm that the settings match your trading plan.
9. Place the trade if you are ready to proceed.
10. Monitor the open position and adjust or close it when needed.
Note: One-tap trading should be used carefully, as orders may be placed more quickly once the feature is enabled.
TradingView Chart Integration
The VT Markets app includes TradingView chart integration, allowing traders to access advanced charting tools directly within the app.
TradingView charts can help traders review trends, apply indicators, draw trendlines, and mark support and resistance levels. This can support technical analysis without requiring traders to switch between different platforms.
In the VT Markets app, TradingView chart mode is mainly used for analysis. Traders may need to switch back to portrait mode to place orders.
How to Use TradingView Charts on the VT Markets App
1. Open the VT Markets app.
2. Select the instrument you want to analyse.
3. Open the chart screen.
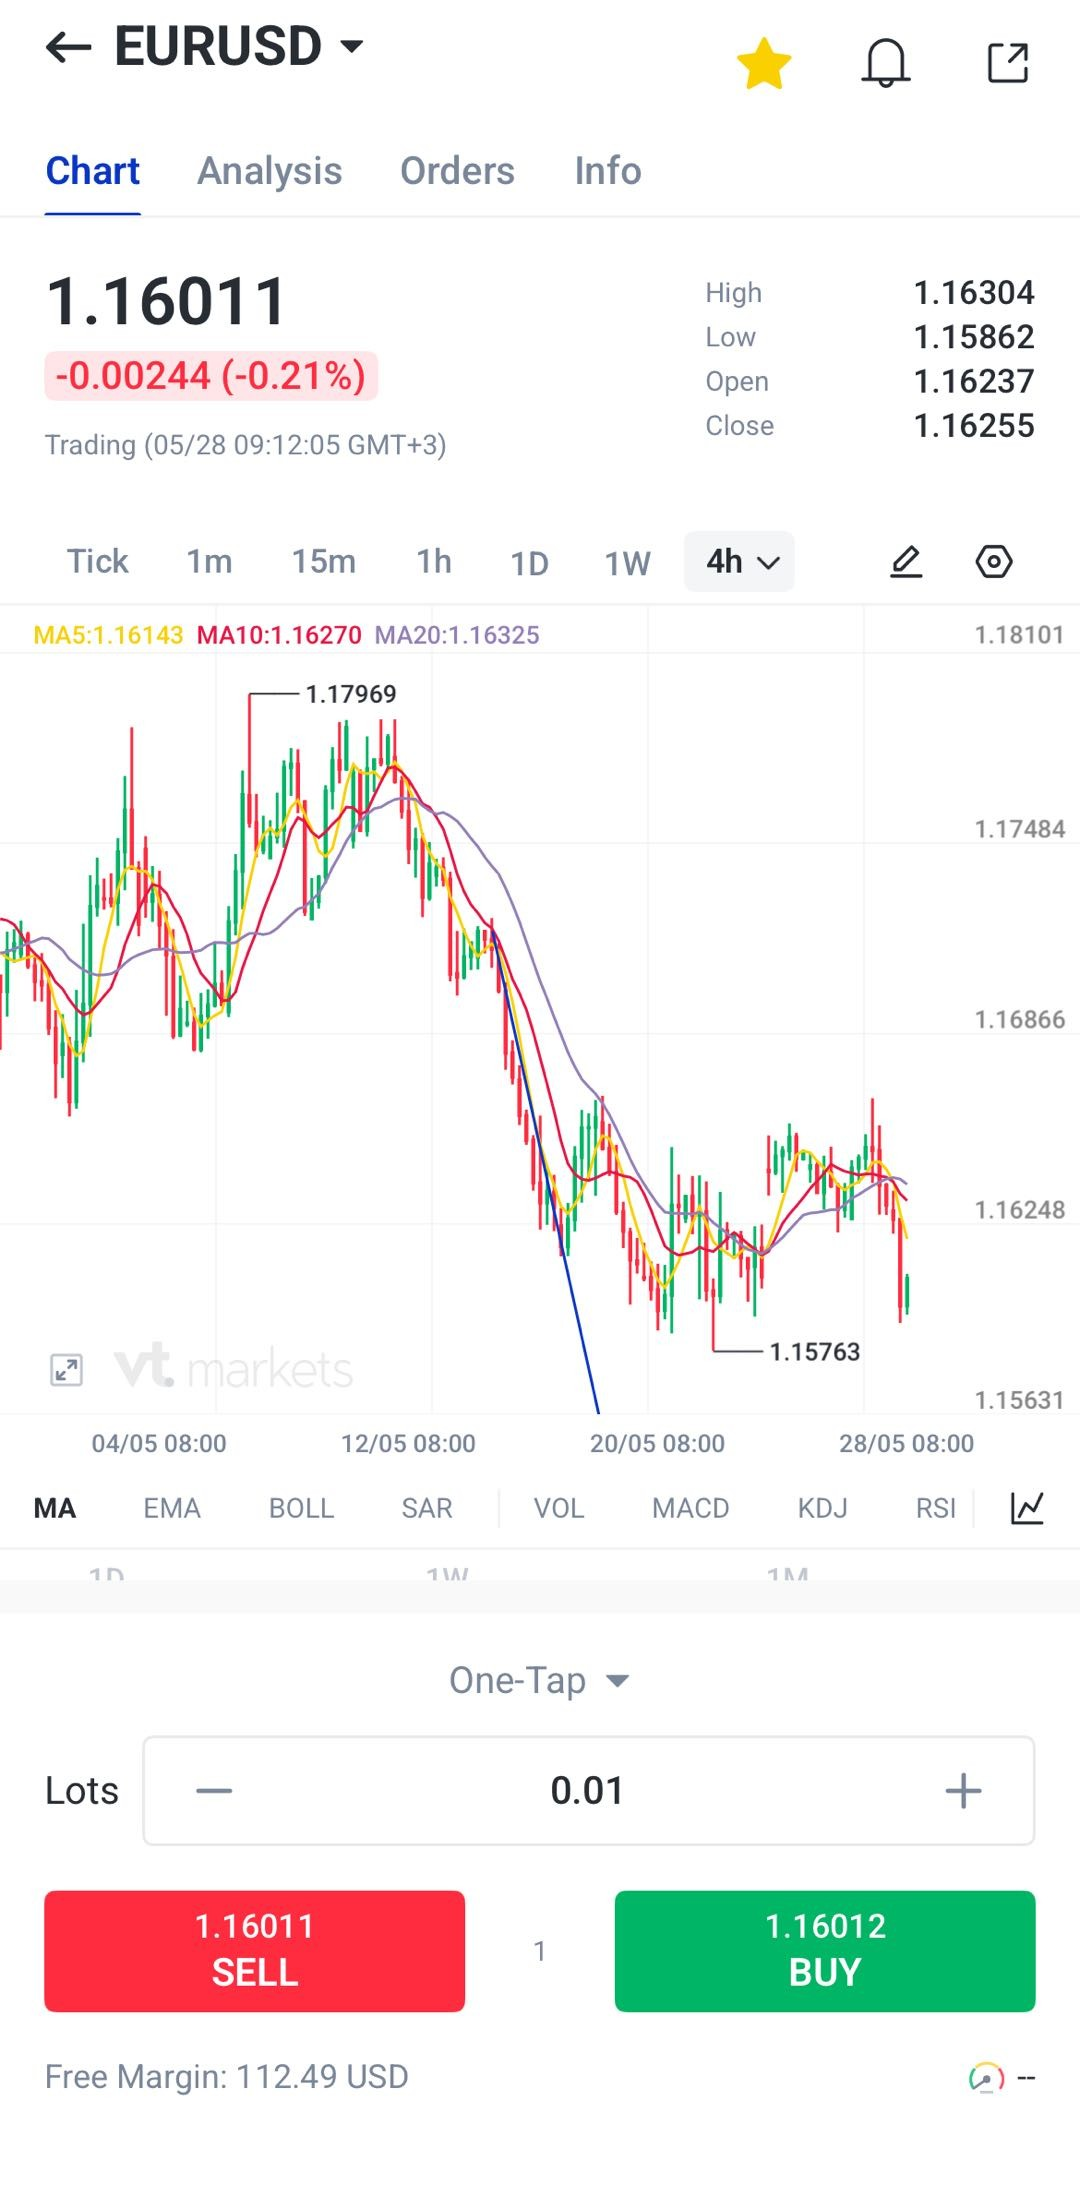
4. Tap the chart mode or chart settings button.
5. Select TradingView mode.
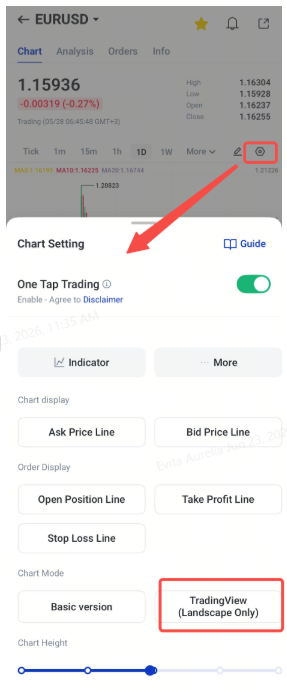
6. The layout will be landscape.
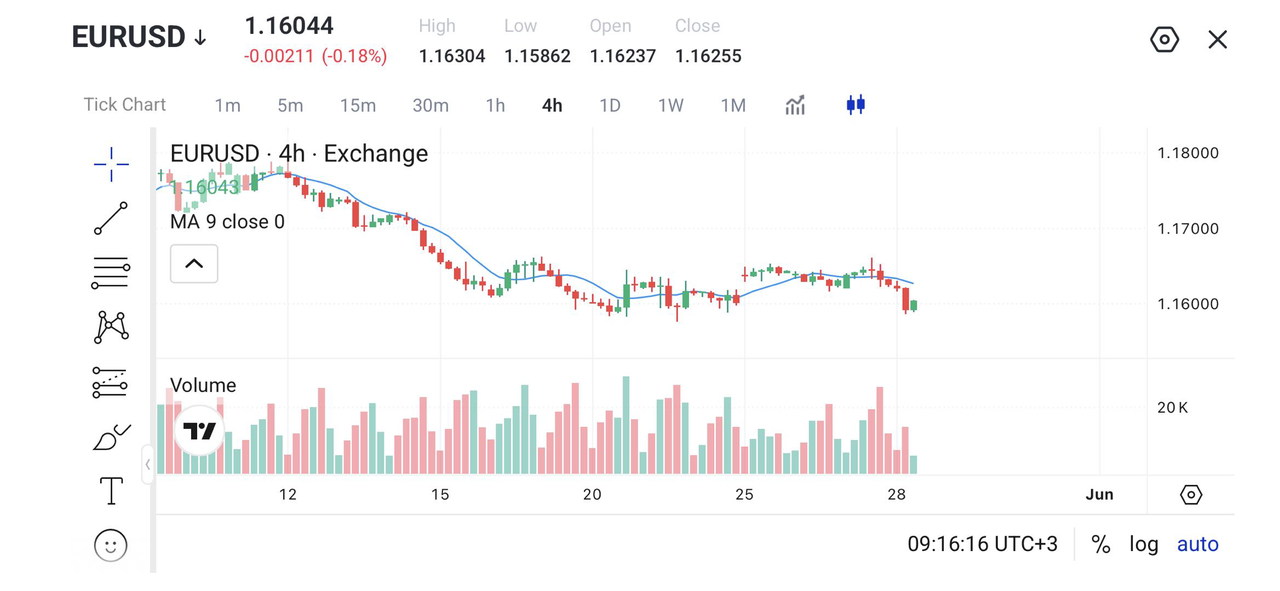
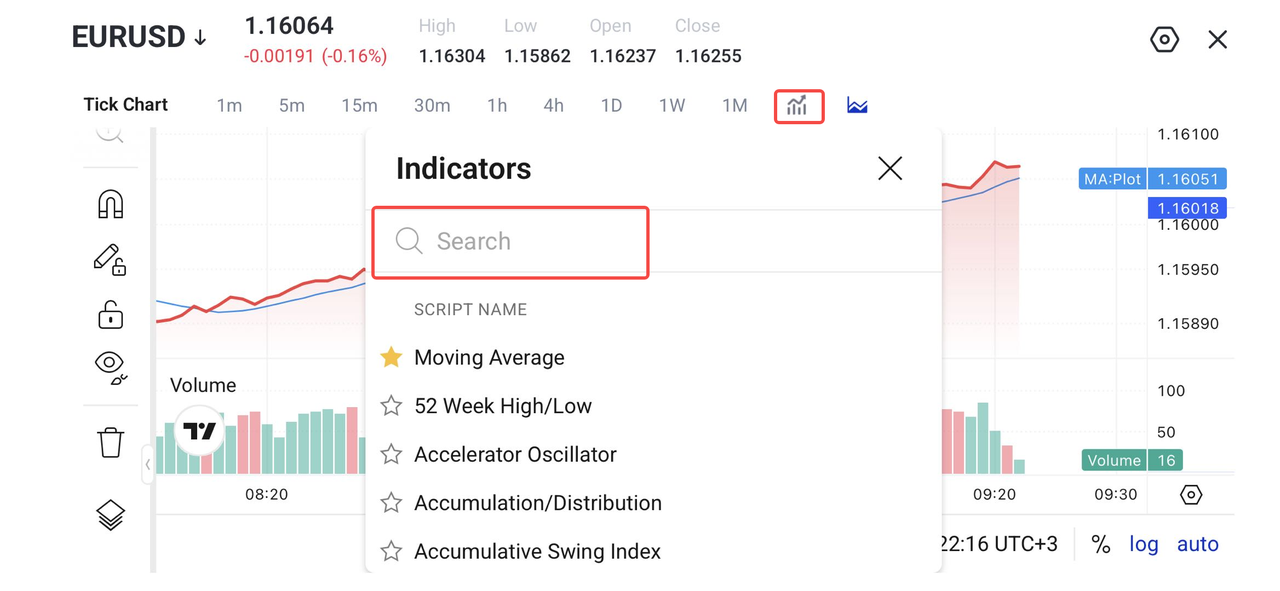
7. Add indicators such as RSI, MACD, Bollinger Bands, or Moving Averages.
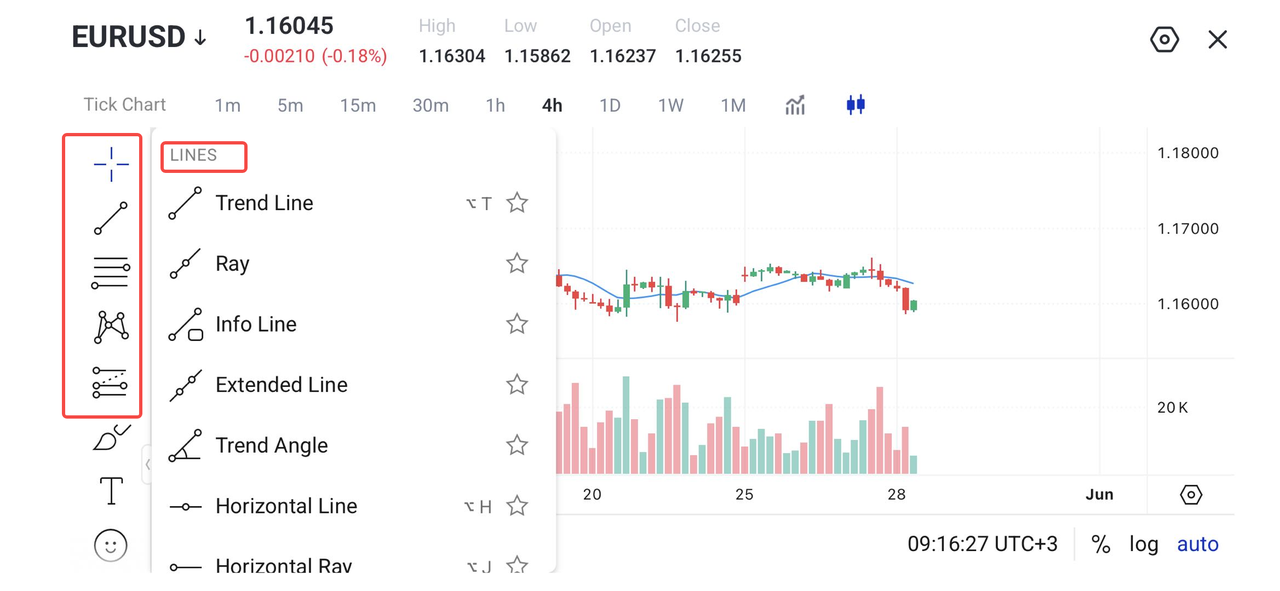
8. Use drawing tools to mark trendlines, support, and resistance levels.
9. Review the chart analysis.
10. Switch back to portrait mode when you are ready to place or manage an order.
Technical Indicators
Technical indicators help traders analyse price movement, momentum, volatility, and possible market direction. They can provide additional context when reviewing a chart.
Common technical indicators include Moving Averages, Relative Strength Index, Moving Average Convergence Divergence, Bollinger Bands, and Stochastic Oscillator.
Beginners may prefer to start with one or two indicators before using more advanced combinations. Using too many indicators on one chart can make analysis harder to read.
How to Use Technical Indicators on the VT Markets App
1. Open the VT Markets app.
2. Select the instrument you want to analyse.
3. Open the chart screen.
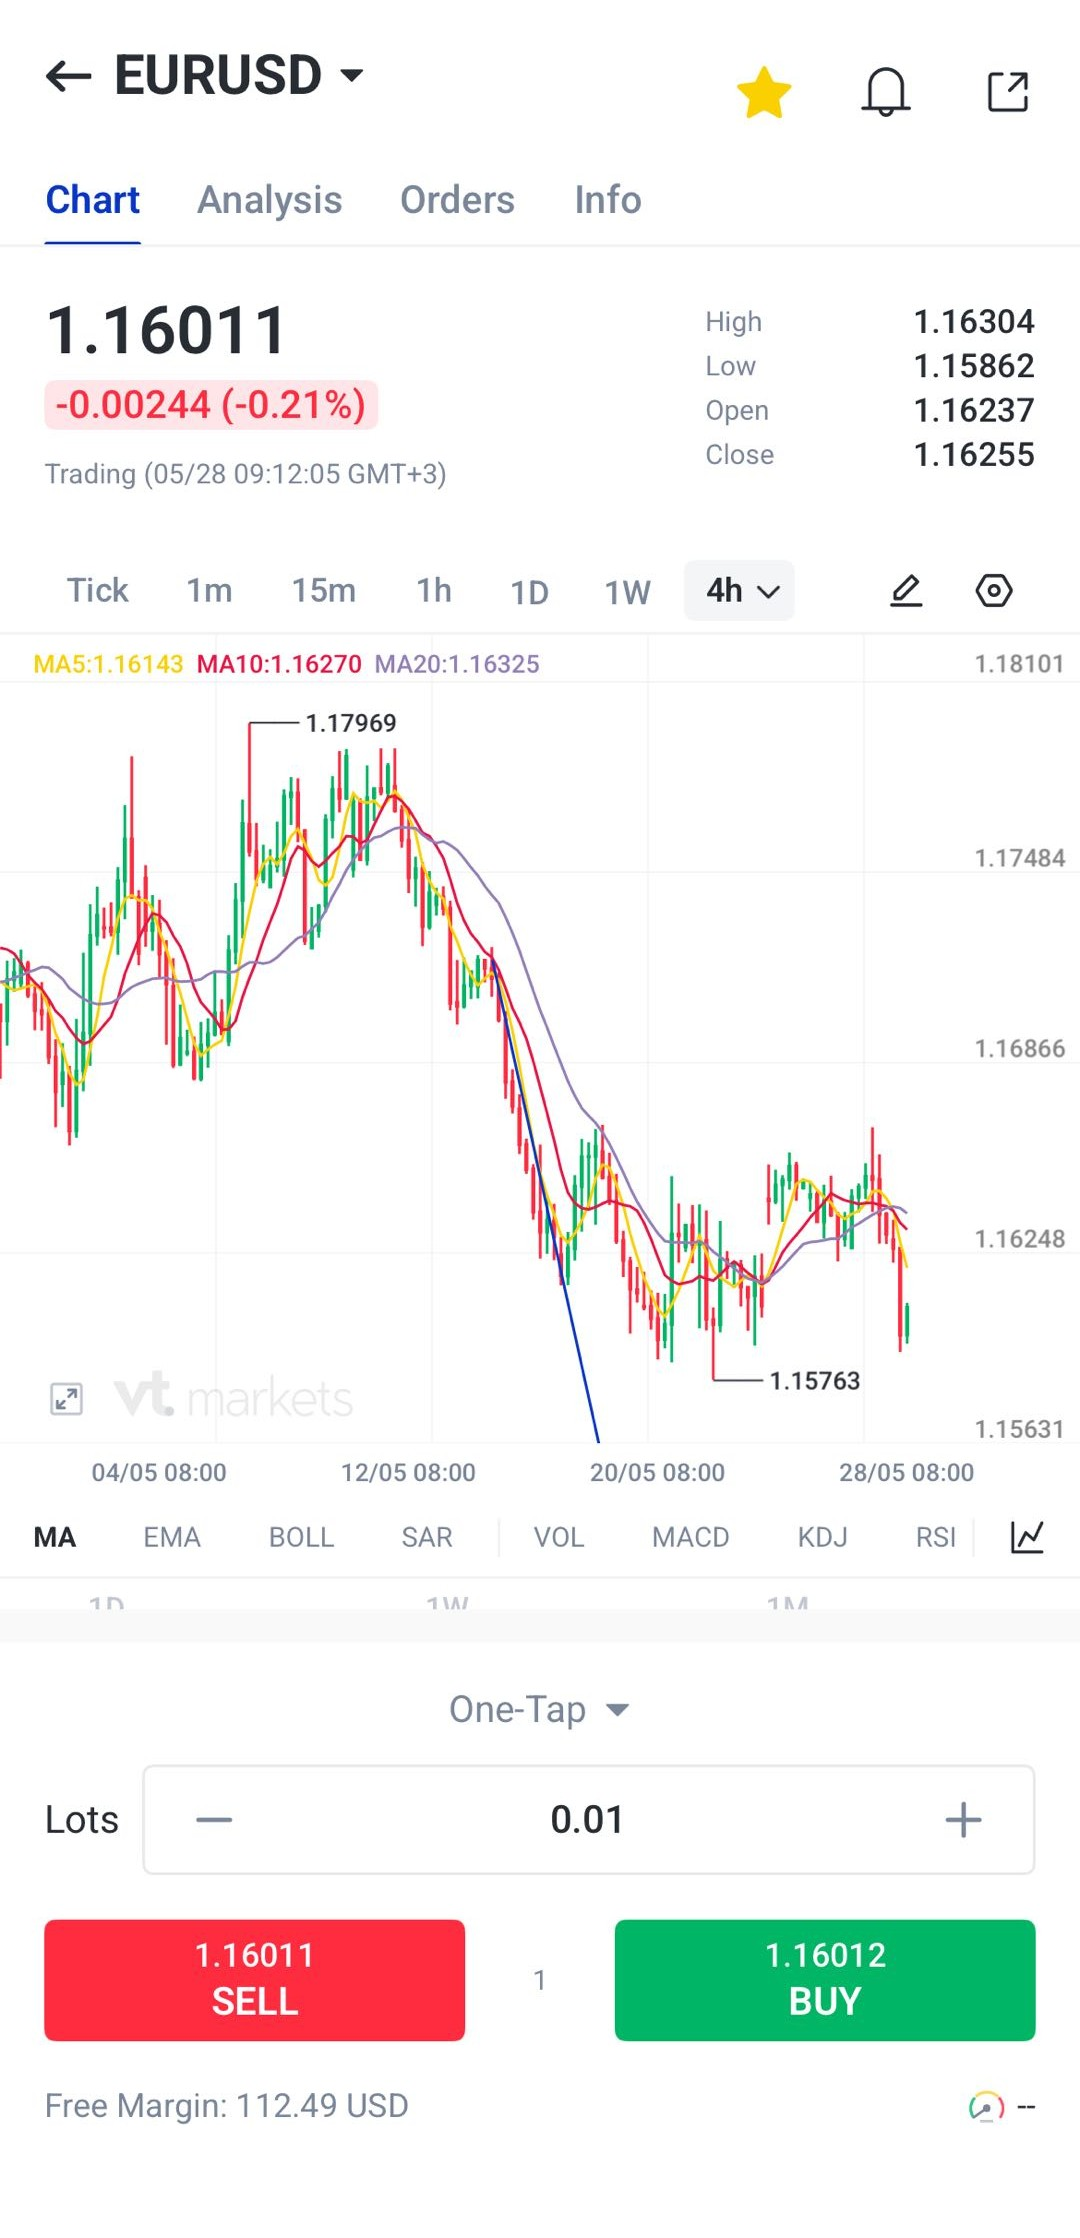
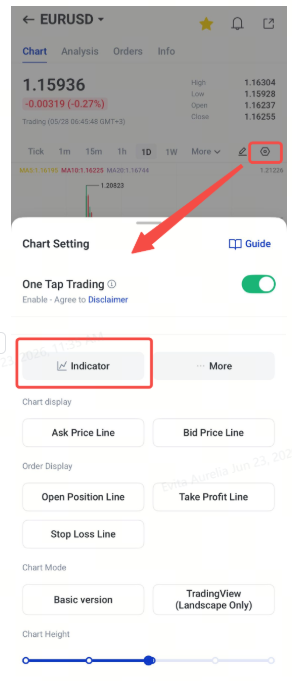
4. Tap the chart settings or indicator button.
5. Choose Indicators.
6. Select the indicator you want to apply.
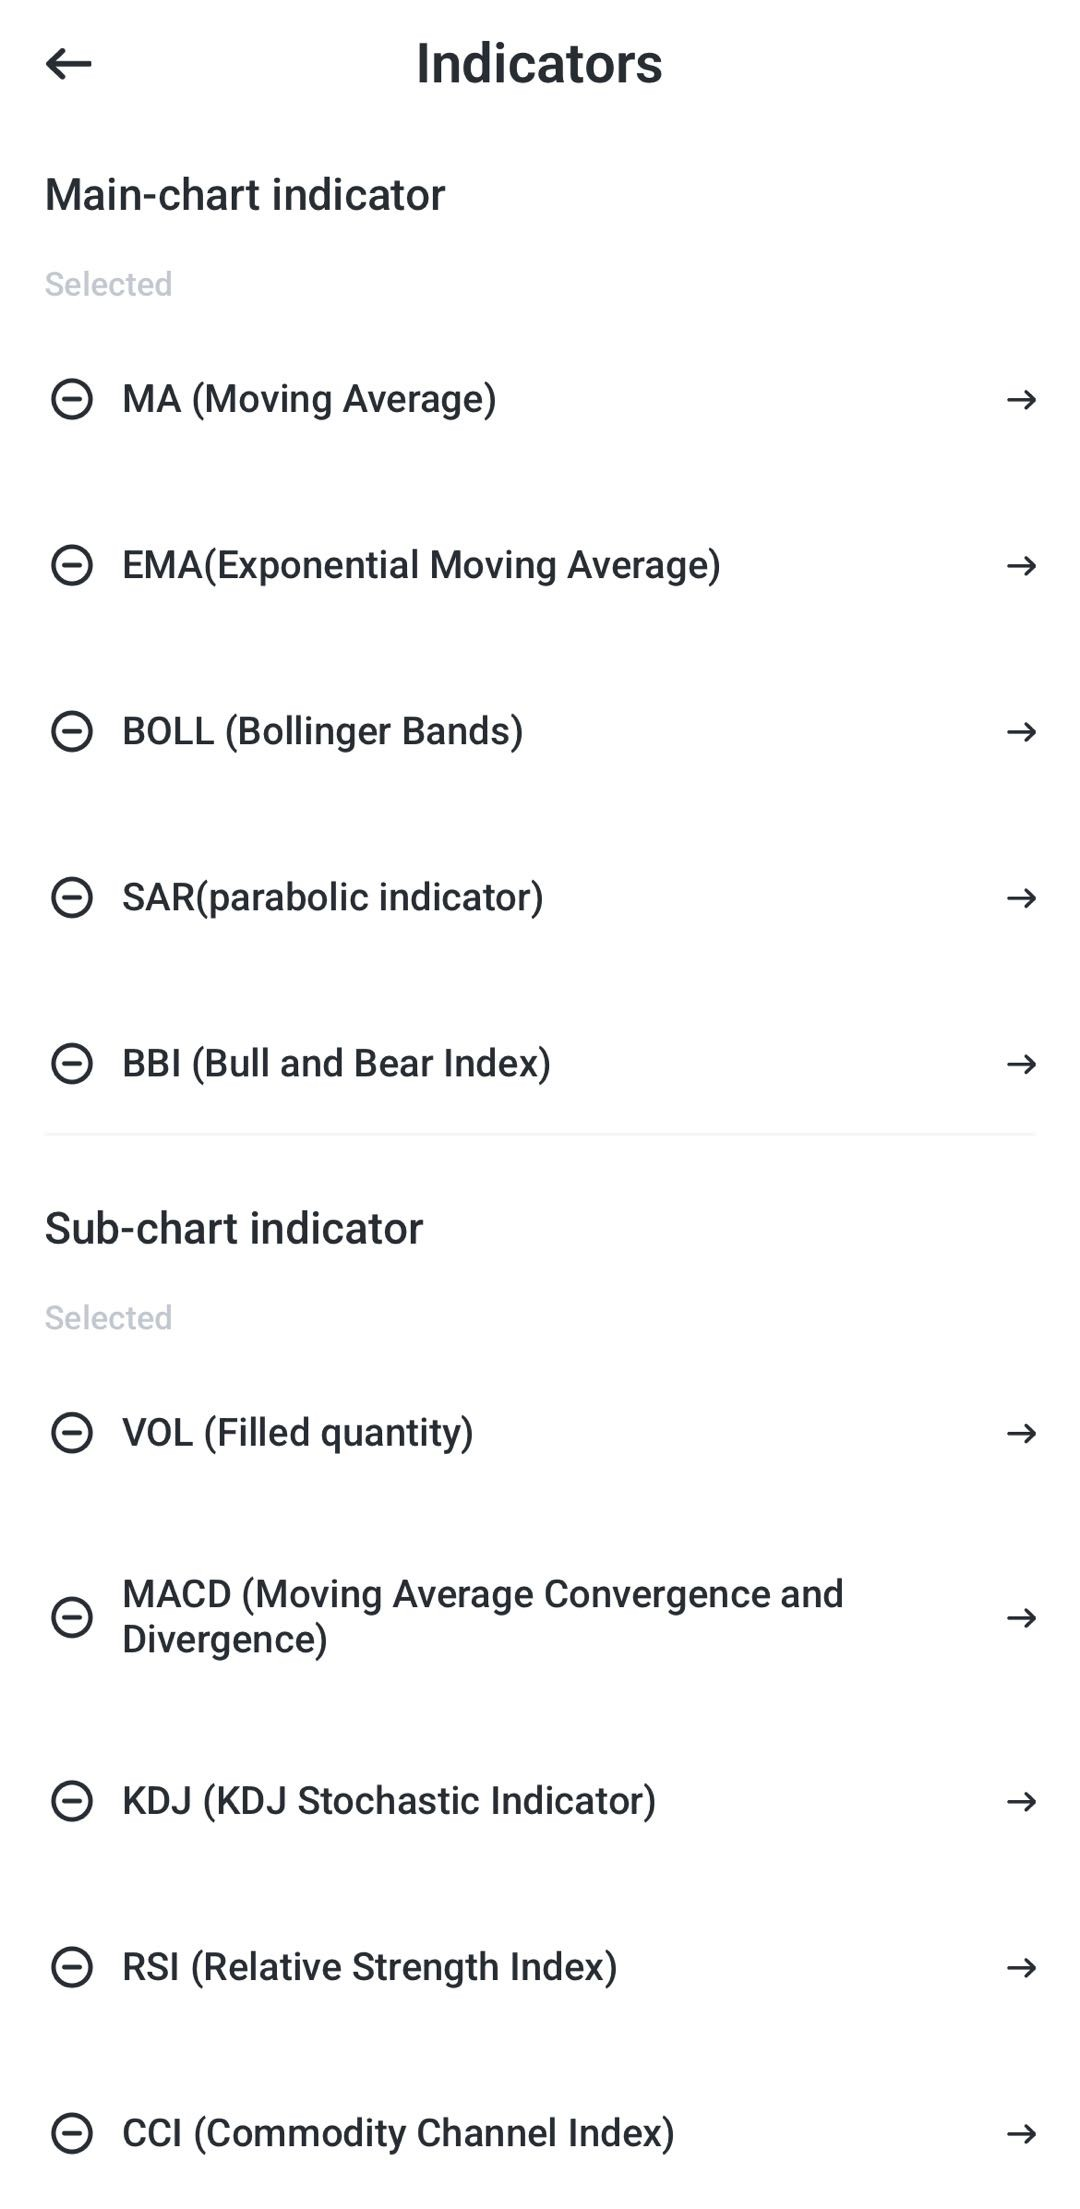
7. Adjust the settings, such as period length, line style, or display preferences.
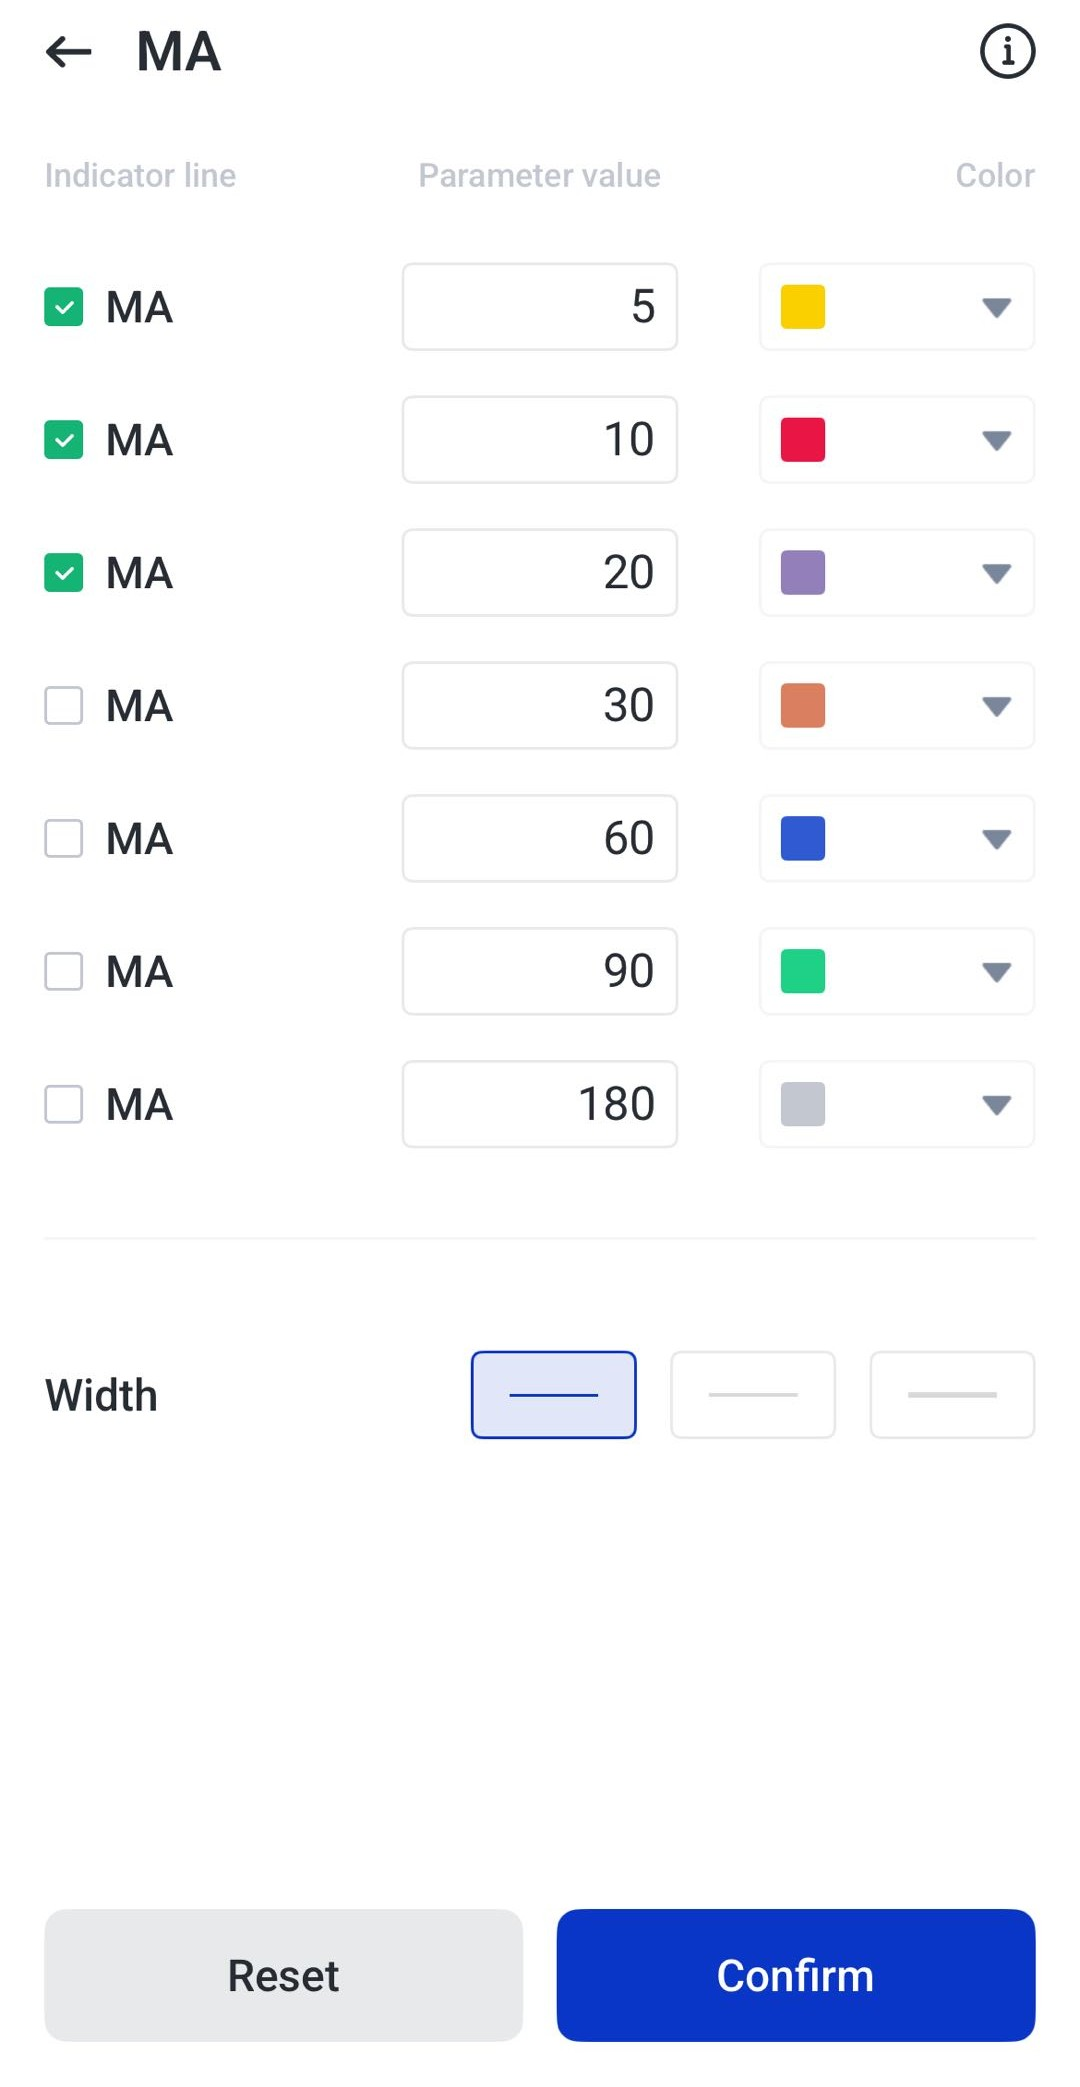
8. Confirm the changes.
9. Review the indicator together with price movement.
10. Remove or adjust indicators when they are no longer needed.
Economic Calendar and Alerts
Financial markets can react strongly to major economic events. Interest rate decisions, inflation reports, employment data, central bank updates, and economic growth figures may all affect market prices.
The Economic Calendar in the VT Markets app helps traders track upcoming events and prepare for periods of possible market volatility. Alerts can also help traders receive reminders before important announcements.
How to Use the Economic Calendar on the VT Markets App
1. Open the VT Markets app.
2. Navigate to Discover → News → Economic Calendar.
3. Review upcoming events by date, time, country, and impact level.
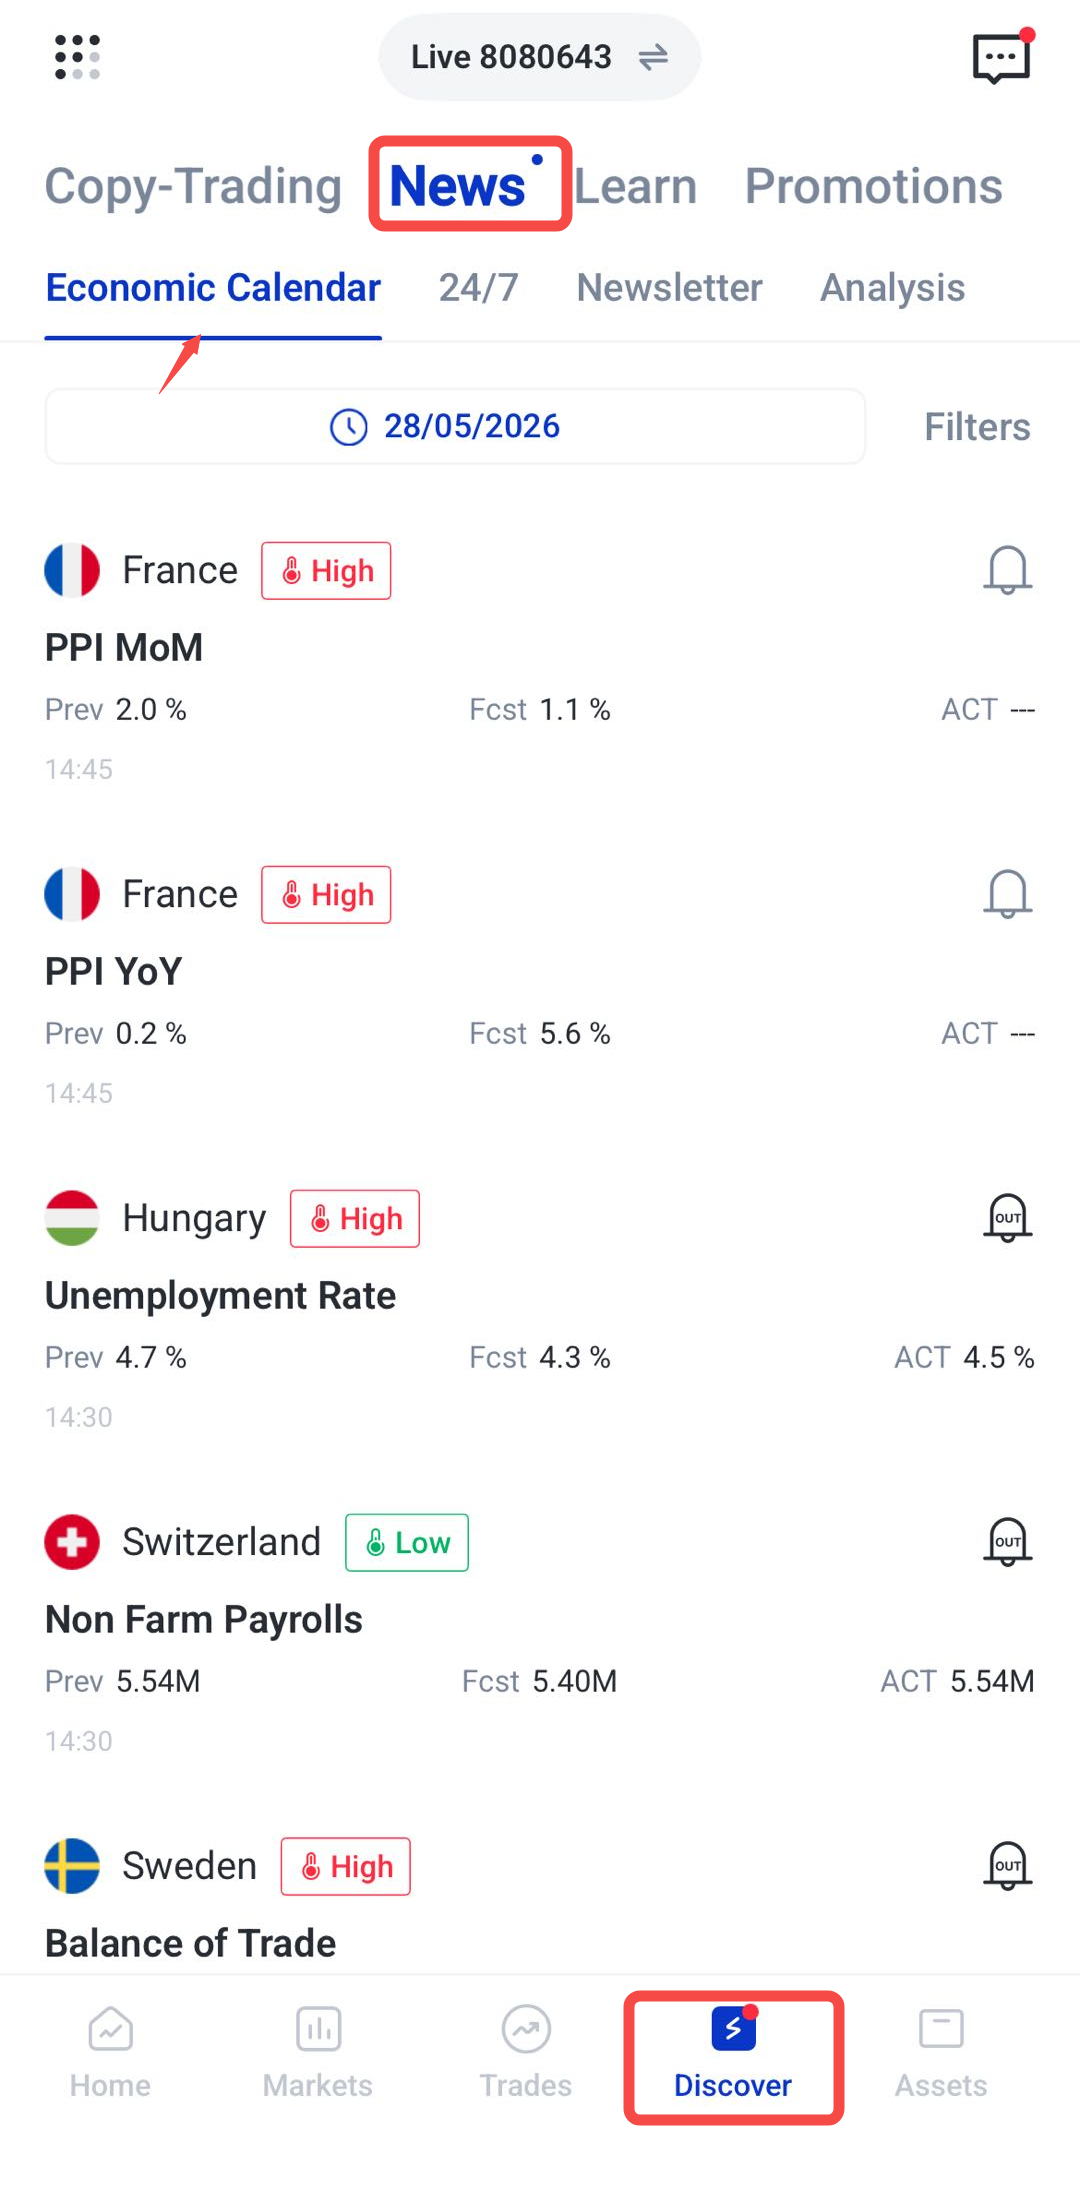
4. Select an event to view more details.
5. Set an alert or notification for important events if available.
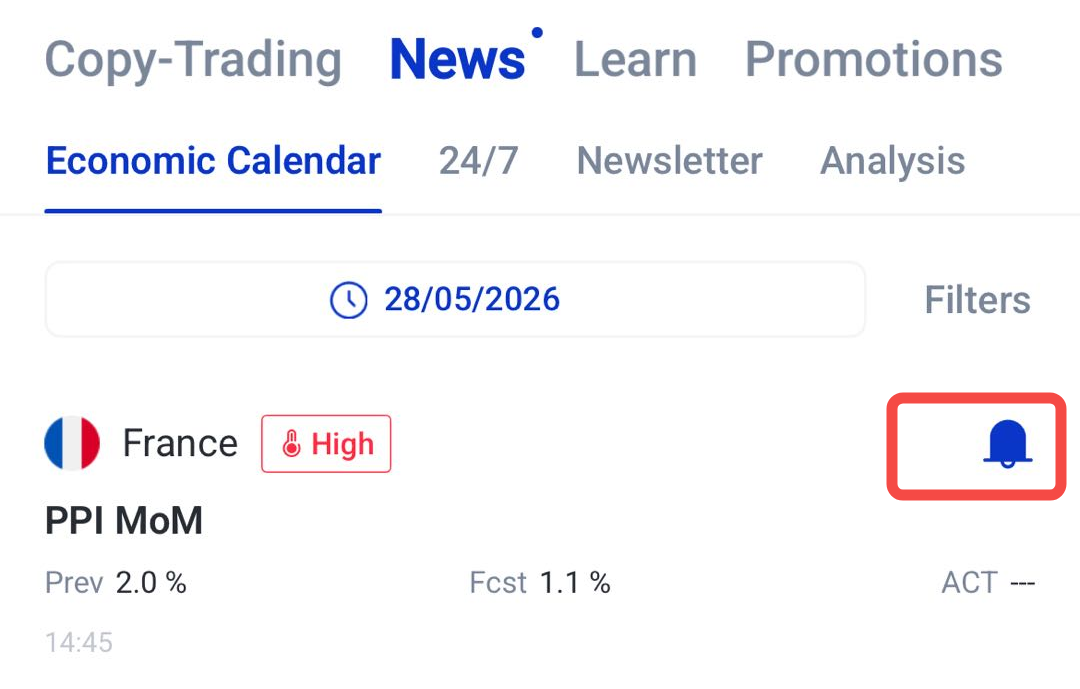
6. Review your open positions before high-impact announcements.
7. Adjust your trading plan if market volatility is expected to increase.
Market Analysis from Trading Central
The VT Markets app provides access to market analysis from Trading Central, a third-party research provider. These reports may include market commentary, chart analysis, technical views, price levels, and possible market scenarios.
Trading Central analysis can be used as an additional reference when researching a market. It can help traders compare their own chart view with external analysis.
However, these reports should not be treated as guaranteed trading signals. Traders should always do their own research and manage risk carefully.
How to Use Trading Central Analysis on the VT Markets App
1. Open the VT Markets app.
2. Select the instrument you want to review.
3. Open the chart or instrument details page.
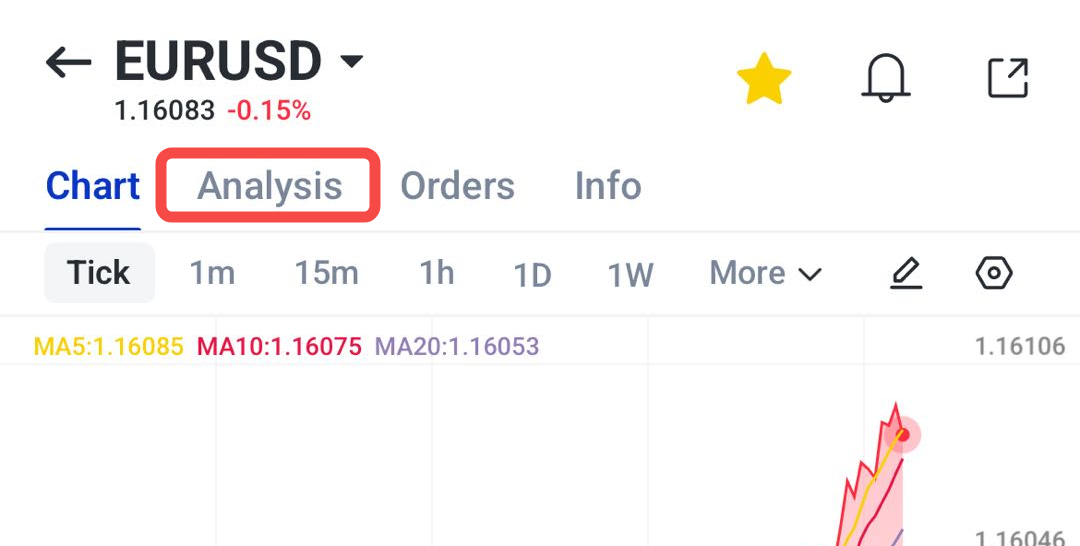
4. Tap the Analysis section.
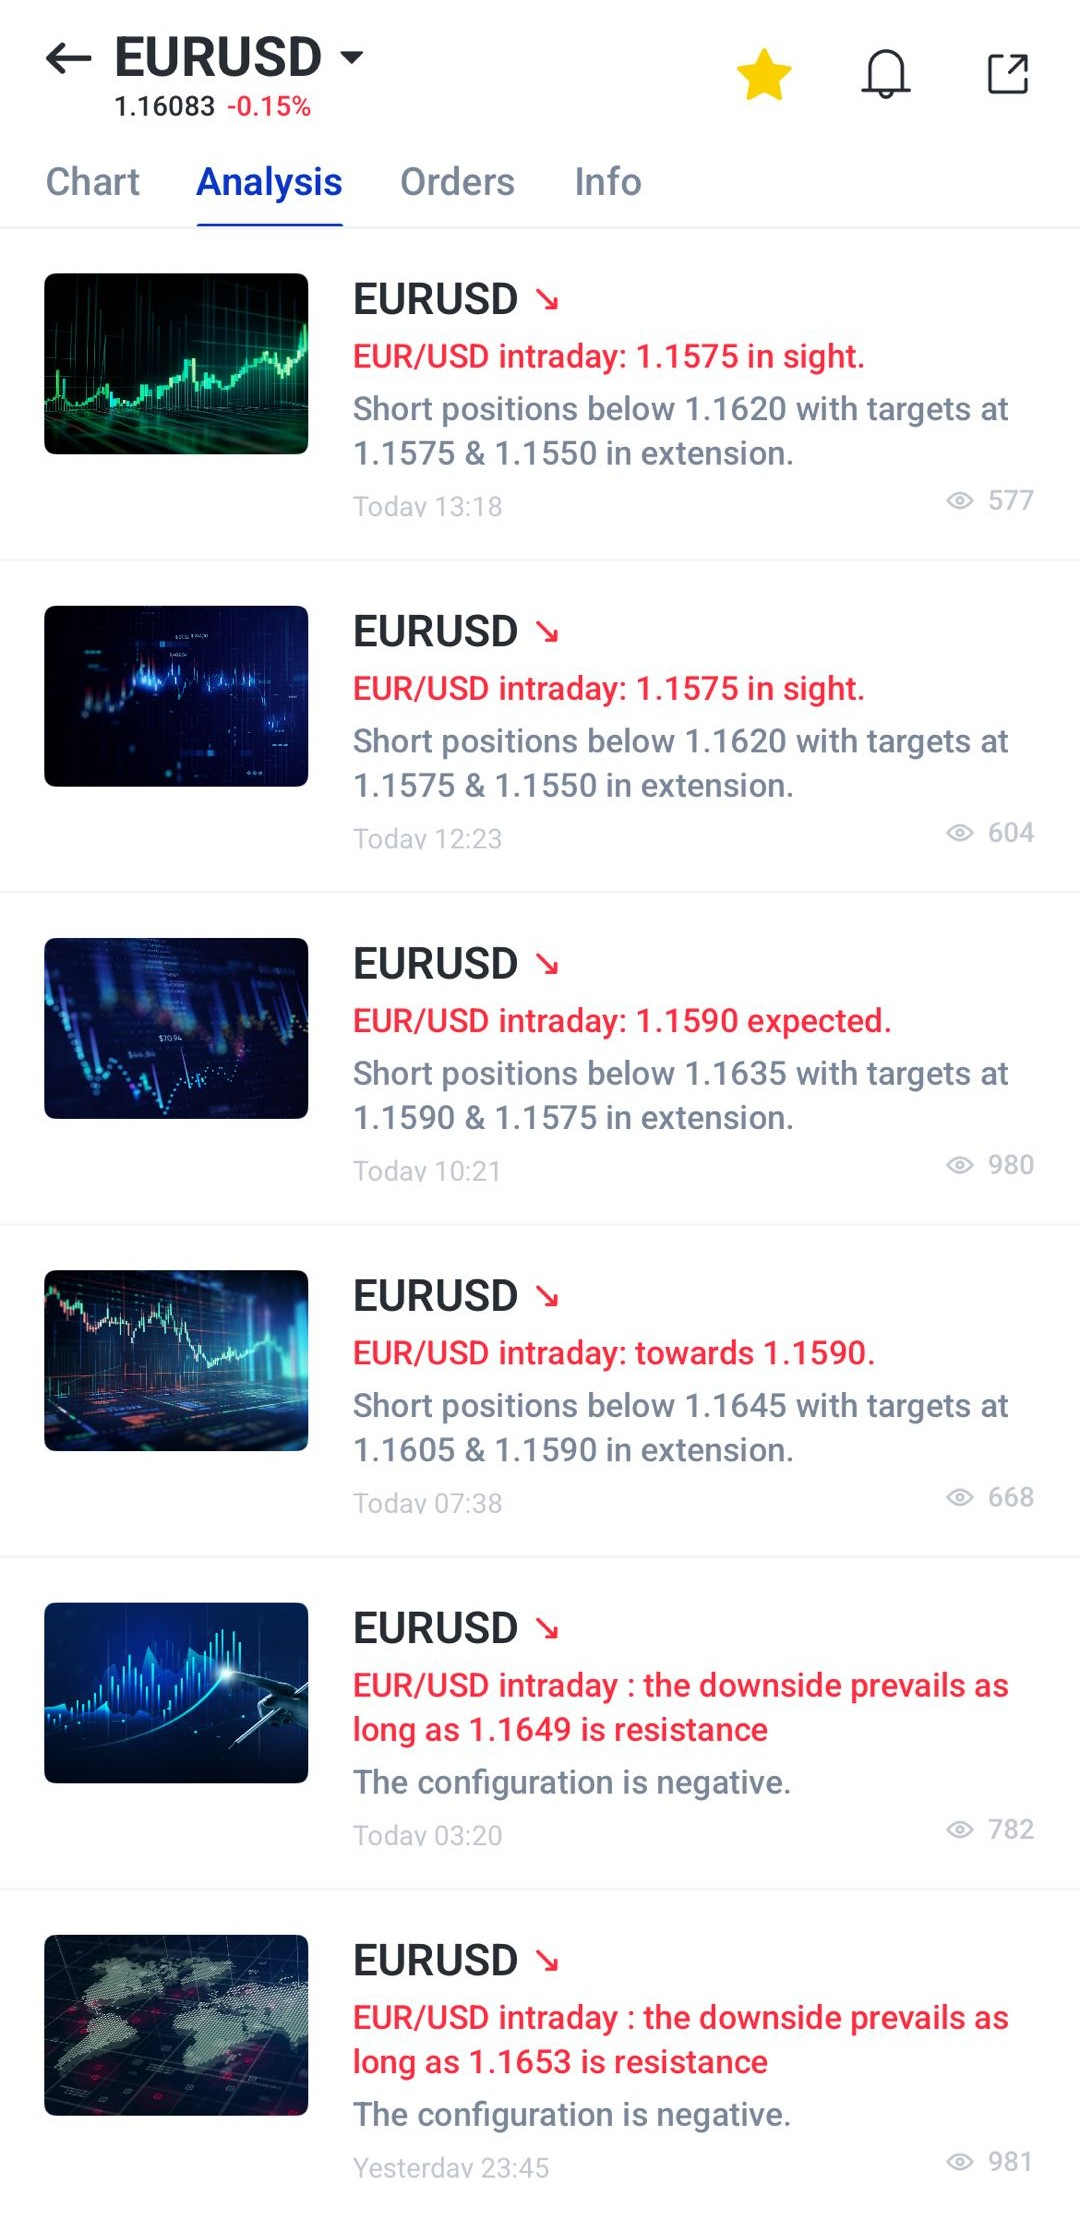
5. Choose the relevant Trading Central report or market update.
6. Review the technical view, chart levels, and market commentary.
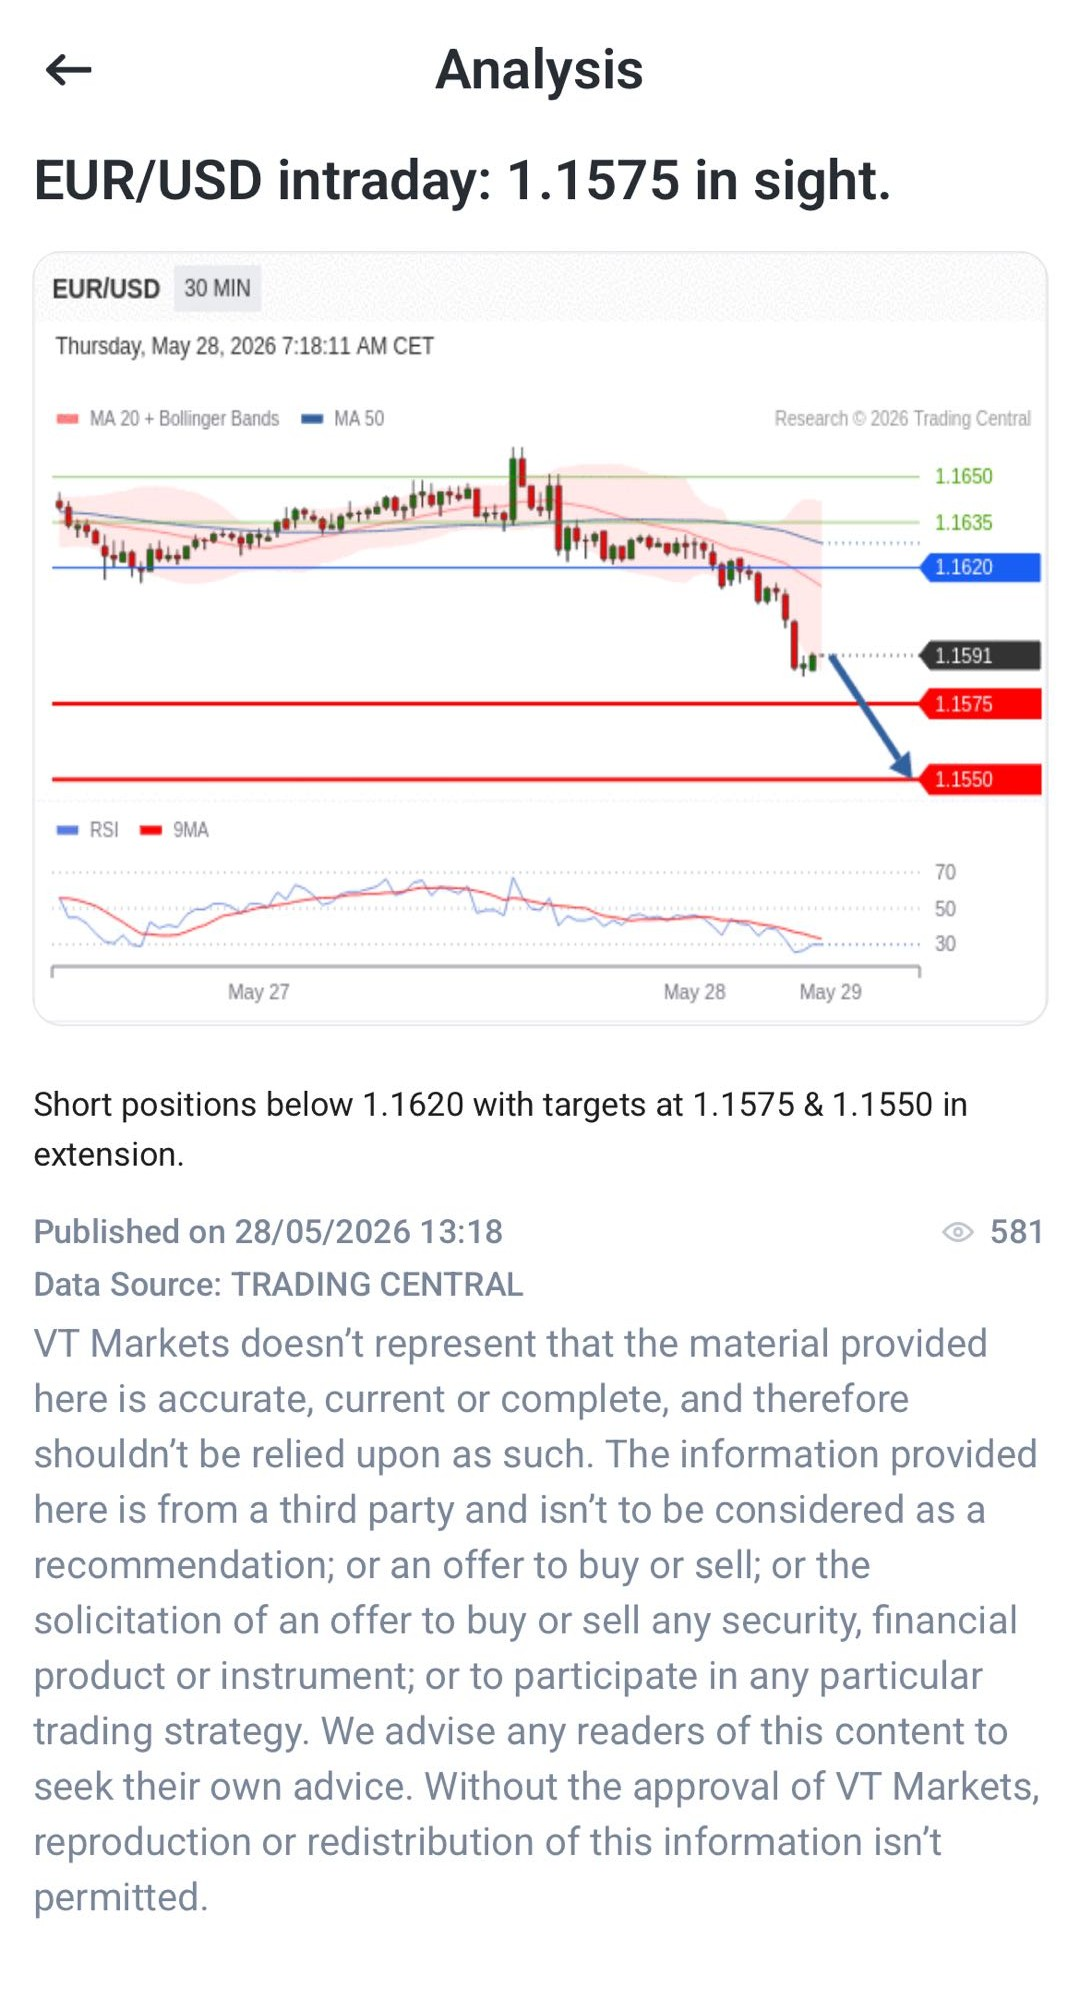
7. Compare the analysis with your own chart review.
8. Use the information as an additional reference when planning or managing trades.
Two-Factor Authentication
Two-factor authentication, also known as 2FA, adds another layer of security to your account. When enabled, users need to provide a verification code in addition to their login details.
This can help reduce the risk of unauthorised access, especially if a password is compromised. Traders should also use a strong password and avoid sharing account details with others.
How to Enable Two-Factor Authentication on the VT Markets App
1. Open the VT Markets app.
2. Go to the dashboard or main menu.
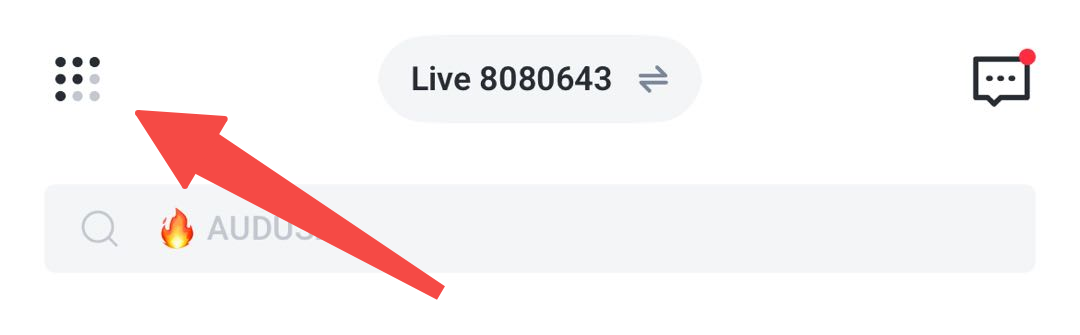
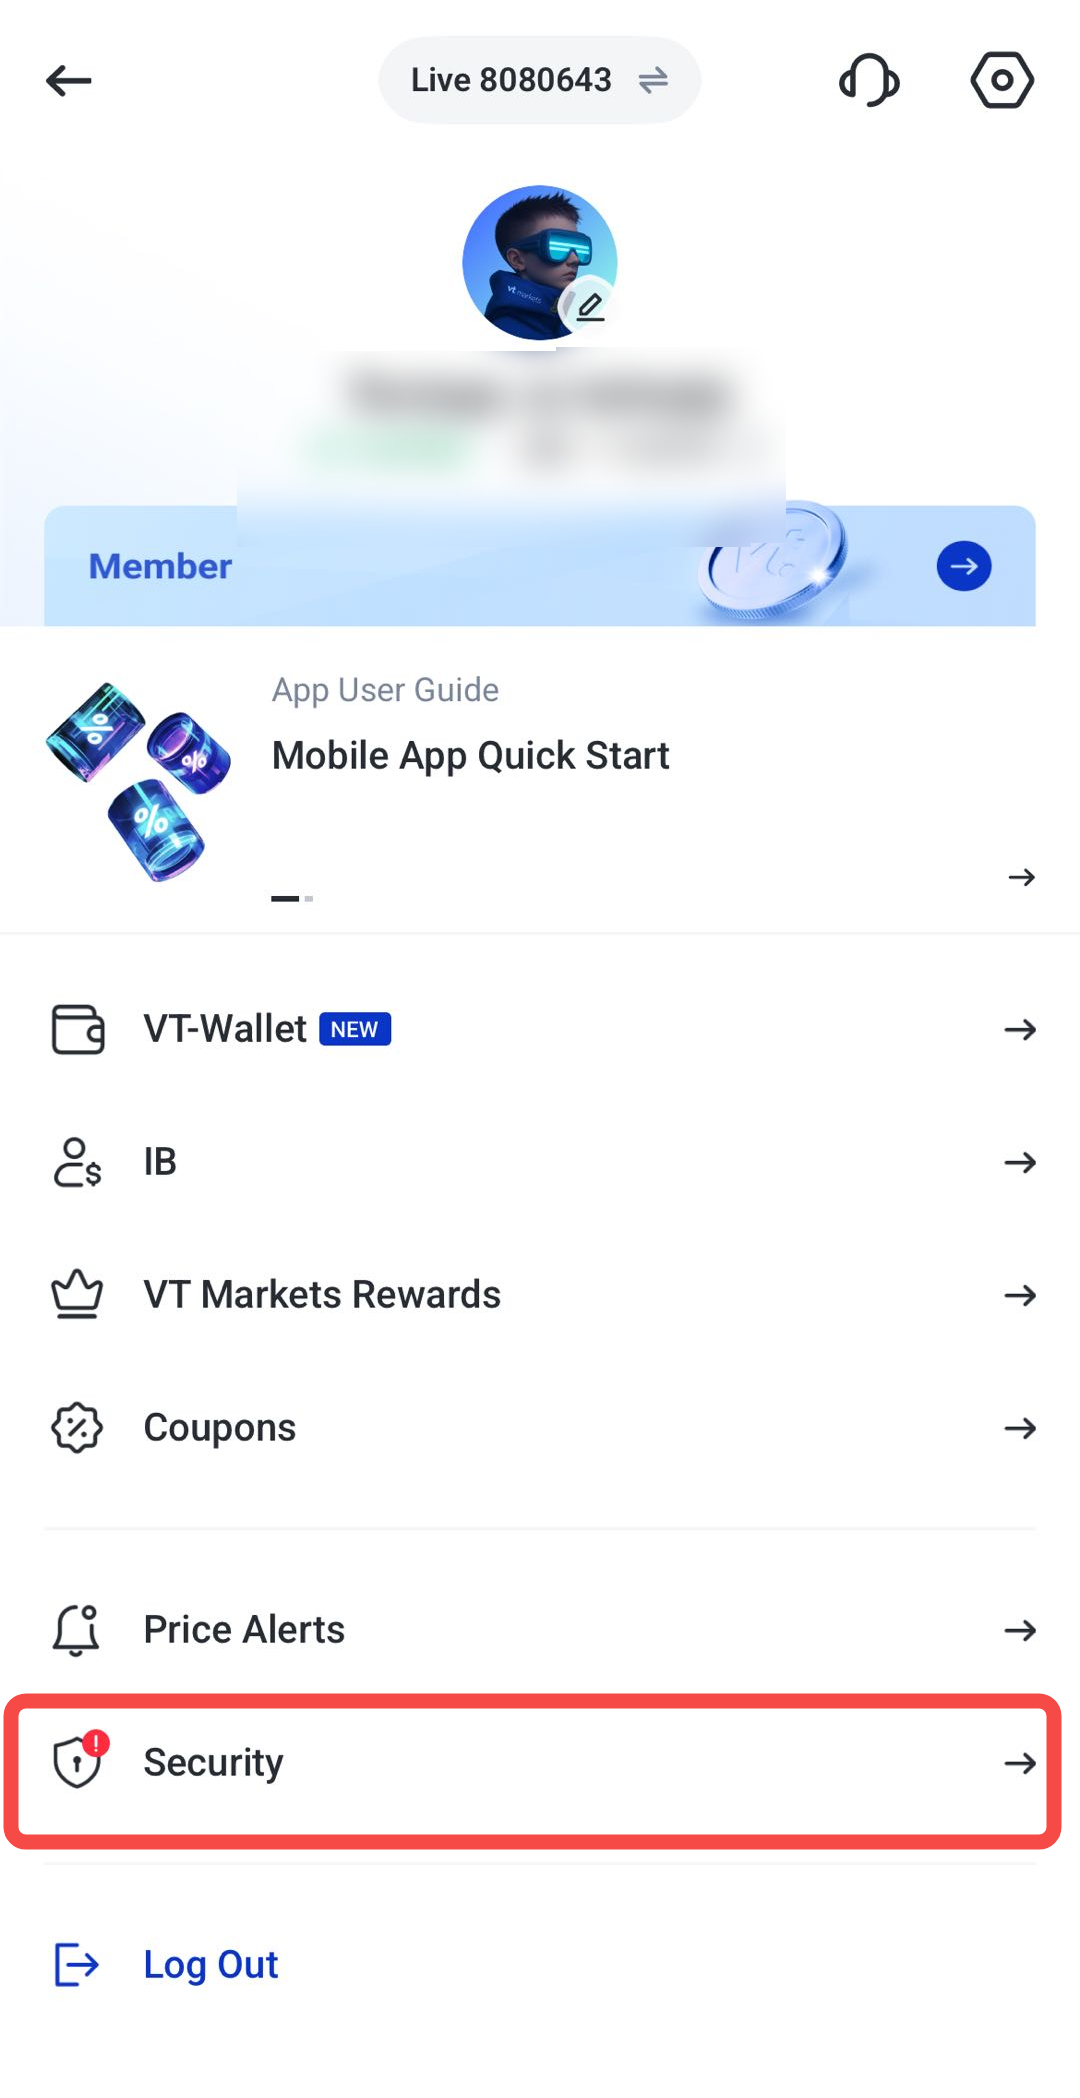
3. Select Security
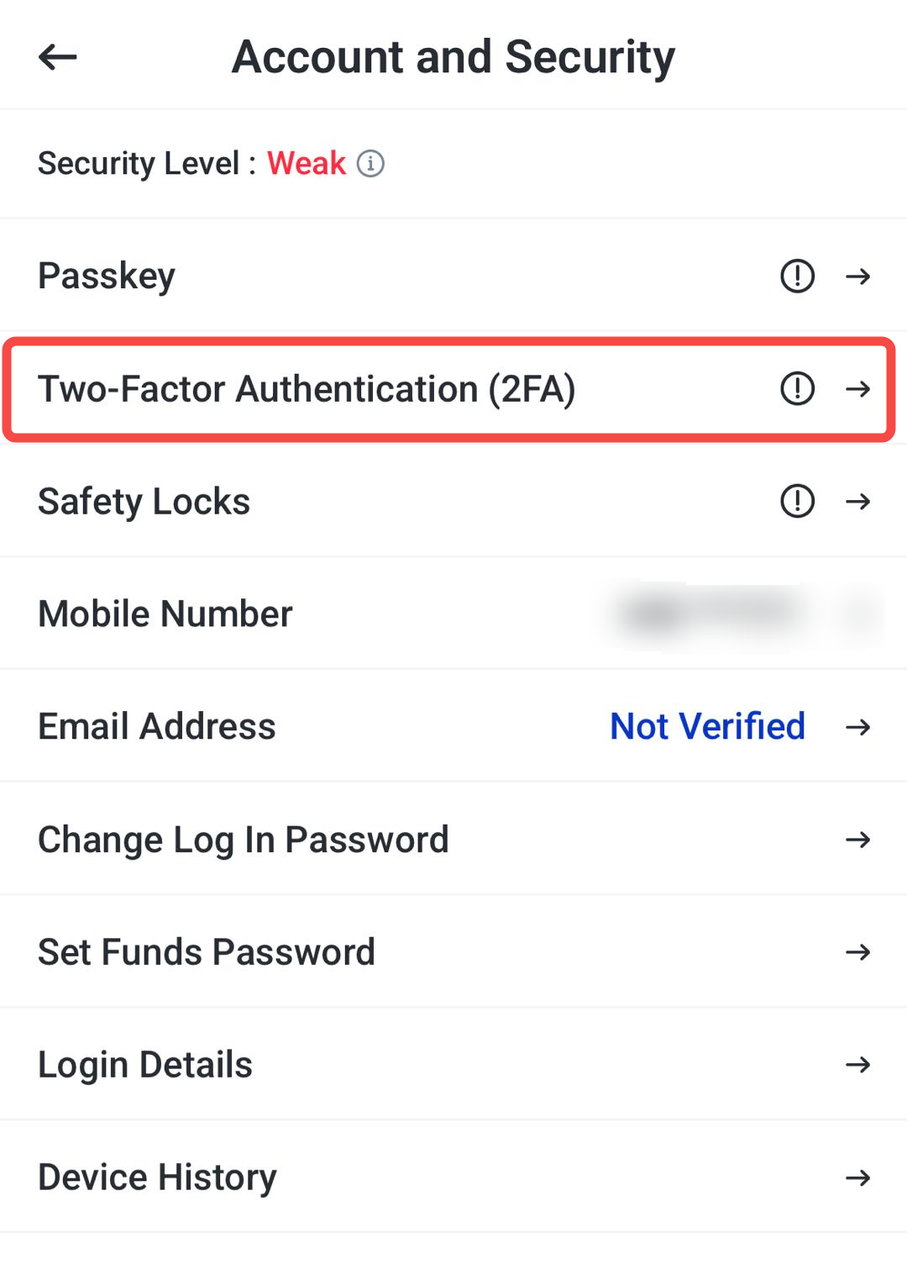
4. Choose Two-Factor Authentication.
5. Tap Enable.
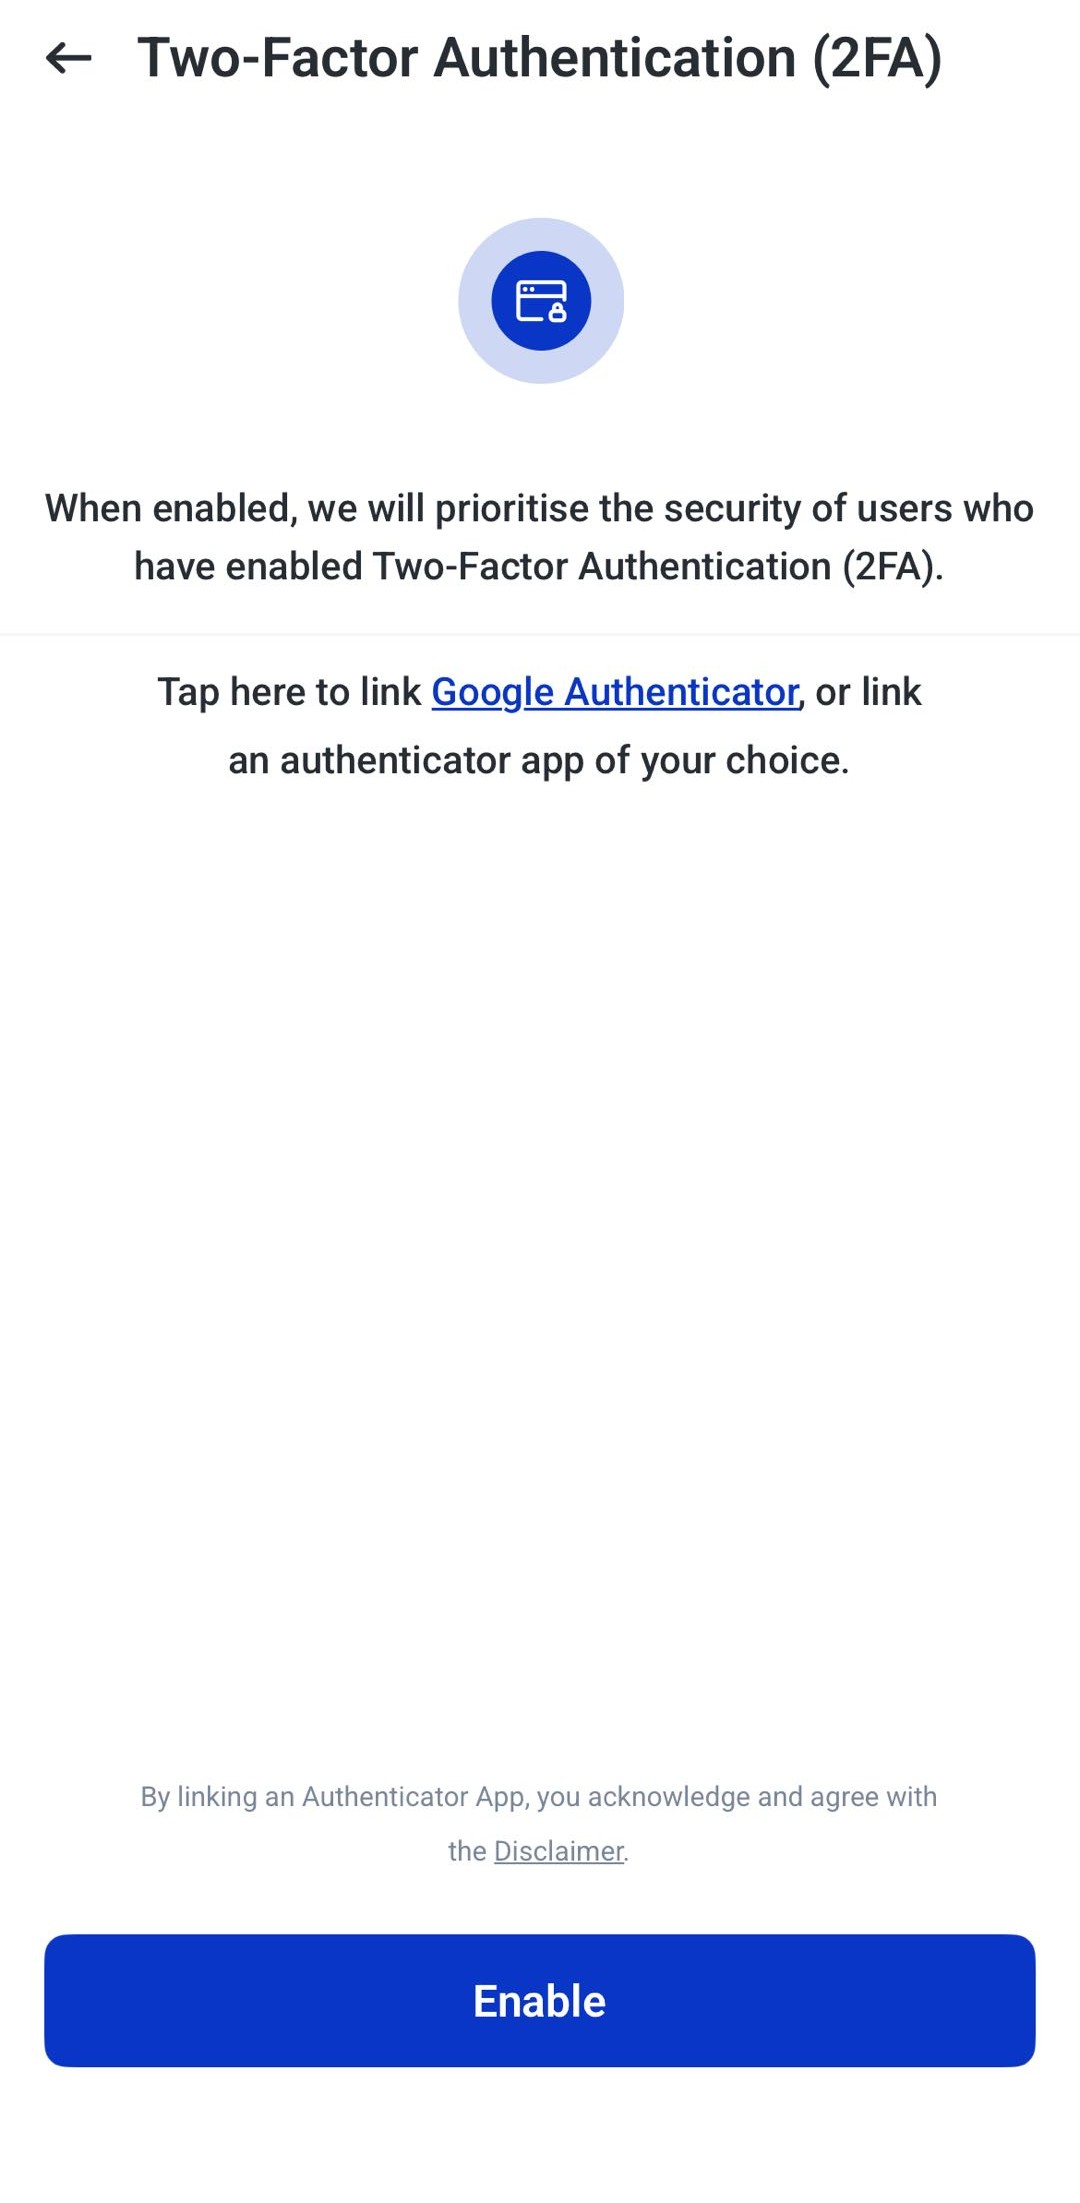
6. Follow the instructions to link an authenticator app, such as Google Authenticator.
7. Enter the verification code generated by the authenticator app.
8. Confirm the setup.
9. Use the verification code when logging in or completing selected security actions.
For more detailed information on how to setup the authenticator, read this article: VT Markets App Security Settings Guide: 2FA, Passkey, Safety Locks, and Passwords
Frequently Asked Questions
What features are available in the VT Markets app?
The VT Markets app includes features such as watchlists, demo and live account access, charting tools, TradingView integration, technical indicators, one-tap trading, Economic Calendar, Trading Central analysis, account management tools, and two-factor authentication.
Can I use a demo account on the VT Markets app?
Yes. The VT Markets app supports demo account access where available. A demo account allows traders to practise trading with virtual funds before using a live account.
Does the VT Markets app have TradingView charts?
Yes. The VT Markets app includes TradingView chart integration, allowing traders to use advanced charting tools, indicators, and drawing tools for market analysis.
What is the watchlist used for?
The watchlist allows traders to save selected instruments and monitor them more easily. It helps traders focus on markets they follow regularly instead of searching through the full instrument list each time.
Can I set alerts in the VT Markets app?
Yes. Traders can set alerts where available to monitor selected price levels or important market events. Alerts can help traders stay informed without checking the app constantly.
What is the Economic Calendar used for?
The Economic Calendar helps traders track upcoming market events such as inflation reports, employment data, central bank decisions, and other economic releases that may affect market movement.
Is Trading Central analysis available in the VT Markets app?
Yes. The VT Markets app provides access to Trading Central analysis, which may include market commentary, technical views, chart levels, and possible market scenarios.
Does the VT Markets app include technical indicators?
Yes. The app includes technical indicators that can help traders analyse price movement, market trends, momentum, and volatility. Common examples include RSI, MACD, Bollinger Bands, and Moving Averages.
Is one-tap trading suitable for beginners?
One-tap trading can make order placement faster, but beginners should use it carefully. It may be better to review orders manually until they are familiar with the platform and trading process.
How can I protect my VT Markets app account?
Traders can improve account security by enabling two-factor authentication, using a strong password, keeping login details private, and reviewing security settings regularly.








