





Key Takeaways:
- The Nikkei 225 is a price-weighted index of 225 large Japanese companies on the Tokyo Stock Exchange Prime Market.
- When you trade Nikkei 225 CFDs, you speculate on the index level without owning shares, and you can go long or short just as easily.
- Four constituents carry roughly a third of the index, so single-stock news moves the whole market.
- Costs come from the spread, overnight financing and dividend adjustments.
- Position sizing, not entry timing, is the control that keeps a leveraged account alive.
Japan’s benchmark has been one of the most active markets of the past two years.
The Nikkei 225 closed at 64,611.15 on 24 July 2026, down 2.73%, or 1,811.45 points. During the preceding 52 weeks, it traded as high as 72,831.73 on 22 June 2026 and as low as 39,850.52 on 4 August 2025.
That range holds real opportunity and real risk in equal measure. This guide explains how to trade Nikkei 225 CFDs properly, with worked numbers at every stage.
At VT Markets, index CFDs sit alongside forex, commodities and shares on MetaTrader 4 and MetaTrader 5, so the mechanics will feel familiar if you already trade currencies.
What The Nikkei 225 Is And How CFDs Track It
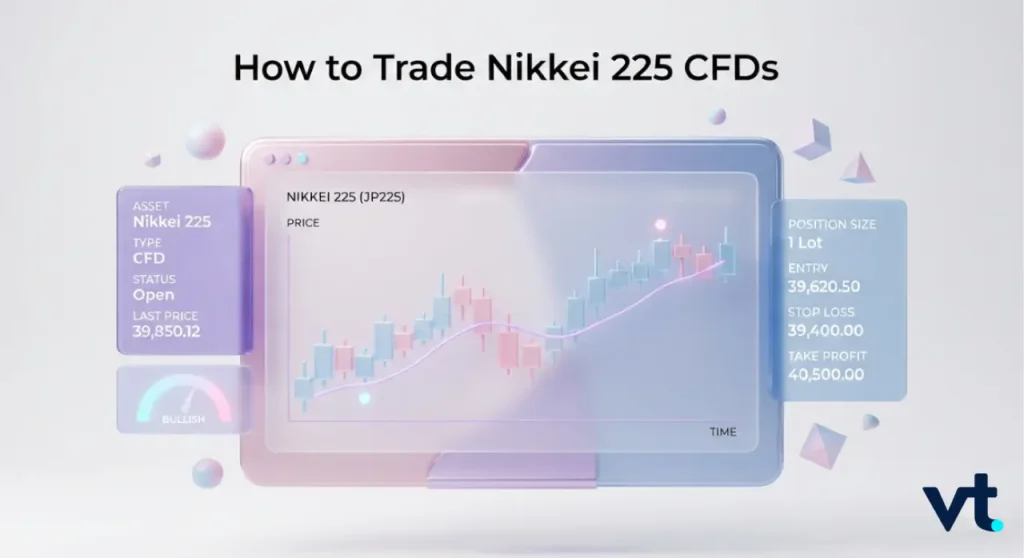
Before placing a trade, we must know what we are actually tracking. The section below covers how the index is constructed and reviewed. Next, we look at why price weighting sets the Nikkei apart from the TOPIX ( Tokyo Stock Price Index). Subsequently, we explore what a Nikkei 225 CFD represents, and how cash index CFDs compare with futures-based ones.
How The Index Is Constructed And Reviewed
The Nikkei Stock Average began on 7 September 1950 and is updated every five seconds during Tokyo hours. Constituents come from domestic common stocks on the Tokyo Stock Exchange Prime Market, selected on liquidity and sector balance.
- Periodic reviews fall in April and October.
- Extraordinary replacements fill vacancies from delistings or mergers.
- A weight cap applies above 10%, measured at end-January or end-July.
- A divisor absorbs splits and constituent changes to keep the series continuous.
Why Price Weighting Makes The Nikkei Behave Differently From The TOPIX
Most modern indices weigh through market capitalisation. The Nikkei weighs by share price, so an expensive mid-sized stock can outrank a corporate giant.
| Constituent | Approximate weight (Jan 2026) |
| Advantest | 10.7% |
| Fast Retailing | 9.4% |
| Tokyo Electron | 7.7% |
| SoftBank Group | 5.7% |
| Top four combined | ≈33.5% |
Source: Nikkei 225 Index Profile, Nikkei Indexes; TOPIX Index Overview, Japan Exchange Group (JPX).
TOPIX spreads risk across the whole Prime Market and typically moves less sharply.
What A Nikkei 225 CFD Represents
A Nikkei 225 CFD exchanges the difference in the index level between your open and your close. No shares change hands.
- Go long or short with equal ease.
- Post margin, not full notional value.
- Contracts are quoted in Japanese yen, then converted at close.
- Symbols vary: JP225, JPN225 and Japan 225 are the same underlying.
Cash Index CFDs Compared With Futures-Based CFDs
Check which variant your platform lists before you trade Nikkei 225 CFDs, because they charge you differently.
| Feature | Cash index CFD | Futures-based CFD |
| Pricing reference | Spot index | Nearest futures contract |
| Spread | Tighter in core hours | Generally wider |
| Overnight cost | Daily swap | Priced into the future |
| Dividend adjustment | Yes | No |
| Expiry | None | Quarterly roll |
| Suits | Intraday, short swing | Multi-week positions |
How To Trade Nikkei 225 CFDs Step By Step
Navigating CFD trading across multiple assets is simpler than it looks. Here is how to execute a trade from start to finish: choose your instrument, size your position, pick your direction, set your risk limits, and manage it through to the close.
Choosing The Instrument And Checking Contract Specifications
Read the specification sheet before you place anything. Traders who skip this are the ones surprised by their first swap charge:
- Contract size (value per index point per lot)
- Minimum and maximum lot size
- Tick size
- Margin percentage or maximum leverage
- Trading hours and daily maintenance break
- Swap long and swap short rates
Sizing The Position And Calculating Margin
Work backwards from risk, never forwards from ambition. Assume a common specification of ¥100 per index point per lot.
- Account balance: USD 5,000
- Risk per trade: 1%, so USD 50 (about ¥8,190 at 163.80)
- Stop distance: 300 points
- Risk per lot: 300 × ¥100 = ¥30,000
- Correct size: ¥8,190 ÷ ¥30,000 = 0.27 lots, rounded to 0.25 lots
Deciding Direction And Selecting An Order Type
Direction should follow a written reason. That might be a Nikkei 225 analysis of the daily trend, a reaction to Bank of Japan guidance, or a divergence against US futures overnight.
- Market order: immediate fill, best when speed matters.
- Limit order: fills on a pullback into your level.
- Stop order: fill on a breakout beyond your level.
- Pending order with expiry: cancels itself if the setup goes stale.
Setting Stop Loss And Take Profit Levels
Attach both at entry. Index CFDs move fast enough that adding protection later is usually too late. Place stops beyond structure, not on round numbers where liquidity clusters.
Size stops from Average True Range, not a fixed point count. Target a minimum 1:2 risk-to-reward ratio. Treat a stop as a trigger, not a guarantee.
Managing And Closing The Position
Once filled, the work is administration rather than prediction. Move to breakeven after price travels roughly your initial risk distance, bank partial profit at the first objective, and trail the remainder.
Close manually before the weekend if a Monday gap would trouble you. Most losses come from unmanaged trades, not bad entries.
Contract Specifications, Margin And The Cost To Trade Nikkei 225 CFDs
Before heading into Nikkei 225 CFD trading, you need to understand the core mechanics that drive your costs and risk. Below, we break down contract sizing, margin requirements, spreads, financing, dividend adjustments, and a practical profit and loss example to show how these elements work together.
Contract Size, Tick Value And Pip Value
Index CFDs are quoted in points, so the maths stays simple. At ¥100 per point:
- 1 lot, 250-point move = ¥25,000
- 0.5 lots, 250-point move = ¥12,500
- 0.1 lots, 250-point move = ¥2,500
Margin Requirement And Effective Leverage
Margin is a deposit, not a cost. A 1% requirement equals 100:1 leverage. At an index level of 64,400:
| Lots | Notional (¥) | Notional (USD at 163.80) | Margin at 1% |
| 0.1 | 644,000 | 3,932 | USD 39 |
| 1.0 | 6,440,000 | 39,316 | USD 393 |
| 2.0 | 12,880,000 | 78,632 | USD 786 |
Spread And How It Widens Outside Core Hours
The spread is tightest while Tokyo cash equities are open, because that is when the constituents are actually pricing. Expect it to widen during the midday break, between the Tokyo close and the European open, around Bank of Japan announcements, on Japanese public holidays, and just after the weekend reopen.
Overnight Financing And Swap On Index CFDs
Financing applies to the full notional, not to your margin. With the Bank of Japan’s policy rate at 1.0%, raised on 16 June 2026 and the highest since 1995, carry is no longer negligible.
- Long positions are usually debited.
- Short positions may be credited or debited depending on the rate spread.
- Wednesday typically carries a triple swap for the weekend.
Dividend Adjustments On Cash Index Positions
When a constituent goes ex-dividend, the index drops mechanically. Cash index CFDs correct this, crediting longs and debiting shorts. Japanese ex-dividend dates cluster in late March and late September.
A Worked Profit And Loss Example
A trader buys 2 lots at 64,400, stop at 64,100, target at 64,900.
| Scenario | Move | Calculation | Result |
| Target hit | +500 pts | 500 × ¥100 × 2 | +¥100,000 (≈ USD 610) |
| Stop hit | -300 pts | 300 × ¥100 × 2 | -¥60,000 (≈ USD 366) |
| Margin posted | n/a | 1% of ¥12,880,000 | ¥128,800 (≈ USD 786) |
A 0.78% index move returned 77% on margin posted. Reverse the direction and the same arithmetic removes almost half the deposit. That asymmetry is the entire lesson.
Trading Hours To Trade Nikkei 225 CFDs And Session Behaviour
Timing is everything when trading the Nikkei 225. Here is a look at how trading hours, session behaviors, overnight gaps, and Japanese public holidays impact your execution.
Tokyo Cash Session And The Midday Break
Tokyo runs 09:00 to 11:30 JST, then 12:30 to 15:30 JST.
On the Tokyo Stock Exchange cash-equity market, continuous afternoon trading ends at 15:25 JST. It is then followed by a five-minute pre-closing period and a closing auction at 15:30 JST.
The structure was introduced on 5 November 2024. It does not determine Nikkei 225 CFD trading hours, which are broker- and product-specific.
How CFD Hours Extend Beyond The Underlying Exchange
CFD quotes follow the futures market when Tokyo cash is shut, which is why you can trade Nikkei 225 CFDs for close to 24 hours on weekdays.
| Window (JST) | Window (GMT) | Character |
| 09:00–11:30 | 00:00–02:30 | Highest liquidity, tightest spreads |
| 11:30–12:30 | 02:30–03:30 | Cash break, thinner pricing |
| 12:30–15:30 | 03:30–06:30 | Afternoon session and closing auction |
| 16:00–22:00 | 07:00–13:00 | European lead, moderate volume |
| 22:00–05:00 | 13:00–20:00 | US overlap, event-driven moves |
Overnight Gaps And Why They Occur
The index reprices while Tokyo sleeps. Wall Street results, chip news and yen moves are absorbed before the open, so gaps are routine. Weekends, US earnings, central bank decisions and geopolitical headlines are the usual causes.
Overlap With European And US Sessions
The 15:30 JST close lands in the early European morning, and the US open arrives long after Japanese cash equities finish. Volume thins through the European afternoon, then returns as US futures pick a direction.
Japanese Public Holidays And Thin Liquidity
Japan observes 15 to 20 public holidays a year, more than most developed markets. Cash equities close, the CFD keeps quoting off futures, spreads widen and single orders push price further than usual. Reduce size or stand aside.
What Drives Nikkei 225 Price Movement
Understanding what drives the Nikkei 225 helps you anticipate market shifts. Here is a look at the key macro factors, currency relationships, and economic releases that move the index.
The Yen Relationship And Exporter Earnings
The yen sat near 163.8 per US dollar on 24 July 2026, a four-decade low. A weaker yen inflates translated earnings for carmakers and machinery firms, which is why the index and USD/JPY often rise together. A sharp yen rally does the reverse.
Bank Of Japan Policy And Yield Curve Decisions
The BoJ Policy Board meets eight times a year, with Outlook Reports in January, April, July and October.
- The policy rate decision, now 1.0% after the June 2026 hike
- The vote split, which signals the next move
- The Governor’s press conference, often more market-moving than the statement
- Guidance on JGB purchase reductions
Heavyweight Constituents And Single-Stock Influence
One company can swing the whole index. On 15 July 2026, Advantest contributed approximately 418.8 points to the Nikkei 225’s advance, while Fast Retailing detracted approximately 77.2 points.
Track the top ten names’ earnings dates as closely as the macro calendar.
US Market Correlation And Overnight Lead
Tokyo often opens as a reaction to the previous Wall Street session, especially in semiconductors. Nasdaq strength arrives as a gap higher, a chip-led sell-off as a gap lower.
Japanese Economic Releases Worth Tracking
- Tankan survey, quarterly business sentiment
- Tokyo and national CPI
- GDP, first and revised readings
- Trade balance and export volumes
- Machinery orders and industrial production
Earnings Season And Index Review Dates
Japanese reporting clusters in late April, late July, late October and early February. April and October reviews force tracking funds to rebalance, creating short bursts of volume.
Common Approaches To Trading The Nikkei 225
Different trading styles require different strategies. Let’s briefly explore five common approaches to trading the Nikkei 225, from intraday momentum and trend following to range trading, BoJ event strategies, and portfolio hedging.
1. Intraday Trading Around The Tokyo Open
The first thirty minutes carry the heaviest volume as overnight news is priced in. Traders who trade Nikkei 225 CFDs intraday often let the opening auction settle, then follow whichever side of the opening range holds. Keep a trade Nikkei 225 CFDs chart on five minutes alongside the daily for context.
2. Trend Following Across Sessions
Higher-timeframe trends persist well here, particularly during sustained yen moves:
- Define trend on the daily chart with 50 and 200-period moving averages
- Enter on pullbacks on the 1-hour chart
- Trail stops below successive swing lows
- Ignore counter-trend signals until daily structure breaks
3. Range Trading During The Asian Session
Between the Tokyo close and the European open, price often drifts inside a narrow band. Fade the edges with tight stops, and abandon the idea the moment a catalyst lands.
4. Trading Around Bank Of Japan Announcements
Volatility on BoJ days is exceptional. On 24 July 2026, the Nikkei Stock Average Volatility Index reached an intraday high of 40.47, before closing at 32.88, down 5.57% from the previous session.
Trade the reaction rather than the release, halve normal size, or stay flat.
5. Using Short Positions To Hedge Existing Exposure
A short index CFD offsets drawdown on Japanese equity holdings without forcing a sale. Match the hedge notional to the exposure covered, and treat it as insurance with a running cost.
Risk Management When You Trade Nikkei 225 CFDs
Effective risk management is essential when trading leveraged indices. Below explains how to navigate leverage, gap risk, margin calls, currency exposure, and position sizing to protect your capital.
How Leverage Magnifies Both Outcomes
At 100:1, a 1% adverse move consumes the entire margin posted. This is why Is Nikkei 225 a good investment? is the wrong question for a CFD trader. CFDs are leveraged instruments with a daily holding cost, not buy-and-hold investments.
Gap Risk And The Limits Of A Standard Stop Loss
A standard stop closes at the next available price, not your chosen price. If the index gaps 800 points over a weekend, the fill sits below your level. Keep weekend size smaller.
Guaranteed Stops And Where They Apply
Some jurisdictions and account types offer guaranteed stops. Where available, they fill at your exact level regardless of gaps, in exchange for a wider spread or a fee.
Margin Close-Out And Negative Balance Protection
- Margin level = equity ÷ used margin × 100
- A margin call warns as that ratio falls
- Stop out closes positions automatically at the broker’s threshold
- Negative balance protection, where offered, caps losses at deposited funds
Currency Exposure When The Account Is Not JPY Denominated
Yen profits convert at close. A ¥100,000 gain is worth about USD 610 at 163.80 and about USD 645 at 155.00. The trade result is identical; the deposit outcome is not.
Position Sizing As The Primary Control
- Risk a fixed 1% to 2% of equity per trade
- Cap total open index risk at 5% of equity
- Halve size before BoJ meetings and Japanese holidays
- Log every trade, including why you chose that size
Frequently Asked Questions (FAQs)
Q1: How do I start trading Nikkei 225 CFDs?
Open and verify a live account, fund it, then find the Japan index symbol in MetaTrader 4 or MetaTrader 5. Read the contract specification, practise on demo, then start with the smallest lot size while you learn how the instrument behaves.
Q2: What are the trading hours for Nikkei 225 CFDs?
Tokyo cash equities trade 09:00 to 11:30 and 12:30 to 15:30 JST. Index CFDs quote for close to 24 hours on weekdays via the futures market, with a short daily maintenance break set by each provider.
Q3: What is the contract size for a Nikkei 225 CFD?
It varies by broker. A common specification is ¥100 per index point per standard lot, so a 100-point move produces ¥10,000 per lot. Always confirm the figure on your own platform before sizing.
Q4: Why does the Nikkei 225 rise when the yen weakens?
The index is heavy with exporters. A weaker yen raises the yen value of overseas revenue and improves competitiveness abroad, so weaker-yen periods have historically coincided with stronger Nikkei performance.
Q5: Can I trade the Nikkei 225 outside Japanese market hours?
Yes. Pricing follows Nikkei futures once Tokyo cash closes, so positions can be opened and closed through European and US sessions. Spreads are wider outside Tokyo hours, so adjust size accordingly.
Start Trading Japan’s Benchmark With VT Markets
Japan’s benchmark rewards preparation over instinct. Traders who trade Nikkei 225 CFDs read the contract specification, size from a risk figure rather than a target, and know what a weekend gap would cost before the weekend arrives.
With VT Markets, you can trade Nikkei 225 CFDs alongside forex, commodities and shares on MetaTrader 4 and MetaTrader 5, with transparent contract specifications and the tools to manage leveraged positions properly.
Open an account, start on demo, and build the process before you scale the size.








