

Key Points
- The S&P 500 closed 0.22% lower at 7,483.23 as technology and semiconductor shares came under pressure.
- The Nasdaq Composite fell 0.66%, while the Dow Jones Industrial Average slipped 0.03%.
- The PHLX Semiconductor Index lost 6.3%, reflecting renewed caution around AI valuations and technology spending.
- Meta gained 8.8% after reports that it is developing a cloud business to sell excess AI computing capacity, helping to limit broader index losses.
- Traders are watching the June US employment report for fresh signals on labour market strength and the Federal Reserve’s policy outlook.
US stock futures edged lower on Thursday as investors remained cautious ahead of the June employment report, which is expected to provide fresh signals on labour market conditions and the Federal Reserve’s interest-rate outlook.
The cautious tone followed a weaker Wednesday session on Wall Street. The S&P 500 fell 0.22% to 7,483.23, the Nasdaq Composite declined 0.66%, and the Dow Jones Industrial Average slipped 0.03%.
Technology and semiconductor shares led the decline as investors reassessed the durability of the AI-driven rally. Micron Technology and Sandisk each fell 10.6%, while AMD lost 6.9%, Intel declined 9%, and Applied Materials dropped 10%.
Meta helped limit broader losses after gaining 8.8% on reports that the company is developing a cloud business to sell excess AI computing capacity. The mixed performance highlighted increasingly uneven momentum within the technology sector.
Why Traders Are Watching This
The semiconductor sell-off has renewed focus on whether weakness in chip shares will remain concentrated or begin to affect the broader US equity market.
The S&P 500 and Nasdaq recently recorded their strongest quarterly advances since 2020, supported by optimism around artificial intelligence and technology spending. However, those gains have also increased sensitivity to elevated valuations and uncertainty over how quickly data-centre investment will translate into earnings.
The decline in chip and memory shares therefore represents an important test for the AI-led rally. If semiconductor selling begins to ease, the broader index may stabilise. If weakness persists, technology could remain a drag even if other sectors continue to perform well.
Employment Data Could Shape the Next Move
The June US employment report is the next major macroeconomic catalyst for the S&P 500.
Fed Chair Kevin Warsh has recently expressed confidence in the longer-term outlook for employment and economic growth, suggesting that the current technology-driven transformation remains in its early stages.
His comments provide a constructive counterpoint to concerns about softer private-sector hiring. However, the immediate market reaction will depend on whether payroll growth, wages and unemployment data support that optimism.
A stronger employment reading could reinforce expectations that the Federal Reserve has room to maintain or tighten its policy stance. Higher rate expectations may place additional pressure on growth shares, particularly technology companies with elevated valuations.
A weaker result could support equities if it lowers Treasury yields and reduces expectations of further tightening. However, a sharp deterioration in labour conditions could also raise concerns about economic growth, creating a more mixed response across sectors.
Key Trading Levels
| Level | What Traders Are Watching |
| 7,620 | Previous major swing high and wider breakout level |
| 7,600 | Key psychological resistance |
| 7,560 | Secondary resistance from previous rebound attempts |
| 7,520 | Near-term resistance and upper consolidation area |
| 7,500 | Round-number pivot |
| 7,484 | Current trading area |
| 7,480 | Immediate support near the current session low |
| 7,440 | Initial downside support |
| 7,400 | Key psychological and technical support |
| 7,360 | Recent rebound base and wider support |
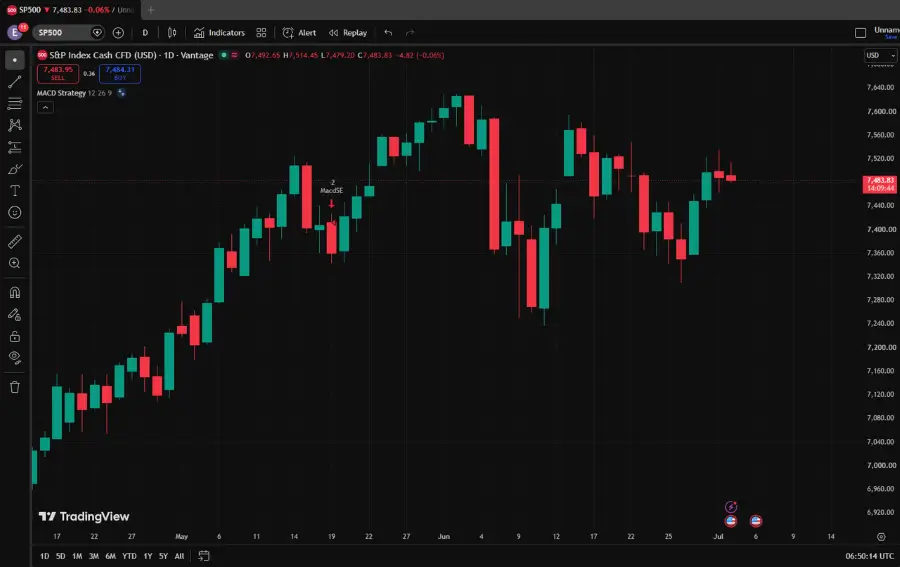
SP500 is trading near 7,484, slightly below the 7,500 round-number level. A sustained move above 7,500 would improve the short-term outlook, while a confirmed break above 7,520 could open the way towards 7,560.
A stronger advance beyond 7,560 would place the 7,600 to 7,620 region back in focus. That area contains the previous major swing high and would represent a more meaningful test of the broader uptrend.
On the downside, 7,480 is the first level to monitor. A break below this area could expose 7,440, followed by 7,400 if selling pressure broadens beyond semiconductor shares.
Bullish And Bearish Setups
| Setup | Trigger | Potential Market Reaction |
| Bullish Hold | Remain above 7,480 | Buyers may attempt to reclaim 7,500 |
| Recovery Move | Break above 7,520 | SP500 may advance towards 7,560 |
| Bullish Breakout | Break above 7,560 | Momentum may extend towards 7,600 to 7,620 |
| Range Consolidation | Remain between 7,480 and 7,520 | Price may stay range-bound before employment data |
| Bearish Break | Fall below 7,480 | Sellers may target 7,440 |
| Deeper Correction | Break below 7,440 | SP500 may weaken towards 7,400 or 7,360 |
The bullish scenario depends on SP500 holding above 7,480 and reclaiming 7,500. This would indicate that buyers are continuing to defend the recent rebound despite pressure from semiconductor shares.
A stronger recovery would require a confirmed move above 7,520. A break through that area could bring 7,560 into focus, while a subsequent move above 7,560 may support a wider advance towards 7,600 to 7,620.
The neutral scenario is continued consolidation between 7,480 and 7,520. This would suggest that traders are waiting for clearer direction from employment data, Treasury yields and Fed expectations.
The bearish scenario strengthens if SP500 falls below 7,480. A confirmed break could shift attention towards 7,440. If that support also fails, the index may retreat towards 7,400, followed by the late-June rebound area near 7,360.
Disclaimer
The price levels and trade scenarios above reflect the author’s view at the time of writing and do not represent financial advice or an official recommendation from VT Markets. Traders should conduct their own analysis and manage risk carefully.
Trade SP500 CFDs With VT Markets
The S&P 500 remains closely watched during periods of technology-sector volatility, major economic releases and shifting Federal Reserve expectations.
With VT Markets, traders can access SP500 and other index CFDs alongside forex, gold, oil, share CFDs, ETF CFDs and other global markets through one platform.
VT Markets provides the tools to monitor price action, identify key levels and respond as conditions evolve. Whether SP500 recovers above resistance or extends its pullback, traders can follow the market using advanced charting tools, flexible account options and access to multiple asset classes.
Learn more about trading Indices on VT Markets today.
Why Trade SP500 as a CFD?
CFDs allow traders to take a view on both rising and falling markets without owning the underlying index or its constituent shares.
This can make index CFDs useful during periods of heightened volatility, particularly when employment data, Fed policy, Treasury yields and technology-sector movements influence the broader equity market.
With VT Markets, traders can access SP500 and other major markets through one account, making it easier to monitor cross-market opportunities as they develop.
What To Watch Next
The June US employment report is the immediate catalyst. Traders will focus on payroll growth, wage growth and the unemployment rate for their potential effect on Treasury yields, Fed expectations and equity valuations.
Fed commentary also remains relevant. Chair Kevin Warsh recently said inflation risks had eased while reaffirming the central bank’s commitment to its 2% inflation target.
Semiconductor performance remains the clearest sector signal. If selling pressure in chipmakers begins to ease, SP500 may regain stability above 7,500. Continued weakness could prevent the index from advancing even if market breadth outside technology remains constructive.
For now, 7,480 to 7,520 is the main near-term range. A break above 7,520 would strengthen the recovery outlook, while a move below 7,480 could shift attention towards 7,440 and 7,400.
Frequently Asked Questions
Why did the S&P 500 fall?
The S&P 500 declined as technology and semiconductor shares came under pressure. The PHLX Semiconductor Index lost 6.3%, making chipmakers one of the main drags on the session.
Which stocks pressured the S&P 500?
Micron, Sandisk, AMD, Intel and Applied Materials were among the notable semiconductor decliners. The weakness reflected renewed caution around AI valuations and profit-taking after strong first-half gains.
Why did Meta matter for the index?
Meta gained 8.8% following reports that it is developing a cloud business to sell excess AI computing capacity. Its advance helped offset part of the semiconductor-led decline.
What are the key SP500 levels to watch?
The main near-term levels are 7,480 as immediate support and 7,520 as resistance. A break above 7,520 could bring 7,560 into focus, while a move below 7,480 may expose 7,440.
What is the next catalyst for S&P 500 traders?
The June US employment report is the next major catalyst because it may influence expectations for Federal Reserve policy, Treasury yields and equity valuations.
Does the latest pullback mean the AI rally is over?
Not necessarily. The session reflects pressure in semiconductor shares and a reassessment of valuations, but one decline does not confirm a broader trend reversal. A sustained break below key support and wider weakness beyond technology would provide stronger evidence of a change in market structure.
Start trading now — click here to create your real VT Markets account.


