


Key points
- Gold fell below the US$4,000 level after hitting a seven-month low in the previous session.
- Fading hopes for a near-term US-Iran peace deal raised inflation concerns and supported Fed rate-hike expectations.
- Traders are pricing in a roughly 67% chance of a September rate hike, according to the CME FedWatch Tool.
- XAUUSD remains under pressure near US$3,982, with US$3,970 acting as immediate support.
- US ADP employment data and nonfarm payrolls are the next major catalysts for gold.
Gold extended losses on Wednesday, slipping below US$4,000 an ounce as fading hopes for a near-term US-Iran peace deal reinforced inflation concerns and strengthened expectations of further Federal Reserve rate hikes.
Spot gold was down 0.6% at US$3,981.69 per ounce after hitting its lowest level since last November in the previous session. US gold futures for August delivery also fell 1.1% to US$3,994.40.
For CFD traders, the setup remains active. Gold is now testing a key psychological area, and a sustained move below US$4,000 could keep sellers in control. A recovery back above this level may signal early stabilisation, but buyers still need stronger confirmation.
Why Traders Are Watching This
Traders are watching gold because the market is now reacting to a more hawkish macro setup.
Fading peace prospects between the US and Iran have raised concerns that inflation pressure may stay elevated, especially if energy markets remain sensitive to geopolitical risks. Iran has also said it would not meet with senior US envoys who travelled to the region, reducing hopes for a quick diplomatic breakthrough.
At the same time, Fed rate-hike expectations are building. Cleveland Fed President Beth Hammack said it remains possible that she could support higher interest rates if inflation pressures fail to ease. Traders are now pricing in a roughly 67% chance of a September rate hike, according to the CME FedWatch Tool.
US labour data also remains important. Job openings edged up to 7.594 million in May, while hiring stayed soft at 5.170 million. That suggests labour demand is still stable enough for the Fed to keep policy tight while it assesses inflation.
For gold, this creates pressure. Higher interest rates are usually a headwind for bullion because gold does not pay interest. If the US dollar and Treasury yields stay firm, XAUUSD may struggle to recover.
Key Trading Levels
| Level | What Traders Are Watching |
| US$4,400 | Major recovery resistance from the previous breakdown area |
| US$4,300 | Short-term rebound resistance from the recent swing area |
| US$4,100 | Near-term resistance if buyers regain control |
| US$4,000 | Key psychological level and current resistance zone |
| US$3,982 | Current trading area |
| US$3,970 | Intraday low and immediate support |
| US$3,900 | Lower short-term support if selling continues |
| US$3,600 | Wider downside support on the daily chart |
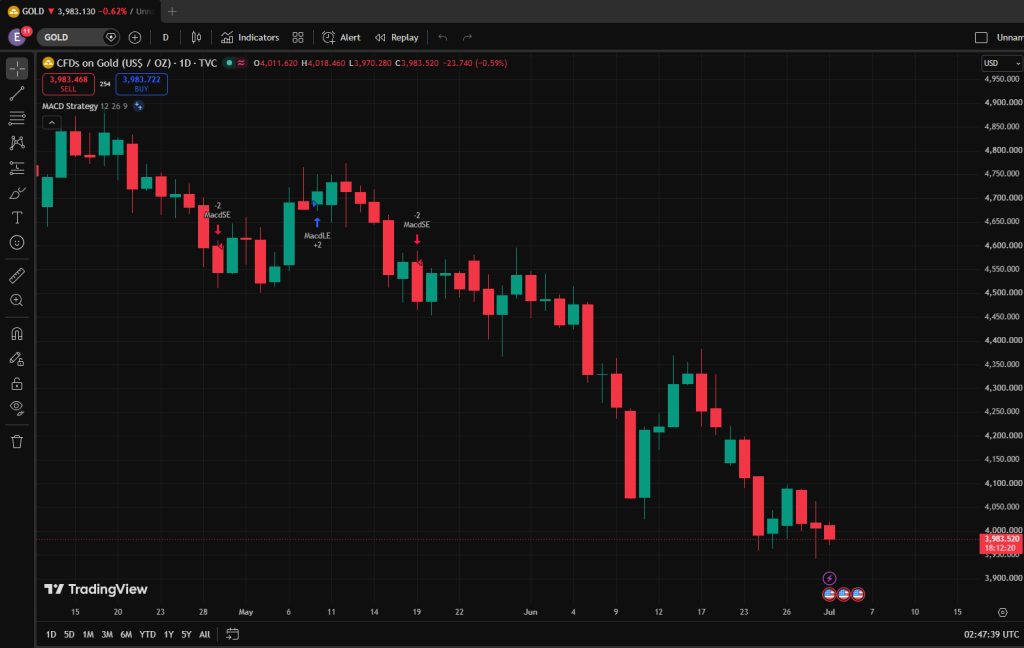
XAUUSD is trading near US$3,982, just below the key US$4,000 psychological level. The daily chart shows gold pulling back from its recent high, with price now testing an important support zone after losing momentum.
That keeps the short-term setup cautious. Gold needs to reclaim and hold above US$4,000 to stabilise the decline. A stronger move above this level could support a recovery toward US$4,100, followed by US$4,300 if buying momentum improves.
A break below US$3,970 would weaken the setup and suggest that sellers remain in control. If that happens, traders may watch for a deeper move toward US$3,900, with US$3,600 acting as the wider downside support level.
Bullish And Bearish Setups
| Setup | Trigger | Potential Market Reaction |
| Bullish Stabilisation | Hold above US$3,970 | Buyers may try to reclaim US$4,000 |
| Recovery Setup | Move above US$4,000 | Gold may attempt a rebound toward US$4,100 |
| Stronger Recovery | Move above US$4,100 | Momentum may extend toward US$4,300 |
| Bearish Break | Move below US$3,970 | Sellers may target US$3,900 |
| Deeper Sell-Off | Break below US$3,900 | Gold may weaken toward US$3,600 |
The bullish setup depends on XAUUSD holding above US$3,970 and reclaiming US$4,000. However, the daily chart still shows a cautious structure, with gold trading near recent lows after a strong pullback.
Traders can use short-term moving averages to judge whether downside pressure is starting to ease. If gold remains below the 5, 10, and 20-period moving averages, sellers still have control. If price moves back above the moving average zone, it may signal early stabilisation.
MACD and volume can also help confirm the next move. A flattening MACD may suggest weaker downside momentum, while stronger selling volume below US$3,970 could support a deeper move toward US$3,900 and US$3,600.
Disclaimer
The price levels and trade scenarios above reflect the author’s view at the time of writing and do not represent financial advice or an official recommendation from VT Markets. Traders should conduct their own analysis and manage risk carefully.
Trade XAAUSD CFDs With VT Markets
Gold CFDs remain one of the most closely watched markets during periods of geopolitical tension, inflation uncertainty, and shifting Fed expectations. With VT Markets, traders can access XAUUSD alongside forex, indices, shares, ETFs, oil, silver, and other global CFD markets from one platform.
VT Markets gives traders the tools to monitor price action, follow key levels, and respond when market conditions change. Whether gold recovers above US$4,000 or extends lower, traders can track the setup with advanced charting tools, flexible account options, and access to global markets.
Open a live VT Markets account today and trade gold CFDs, forex, indices, commodities, shares, and more.
Why Trade XAAUSD as a CFD?
CFDs allow traders to take a view on both rising and falling markets without owning the underlying asset.
That makes XAUUSD CFDs useful during fast-moving macro events, especially when inflation data, Fed policy, oil prices, and US dollar movement create short-term volatility.
With VT Markets, traders can access gold and other key markets from one account, making it easier to follow cross-asset opportunities as they develop.
What To Watch Next
Traders should watch US-Iran developments, oil prices, the US dollar, Treasury yields, and the next round of US labour market data.
The market is now waiting for June ADP employment data and Thursday’s nonfarm payrolls report. A stronger jobs reading could support the Fed’s case for tighter policy, which may weigh further on gold. A softer report could reduce rate-hike pressure and help XAUUSD stabilise.
For now, the key trading zone sits around US$3,970 to US$4,000. A recovery above US$4,000 may support short-term stabilisation, while a break below US$3,970 could keep sellers in control.
Frequently Asked Questions
Why did gold fall below US$4,000?
Gold slipped below US$4,000 as fading US-Iran peace hopes raised inflation concerns and strengthened expectations of further Fed rate hikes.
Why do Fed rate hikes affect gold?
Gold does not pay interest. When interest rates rise, yield-bearing assets may become more attractive, which can reduce demand for bullion.
What is the key level for XAUUSD now?
The main level to watch is US$4,000. A move back above this level may support stabilisation, while a break below US$3,970 could keep sellers in control.
What data should gold traders watch next?
Traders should watch ADP employment data, nonfarm payrolls, the US dollar, Treasury yields, and Fed commentary.
Can traders trade gold when prices fall?
Yes. Gold CFDs allow traders to take a view on both rising and falling prices without owning physical gold. CFDs are leveraged products and carry risk.
Start trading now — click here to create your real VT Markets account.


