

Key Takeaways
- A Cent Account displays your balance in cents (USC), so a $50 deposit appears as 5,000 USC — making real-market position sizing practice accessible and affordable.
- The 1–2% risk-per-trade rule is commonly used among traders — and a Cent Account is the safest place to make it a non-negotiable habit.
- Stop-loss placement based on market structure — not arbitrary pip counts — is what separates disciplined traders from the ones who get stopped out repeatedly on valid ideas.
- In 2026, retail traders who apply a consistent position-sizing framework generally experience significantly smaller drawdowns than those who size trades based on intuition alone.
- A risk-to-reward ratio of at least 1:2 means you only need to be right about 34% of the time to be profitable — understanding this math changes everything.
- The most damaging mistake with a Cent Account is treating it casually. Every trade should be executed with the same rigour you’d apply to a fully funded standard account.
Here is a question most trading courses do not want to ask you: what percentage of your account are you actually risking right now, on each trade?
“sell”. If you do not know the exact figure before you click “buy” or “sell”, you are not managing risk — you are guessing. And guessing, even with a good strategy, is how accounts get wiped during normal losing streaks that every trader faces.
Position sizing and stop-loss placement are the two mechanics that determine whether you survive the inevitable bad runs in trading. They are not exciting. They do not make for viral social-media content. But they are, without question, the foundation of every consistently profitable trader’s approach.
The challenge for most people is that learning these skills properly costs money — real money lost to experiments on a full-sized account. That is precisely where a Cent Account earns its place. It gives you real market conditions, real emotional stakes, and real execution, but with position sizes small enough that the cost of learning is measured in cents, not hundreds of dollars.
This guide covers everything you need to know about using a Cent Account to build genuine, robust risk management skills—from the maths of position sizing to stop-loss strategy, drawdown analysis, and the psychological pitfalls that cause even technically sound traders to undermine themselves.

What is a Cent Account— and Why Is It Built for Risk Management Practice?
A Cent Account is a live trading account where your balance and trade sizes are denominated in US cents (USC) rather than US dollars. If you deposit $50, your account displays 5,000 USC. Your position sizes, profits, and losses all scale proportionally — which means you are participating in real market price movements at a fraction of the usual financial exposure. If you are completely new to the concept, our guide on What Is a Trading Cent Account—and Why Many Beginners Start Here covers the foundations in full before you dive into risk management specifics.
This is not a demo account with virtual money. Price feeds are live. Spreads reflect real market conditions. Orders are executed in genuine market infrastructure. The only difference is scale.
That distinction matters enormously for risk management. Demo accounts are valuable for learning platform mechanics, but they do not replicate the emotional experience of real money. When there is nothing genuinely at stake, traders routinely ignore their own stop-loss rules, hold losing positions far too long, and revenge-trade without consequence. None of that teaches you how you’ll act when real money is at stake.
A Cent Account threads that needle. The amounts involved are small enough to experiment without fear but real enough to trigger authentic emotional responses that a demo account simply cannot replicate.
Cent Account vs. Demo vs. Standard: What Each Account Type Actually Teaches You
| Account Type | Real Money? | Emotional Realism | Position Sizing Practice | Cost of Learning Mistakes |
| Demo Account | No | Low — no real stakes | Limited — no real cost to errors | Learned be earned |
| Cent Account | Yes (micro) | High to medium | Excellent — live conditions, tiny risk | Cents — ideal learning environment |
| Standard Account | Yes (full) | High — full stakes | High risk without experience | Significant — expensive to make errors |
74–89% of retail CFD and forex traders lose money, according to ESMA broker disclosure requirements consistently reported across regulated brokers in 2024–2025. CFTC filings from US-registered forex brokers report a similar range of 70–80%. Across regulatory and broker reports alike, poor risk management—including oversized positions and absent or misplaced stop losses—is cited as the primary driver of losses ahead of poor trade selection. (Source: FXStreet / ESMA & CFTC data, 2025)
The 1–2% Rule: Why Position Sizing Is the Most Important Decision You Make on Every Trade
Before you look at a chart, before you analyse a setup, before you calculate where to place your stop — the single most important decision you make on any trade is how much of your account you are willing to lose if you are wrong.
For professional traders, that answer is almost universally never more than 1–2% of total account equity per trade.
This sounds conservative — and it is, by design. The mathematics of drawdown make the case better than any argument could.
Drawdown Mathematics Every Trader Must Understand
| Consecutive Losing Trades | Risking 1% Per Trade | Risking 5% Per Trade | Risking 10% Per Trade |
| 5 losses in a row | ~4.9% account lost | ~22.6% account lost | ~41% account lost |
| 10 losses in a row | ~9.6% account lost | ~40.1% account lost | ~65% account lost |
| 15 losses in a row | ~14% account lost | ~54% account lost | ~79% account lost |
A losing streak of 10 consecutive trades is not unusual for a strategy with a 50% win rate — unfortunately, it is almost inevitable over a large enough sample. At 1% risk, it is recoverable. At 10% risk, you have lost more than half your account before you have even had the chance to evaluate whether the strategy works.
Practising the 1–2% rule on a Cent Account, across 50–100 real trades, is how you internalise it. After a losing streak of five trades where you have followed the rule perfectly and your account has lost less than 5%, the rule becomes intuitive rather than theoretical.
Three Position Sizing Approaches — and Which One to Start With
- Fixed Fractional Sizing: Risk a fixed percentage of your current account equity on every trade. As your account grows, position sizes scale up; during drawdowns, they scale back down automatically. This is the most widely used risk-management approach among systematic traders.
- Fixed Dollar Risk: Risk a set monetary amount regardless of current equity — for example, always risk $1 per trade. Simple to apply but does not automatically adjust for account growth or drawdowns the way fractional sizing does.
- Kelly Criterion: A formula-based approach that calculates optimal position size based on historical win rate and average win/loss ratio. Powerful in theory but frequently produces aggressive position sizes; most traders who use it apply a “half-Kelly” or “quarter-Kelly” variant.
📌 Where to Start
If you are new to structured position sizing, begin with Fixed Fractional Sizing at 1% per trade on your Cent Account. Apply it to every single trade without exception for your first 50 trades. The goal is not to find the perfect formula — it is to build the habit of always calculating before entering.
How to Calculate Your Position Size on a Cent Account: Step-by-Step
Here is the position sizing formula that every serious trader uses, regardless of account size:
📐 Position Sizing Formula
Position Size (lots) = (Account Equity × Risk %) ÷ (Stop-Loss in Pips × Pip Value per Lot)
Let’s apply this directly to a real Cent Account scenario using specifications consistent with live trading conditions in 2026.
Worked Example: EUR/USD on a Cent Account
📋 Trade Scenario — EUR/USD
| Deposit Amount | $50 USD |
| Cent Account Display Balance | 5,000 USC |
| Risk Per Trade (1%) | 50 USC |
| Stop-Loss Distance | 25 pips (structure-based — see below) |
| Pip Value (0.01 lot on Cent Account) | ~10 USC per pip |
| Calculation | 50 USC ÷ (25 × 0.10) = 0.002 lots |
| ✅ Position Size: | 0.002 lots = 0.20 micro-lots |
Precaution — Pip Values Vary by Instrument
Pip values differ depending on the currency pair, commodity, or index you are trading, as well as your lot size. Always verify the pip value for your specific instrument before calculating position size.
On EUR/USD, the pip value is straightforward — on pairs where the USD is the base currency (such as USD/JPY), the calculation differs. When in doubt, use your broker’s position size calculator before entering a trade.
Worked Example: XAUUSD (Gold) on a Cent Account
Gold is one of the most popular instruments for Cent Account traders, particularly given its volatility and clear price structure. In 2026, the range for gold trading requires meticulous consideration of price values and margin requirements when sizing positions. For a deeper look at why gold traders specifically gravitate toward this account type, see our complete guide: Why Gold Traders Choose Cent Accounts: The Complete Guide.
📋 Trade Scenario — XAUUSD (Gold)
| Cent Account Balance | 5,000 USC |
| Risk Per Trade (1%) | 50 USC |
| Stop-Loss Distance (volatility-based, ~1.5× ATR) | $15 move against position |
| Pip Value (0.01 lot on Gold, Cent Account) | ~1 USC per $0.01 move (i.e. ~100 USC per $1 move at 0.01 lot) |
Result: With a $15 stop and ~100 USC risk per $1 move at 0.01 lot, the position size resolves to approximately 0.003 lots — exposing you to real gold price movements with a maximum loss of ~50 USC if the trade moves against you. You experience the same market forces that move gold for institutional traders, on a scale that makes learning genuinely affordable.
Reminder
Margin requirements for gold and other commodities are higher than on standard forex pairs. Always check the required margin per lot on your specific instrument before sizing up a position — particularly on a Cent Account, where available margin headroom may be limited to very small deposit sizes.
Stop-Loss Essentials: How to Place Stops That Actually Work
A stop-loss order is the mechanism that converts your position sizing calculation into real protection. Without one, your position sizing work is theoretical — the market can move against you indefinitely, and your planned maximum loss becomes meaningless.
But placing a stop-loss effectively is more nuanced than it appears. The two most common errors are placing stops too tight (resulting in being stopped out of valid trades by normal market noise) and placing stops too wide (resulting in losses larger than your risk plan intended when the trade fails).
The Three Approaches to Stop-Loss Placement
| Method | How It Works | Best Used When | Common Pitfall |
| Structure-Based | Placed just beyond a key swing high/low, support/resistance, or price level that invalidates your trade thesis | Clear chart structure; trending or range-bound conditions | Structure zones can be broad — may result in larger stops than expected on volatile instruments |
| Volatility-Based (ATR) | Uses the Average True Range (ATR), typically 1.5–2× ATR, to place a stop that accounts for normal market noise | Adapting stops to current volatility conditions; particularly effective on gold and indices | ATR-based stops widen significantly during volatile periods — always recalculate position size accordingly |
| Time-Based | Exits a trade if it has not performed as expected within a defined time window, regardless of price | Intraday strategies where a thesis must play out within a session | Requires strict discipline to exit at a loss even if price has not technically hit a stop level |
The Five Stop-Loss Rules Every Cent Account Trader Should Drill Until They Are Automatic
- Set your stop before you enter, not after. Entering a trade without a pre-defined exit level is speculation, not trading. If you cannot identify where the trade is wrong, you should not be in it.
- Never move a stop further away from entry. This is the most common emotional rule-break in trading. Once your stop is set, the only permitted movement is in the direction of profit — to lock in gains as trade develops.
- Account for the spread in your stop placement. On EUR/USD with a 1.2-pip spread, a stop placed 10 pips from entry is effectively an 8.8-pip stop. On instruments with wider spreads, this difference is significant.
- Avoid obvious round numbers. Stops clustered at obvious levels like $5,100 on gold attract institutional order flow that can temporarily hunt those levels. Place your stop slightly beyond key structural levels rather than at the exact number.
- Recalculate position size every time your stop distance changes. If your stop is 20 pips, your position size will differ from when your stop is 40 pips — both trades must risk the same percentage of your account, not the same number of lots.
⚠️ Take Note — The Arbitrary Pip Count Trap
A very common pattern among newer traders is placing stops at round pip distances—”I’ll put my stop 30 pips away”—without any reference to where market structure actually invalidates the trade thesis. This approach results in stops that are either too tight for the instrument’s normal volatility (and get triggered by routine fluctuations) or too wide (and risk more than intended). Your stop distance should always be driven by the market, then your position size adjusted to maintain your fixed risk percentage.
Risk-to-Reward Ratio: The Maths That Makes Risk Management Sustainable
Position sizing defines how much you lose when you are wrong. Your risk-to-reward ratio (RRR) determines whether your overall system is mathematically viable — because being “right” half the time is not sufficient on its own if your average loss exceeds your average gain.
Why 1:2 Is the Minimum Benchmark — and What the Numbers Tell You
With a 1:2 risk-to-reward ratio, you risk 1 unit to gain 2 units. The mathematical implication is profound: at a 1:2 RRR, a trader needs a win rate of only 34% to break even. Every win percentage above 34% generates a positive expectancy.
| Win Rate | RRR 1:1 | RRR 1:2 | RRR 1:3 |
| 30% | ❌ Losing | ❌ Slight loss | ✅ Profitable |
| 40% | ❌ Losing | ✅ Profitable | ✅ Profitable |
| 50% | ⚖️ Breakeven | ✅ Profitable | ✅ Profitable |
| 60% | ✅ Profitable | ✅ Strong | ✅ Very Strong |
Win rate without RRR context is incomplete.
A strategy with a 70% win rate sounds impressive — until you discover the average loss is three times the average gain, producing a net-losing account. The two metrics only become meaningful together: a modest 45% win rate paired with a consistent 1:2 RRR is more profitable than a 65% win rate where losses routinely exceed wins in size. If you are only reviewing one number after closing a trade, you are working with half the picture. (Further reading: Get Your Trading Checklist Before Entering Any Trade)
Use your Cent Account journal to record not just your planned RRR but your achieved RRR on every closed trade. The gap between the two — caused by closing trades early, widening stops, or missing take-profit targets — is one of the most important data points you will discover about your own trading behaviour.
Building Your Risk Management System on a Cent Account: A Practical Framework
Understanding risk management theory and genuinely applying it through market conditions are different skills. The Cent Account bridges the gap — here is how to use it methodically.
Phase 1 — Define Your Risk Rules in Writing Before Your First Trade
Decide on three numbers before you open your first position: your maximum risk per trade as a percentage, your minimum target RRR, and the maximum number of simultaneous open positions you will hold. Write these down outside your trading platform — in a document, a notebook, anywhere that makes them feel like rules rather than intentions.
A risk management plan that exists only in your head is not a plan. It is a preference that will evaporate the moment you are in a losing trade and emotionally compromised.
Phase 2 — Log Every Trade With These Minimum Data Points
- Date, instrument, and direction (long/short)
- Entry price, stop-loss level, and take-profit level
- Position size in lots and risk as a percentage of account equity
- Stop-loss rationale (structure-based / ATR-based / time-based)
- Exit price and outcome (win/loss/breakeven)
- Planned RRR vs. achieved RRR
- Post-trade notes: did you follow your rules? If not, why not?
Phase 3 — Review After Every 25–50 Trades
After each block of 25–50 trades, calculate the metrics that matter: your maximum drawdown, your average achieved RRR, your win rate, and your profit factor. Look for patterns. Are you consistently closing winners early? Are your stops too tight on a specific instrument? Are your losses larger on one session versus another? This data is what the Cent Account is generating — treat it as research, not as a record of past wins and losses.
Phase 4 — Stress-Test New Instruments Before Scaling
Every instrument has its own volatility personality. EUR/USD behaves differently from GBP/JPY, which behaves differently from gold, which behaves differently from the S&P 500 index. When you want to add a new market to your trading, run a minimum of 30 trades on a Cent Account first — using your existing risk management rules — before committing standard-account capital to that instrument. You can review the full account specifications and get started directly on the VT Markets Cent Account page.
✅ Pro Tip
When moving between instruments, recalibrate your ATR-based stop distances. A 15-pip stop may be perfectly sized for EUR/USD during a quiet European session — and catastrophically tight for GBP/JPY during a London–New York overlap. The Cent Account lets you discover these differences at negligible cost.

The Psychology of Risk Management — Why Rules Break Down and How to Stop It
Here is the uncomfortable truth: every experienced trader knows the rules of position sizing and stop-loss management. The ones who blow accounts know them too. The difference is not knowledge — it is execution under emotional pressure.
The Four Most Dangerous Psychological Patterns in Risk Management
- Revenge trading: Increasing position size after a loss to quickly recover the funds. This is the most efficient way to convert a manageable drawdown into an account-ending one. The Cent Account limits the financial damage of revenge trading to cents — whilst exposing the impulse clearly enough for you to recognise and address it.
- Stop-loss creep: Quietly moving a stop further from entry rather than accepting a loss. This converts a small, defined risk into a large, undefined one — the exact opposite of what risk management is designed to achieve.
- Overconfidence position sizing: Gradually inflating position sizes above your defined rule during a winning streak. Overconfidence peaks precisely when traders are most exposed — after a run of wins when they feel they have “figured it out.”
- Early exit erosion: Closing profitable trades before they reach your planned take-profit, reducing your achieved RRR well below your target RRR. This can turn a statistically profitable strategy into a losing one without the trader ever realising why.
⚠️ Reminder — Cent Accounts Do Not Remove Psychology, They Reveal It
It is worth remembering that a Cent Account does not eliminate emotional trading pressure — it simply reduces the financial stakes to a level where mistakes are survivable. You will still feel the temptation to move your stop when a trade is 3 pips from your exit level. You will still feel the pull to add to a losing position. These are not failures — they are exactly the patterns the Cent Account is designed to surface. Treat every rules violation on a Cent Account as a training signal, not just a mistake.
Key Risk Management Metrics to Track on Your Cent Account
Win rate is the metric most traders track — and it is also the least meaningful in isolation. These are the numbers that actually tell you whether your risk management is working:
| Metric | What It Measures | Healthy Target |
| Maximum Drawdown | Largest peak-to-trough account decline | Highly strategy-dependent. Textbook guidance suggests below 20–30%, but top traders on Copy Trading leaderboards commonly run drawdowns of 50–70% as part of high-return strategies. What matters is that your drawdown is intentional — not a surprise |
| Achieved RRR | Actual average reward vs. risk across all closed trades | At or above 1:1.5 (target 1:2) |
| Profit Factor | Total gross profit ÷ total gross loss | Above 1.5 is considered strong |
| Expectancy Per Trade | Average expected gain per trade based on historical data | Any positive figure confirms viability |
| Maximum Consecutive Losses | Longest losing streak in your dataset | Account must survive 15+ losses at current risk % |
| Rule Compliance Rate | % of trades where all risk rules were followed without exception | 90%+ indicates strong discipline |
Advanced Risk Management Concepts to Practise on a Cent Account
Correlation Risk: When Five Positions Are Actually One Trade
One of the most overlooked sources of excessive risk in retail trading is correlation. If you hold long positions on EUR/USD, GBP/USD, and AUD/USD simultaneously, you are — in practical terms — short the US Dollar three times over. A single USD-positive event can hit all three positions simultaneously, and your actual drawdown is three times what your individual position sizing suggests.
Use a Cent Account to deliberately trade correlated instruments side by side and observe how they respond to the same market events. This builds the intuitive understanding of actual portfolio exposure that position sizing calculations alone cannot capture.
Scaling In and Out of Positions
Rather than entering a full position at one price, some experienced traders scale in — entering with a partial position and adding to it as the trade confirms direction. This approach can improve average entry pricing on valid setups but requires careful management, as total exposure accumulates with each addition.
A Cent Account is ideal for learning scaling mechanics. The cost of getting a scaling sequence wrong is cents rather than dollars, and the data you generate on how scaling affects your achieved RRR is directly applicable to a standard account.
Trailing Stop-Losses: Locking In Gains Without Cutting Trends Short
A trailing stop adjusts automatically in the direction of a profitable trade, locking in gains as price moves in your favour whilst staying inactive if price reverses. The challenge is calibration — set it too tight and you exit valid trends during normal pullbacks; set it too loose and you give back more profit than necessary before the reversal triggers your exit.
Running trailing stop experiments across multiple instruments and sessions on a Cent Account generates real performance data on which distances work best for your strategy — without the cost of discovering this through a standard account.
✅ How to Practise Trailing Stops on a Cent Account
Run the same setup three times with three different trailing stop distances. For example, 1× ATR, 1.5× ATR, and 2× ATR. Compare achieved RRR and exit quality across each. After 20–30 instances per distance setting, you will have genuine data on which approach suits your specific instruments and timeframes best.
When Should You Move From a Cent Account to a Standard Account?
Moving to a standard account is a milestone and it should be driven by data, not by confidence or impatience. Feeling ready is not sufficient evidence. Here is the benchmark worth applying to before making that transition.
| Readiness Benchmark | Target |
| Minimum number of logged trades on Cent Account | 100+ trades with complete data |
| Profitability across full dataset | Positive expectancy confirmed |
| Maximum drawdown experienced | No universal threshold — what matters is that you can explain it, you expected it, and your account sizing absorbs it |
| Longest consecutive losing streak survived | At least 5 consecutive losses without rule violations |
| Rule compliance rate | Above 90% across all logged trades |
| Achieved RRR vs. planned RRR | Within 20% of planned RRR (minimal early-exit erosion) |
📊 Real-World Context — What Live Trader Data Actually Shows
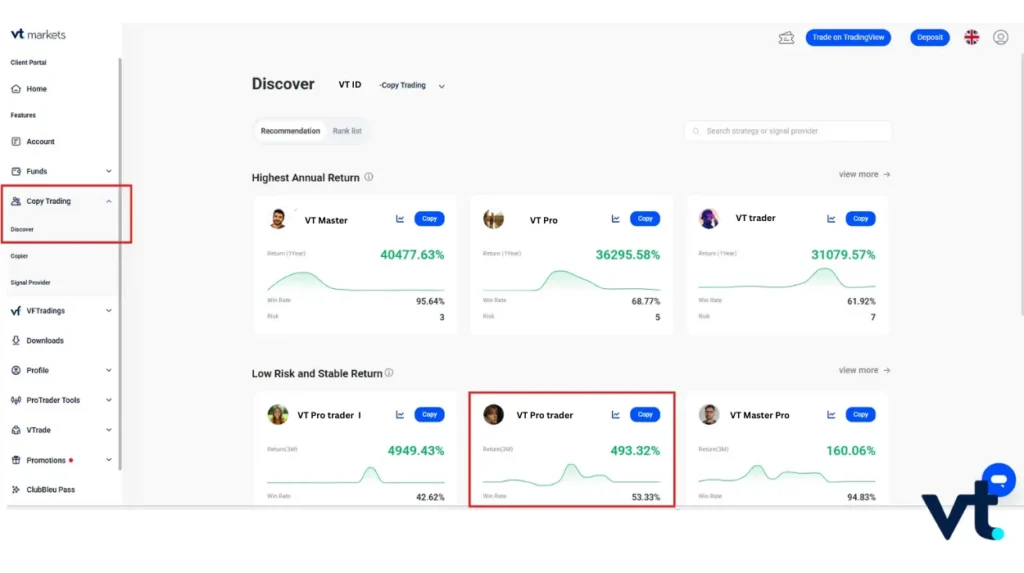
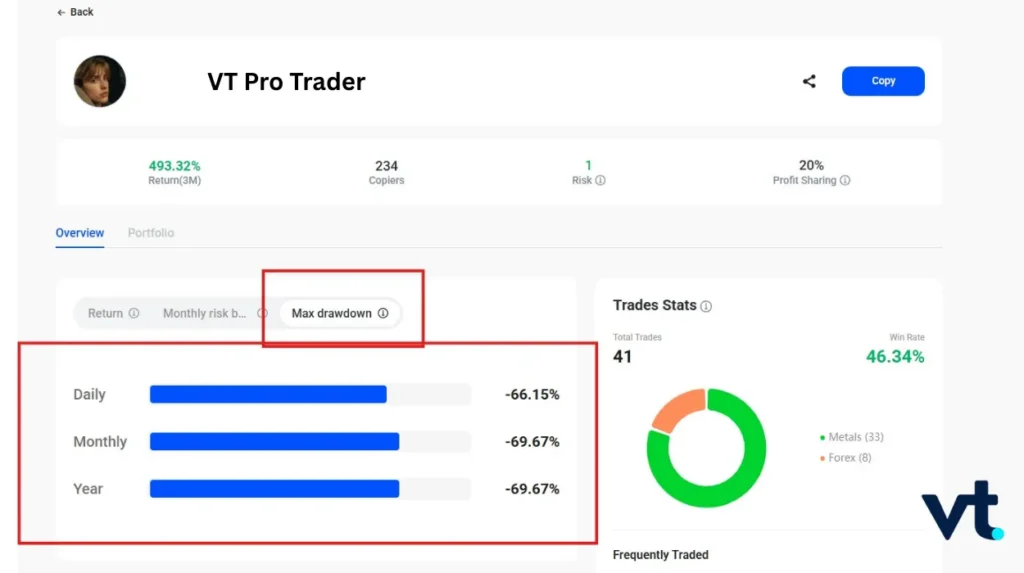
The benchmarks above are a starting point, not a definition of what success must look like. The numbers on VT Markets’ Copy Trading leaderboard defy conventional textbook interpretations: a top-ranked signal provider displays a win rate of just 46.34% across 41 trades, a maximum drawdown of -69.67%, and a 3-month return of 493.32%. Another shows 40,477% annual returns with a 95.64% win rate. These are not outliers — they reflect the full range of how active traders actually operate. The Cent Account is not here to keep you “safe” forever. It is here to help you understand your strategy’s actual risk profile—whatever that profile turns out to be— before you scale it up with real capital.
⚠️ Caution — There Is No Single “Right Time”
It is worth noting that many professional traders never fully “graduate away” from a Cent Account — they simply add to their toolkit. Expert Advisor (EA) developers routinely run automated strategies on Cent Accounts in parallel with fully funded standard accounts, using the low-cost environment to validate parameter changes, test new instruments, or forward-test algorithm updates in genuine live market conditions without disrupting their primary capital. If you are moving to a standard account, ensure the decision is driven by your journal data — not by a winning streak. A run of strong performance on a Cent Account is worth celebrating, but it should be stress-tested against the readiness benchmarks above before you scale. Exceptional monthly returns during a favourable market period are real, but they are not a reliable signal that conditions will persist. The Cent Account earns its place at every stage of a trading career — not just at the beginning.
Ready to Put Risk Management Into Practice?
A Cent Account gives you real market conditions with micro-sized risk — the most efficient environment for turning risk management theory into genuine trading discipline.
Frequently Asked Questions
Can I genuinely practise risk management on a Cent Account with only $50?
Yes — and in many respects, a small deposit like $50 (displayed as 5,000 USC) is the ideal learning environment. Applying the 1% rule at this balance means your maximum per-trade risk is 50 USC. This is real enough to feel meaningful and teach you genuine emotional discipline, but small enough that a worst-case losing streak of 10 trades in a row would cost you approximately $5 in real terms. What matters is not the absolute dollar amount at stake but the consistency with which you apply your risk rules on every single trade.
What is the difference between a stop-loss and a stop-limit order — and which should I use for risk management?
A stop-loss order (also called a stop-market order) triggers an immediate market order to close your position when price reaches your stop level. Execution is guaranteed, but the exact fill price may differ slightly from your stop level during fast-moving conditions — this is called slippage. A stop-limit order triggers a limit order at your specified price, guaranteeing the price but not guaranteeing execution — in rapidly moving markets, price can gap past your limit level without filling you. For most retail traders applying a risk management framework, a standard stop-loss order is the more reliable choice: getting out of a losing trade at approximately your planned level is almost always preferable to potentially not getting out at all.
How does leverage on a Cent Account affect my position sizing and risk management calculations?
Leverage amplifies both your potential profit and your potential loss per price movement — but when you are calculating position size using the percentage risk method, the leverage itself does not change your risk formula. You are always calculating based on how much account equity you are willing to lose if your stop-loss is hit. What leverage does affect is your margin requirement: higher leverage means less margin is required to open a given position size. Take note that while leverage can enable larger positions on a Cent Account, using maximum available leverage without reference to your position sizing calculation undermines the entire risk management framework. Always calculate your position size from your risk percentage first, then verify that the required margin for that position is within a safe proportion of your account equity.
Is a Cent Account only for beginners, or do experienced traders use them too?
Cent Accounts are not exclusively for beginners — experienced traders use them for a range of legitimate purposes. These include forward-testing new strategies in live market conditions before committing standard-account capital, validating automated trading systems (Expert Advisors) with real execution feeds and genuine spreads, testing position sizing models on unfamiliar instruments, and re-establishing trading discipline and routine after a period away from the markets or following a significant drawdown on a larger account. The professional approach to a Cent Account is the same regardless of experience level: apply the same rigour and the same risk rules you intend to use on any other account. Treating it as a “throwaway” practice environment defeats its core purpose.
Risk Management Becomes Real When the Money Is Real
Knowledge of the 1–2% rule is widespread. Consistent application of it—through losing streaks, through volatile sessions, through the constant temptation to deviate “just this once”—is rare. And it is rare because most traders fail to build genuine risk management habits in a live environment before scaling up.
A Cent Account changes that. It provides the emotional reality of live trading, the analytical data of real trade records, and the financial safety net of micro-sized positions. Whether you are building your risk management system from scratch or refining an approach that already has some structure, the Cent Account is where abstract rules become ingrained habits.
Position sizing and stop-loss discipline are not the exciting parts of trading. But ask any trader with a career measured in years rather than months what separates those who last from those who do not and you will get the same answer every time.
It was never about the entries.


