


Key Takeaways:
- Evaluate providers using multiple performance metrics, not just returns
- Assess risk profiles through drawdown, trading style, and consistency
- Match provider characteristics with your risk tolerance and goals
- Monitor strategy alignment and adjust allocations regularly
Selecting the right strategy provider represents the most important decision in your copy trading journey. This single choice determines whether you experience steady portfolio growth or disappointing losses.
Make sure you read our complete guide to Copy Trading on your journey to copy trading.|
Common Pitfalls When Choosing a Strategy Provider
Many beginners focus exclusively on headline returns, overlooking crucial factors like risk management discipline, trading style consistency, and long-term sustainability.
The reality is straightforward: past performance alone tells an incomplete story. A provider showing 80% returns might have risked their entire account repeatedly, survived by luck, and could blow up spectacularly during the next market downturn. Meanwhile, a provider with modest 15% annual returns but exceptional risk management might deliver far superior long-term results.
This add-on comprehensive guide for Copy Trading walks you through the essential criteria for evaluating providers, helping you make informed decisions that align with your financial goals and risk tolerance. By understanding what separates sustainable strategies from flash-in-the-pan performers, you position yourself for long-term success in copy trading.
Understanding Performance Metrics Beyond Raw Returns
When evaluating strategy providers, digging deeper than surface-level returns separates informed copiers from those chasing illusions. The right strategy provider demonstrates consistent performance across multiple dimensions, not just impressive percentage gains.
Return on Investment (ROI) Over Multiple Timeframes
Single-period returns mean little without context. A provider showing 120% gains over three months might simply have caught one lucky trade or taken excessive risks that eventually backfire.
Examine ROI across multiple timeframes:
1-month performance: Shows recent momentum and current market adaptation
3-month performance: Reveals short-term consistency through varying conditions
6-month performance: Demonstrates ability to navigate different market cycles
12+ month performance: Proves sustainable strategy with genuine edge
Win Rate and Risk-Reward Ratio
Win rate alone might not give a full overview of performance. This is because a win rate tells you how often a provider wins. However, it does not notify whether the average wins are large enough to outweigh the average losses.
Therefore, it must be assessed together with risk-reward and overall expectancy. A provider with 90% winning trades might achieve this by letting losers run indefinitely whilst taking tiny profits, an unsustainable approach guaranteed to eventually eliminate accounts.
Examine both metrics together:
Win Rate = (Winning Trades ÷ Total Trades) × 100
Risk-Reward Ratio = Average Win Size ÷ Average Loss Size
Example calculation:
Provider A executes 100 trades:
- 65 winning trades (65% win rate)
- 35 losing trades
- Average winning trade: +$180
- Average losing trade: -$120
- Risk-reward ratio: 180 ÷ 120 = 1.5:1
This represents solid performance. The 65% win rate combined with 1.5:1 risk-reward creates positive expectancy, meaning the strategy should profit over time.
However, a provider with 85% win rate but 0.3:1 risk-reward is dangerous:
- Average win: +$30
- Average loss: -$100
Despite high win percentage, one or two losing trades erase multiple winners, creating negative long-term expectancy.
The right strategy provider typically maintains either high win rate with reasonable risk-reward (60%+ wins with 1:1+ ratio) or moderate win rate with excellent risk-reward (40%+ wins with 2:1+ ratio).
Assessing Risk Profile and Drawdown Management
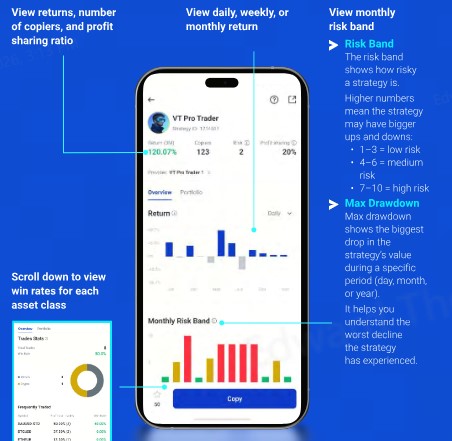
Risk indicators on VT Markets copy trading (Risk Band + Max Drawdown) are often more revealing than returns alone. Lower-risk approaches may look slower in good months. However, they can preserve capital during inevitable losing stretches. Meanwhile, aggressive styles may spike short-term performance before incurring deep declines.
Maximum Drawdown Analysis
Maximum Drawdown is the key metric for assessing risk in copy trading. It measures the peak-to-trough decline during a specific period, quoted as a percentage. On VT Markets, max drawdown is platform-calculated (based on return movements over time), so treat it as VT Markets’ standardised “worst dip” metric for comparing providers.
Risk profile reveals how providers handle losses and market adversity, often the most telling indicator of long-term viability.
Conservative risk management protects capital during inevitable losing periods, whilst aggressive approaches might deliver spectacular short-term gains before catastrophic failure.
Maximum Drawdown = [(Peak Value – Trough Value) ÷ Peak Value] × 100
If a provider’s account reached USD10,000 and then dropped to USD7,500 before recovering, maximum drawdown equals 25%.
Practical interpretation (Guideline, not “Industry Data”):
| Risk Band (VT Markets) | Provider Behaviour |
| 1–3 (Low risk) | Conservative, consistent |
| 4–6 (Medium risk) | Moderate risk-taking |
| 7–10 (High risk) | Aggressive / highly volatile |
As a screening rule, very large max drawdowns (e.g., >40–50%) can signal weak downside control, especially if the provider also shows unstable monthly returns.
Compare current drawdown vs max drawdown:
If a provider is currently down 8% with a historical max drawdown of 12%, they’re still operating within their past “worst-case” band. So, if they’re already near that max, you may be close to the strategy’s historical stress limit.
Leverage Usage and Position Sizing
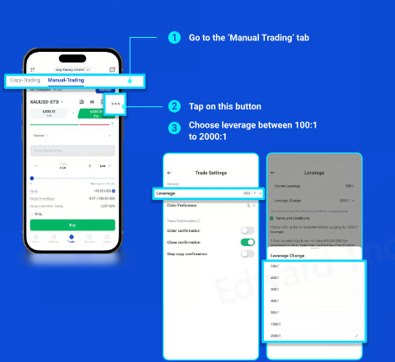
Excessive leverage amplifies both gains and losses, creating explosive volatility that destroys accounts during unexpected market moves. The right strategy provider uses leverage judiciously, sizing positions appropriately for account equity.
Based on the VT Markets app screen, the leverage settings start at 1:100 and can go up to 1:2000 (for certain countries).
Check average leverage and position size (VT Markets ranges):
- Lower setting (1:100): Still aggressive, only “conservative” relative to the platform’s range. Use tight risk limits
- Moderate (1:200 to 1:500): Acceptable only with proper risk controls. Note VT Markets’ default is often 1:500
- High (1:500 to 1:1000): Requires exceptional discipline with constant monitoring. Margin calls become much more likely
- Extreme (1:1000 to 1:2000): Highest-risk zone, generally unsustainable for most retail traders. Avoid unless you fully understand the downside
Position sizing reveals discipline. Providers risking 1-2% per trade demonstrate professional risk management. Those risking 10%+ per position invite disaster.
Example (VT Markets settings):
Provider A trades at 1:100 leverage (the lower end of VT Markets’ adjustable range), risks 1.5% per trade, and keeps max drawdown at 15% — a measured setup with a better chance of surviving long-term.
Provider B trades at 1:1000–1:2000 leverage (available only for certain countries), risks 8% per trade, and has 45% max drawdown — a “blow-up profile” where a small adverse move can trigger margin pressure/forced liquidation and lead to eventual catastrophic loss.
Evaluating Trading Style and Strategy Consistency
Different trading styles suit different followers depending on risk tolerance, time horizon, and psychological comfort. Providers should match your preferences whilst demonstrating consistency in their stated approach.
Understanding Common Trading Styles
Copy trading providers typically employ one of several distinct styles:
- Scalping: Extremely short-term trades lasting seconds to minutes. Suitable for followers comfortable with numerous daily positions
- Day Trading: Positions opened and closed within single trading sessions. Works well for followers wanting active participation without overnight worry
- Swing Trading: Positions held several days to weeks. Ideal for followers preferring less active monitoring
- Position Trading: Long-term holds spanning weeks to months. Suits followers with long-term perspective.
Match provider style to your preferences. Limited monitoring time suggests swing or position trading. Dislike overnight risk points to day trading or scalping. Quality providers clearly state their approach and stick to it consistently.
Strategy Consistency and Discipline
Review trading history for pattern consistency. Providers who fundamentally change their approach demonstrate lack of confidence or discipline.
Warning signs include sudden dramatic increases in trade frequency, unexplained switches between market types, massive position size changes without justification, strategy description contradicting actual trading behaviour, and extended periods of no activity followed by frantic trading.
Analysing Suitability for Your Situation
Beyond provider quality, genuine suitability for your specific circumstances determines success. The objectively “best” provider might prove completely wrong for your risk tolerance, capital allocation, or investment timeline.
Capital Requirements and Minimum Investment
Different providers establish varying minimum copy amounts, ranging from as low as USD 10 to several thousand dollars. This affects both accessibility and practical diversification.
If you have $500 for copy trading and a provider requires $300 minimum, you cannot effectively diversify. Seek providers with $50-100 minimums, allowing spread across 5-10 different strategies.
VT Markets offers copy trading from just USD 10, enabling proper diversification even for smaller accounts.
Risk Tolerance Alignment
Honest self-assessment of risk tolerance prevents emotional decisions during inevitable drawdown periods. Quality providers operate within your psychological comfort zone.
Ask yourself: Maximum acceptable account decline before you panic? Comfort with seeing unrealised losses? Do open positions prevent sleep? Can you wait 2-3 months for drawdown recovery?
Match these answers against provider statistics.
- Risk-averse investors need maximum drawdown under 15% with low leverage.
- Moderate risk tolerance suits maximum drawdown 15-25%.
- Aggressive risk appetite can accept maximum drawdown 25-35%.
Examining Transparency and Communication
Professional providers maintain transparency about their approach, performance, and market views. This openness helps followers understand strategy logic and maintain confidence during difficult periods.
Strategy Description and Updates
The right strategy provider offers clear, detailed strategy descriptions explaining markets traded, entry and exit criteria, risk management rules, expected performance characteristics, and unsuitable market conditions.
Example of strong transparency:
“Swing trading EUR/USD and GBP/USD using daily timeframe momentum strategies. Typical hold period 3-7 days.
Risk 1.5% per trade with 2:1 minimum reward target. Expect 60-65% win rate with maximum 20% drawdown.”
Avoid providers offering vague descriptions like “Professional trading using advanced techniques.” Such empty statements reveal either lack of genuine strategy or unwillingness to be held accountable.
Performance Reporting and Accountability
Transparent providers regularly share detailed performance updates including weekly/monthly return summaries, trade-by-trade rationale explanations, market outlook and positioning changes, and honest assessment of mistakes.
Monitoring and Reviewing Provider Performance
Selecting the right strategy provider isn’t a one-time decision but an ongoing process requiring regular evaluation and willingness to make changes when circumstances calling for it.
Establishing Review Schedules
Create systematic review intervals: weekly checks for quick position reviews, monthly deep dives for comprehensive performance analysis comparing actual results against expectations, and quarterly strategy reviews to assess whether to maintain, adjust, or cease copying relationships.
During monthly reviews, evaluate returns versus stated targets, drawdown levels and recovery patterns, trading frequency and style consistency, risk management adherence, and strategy description alignment.
Calculate month-over-month metrics:
| Metric | This Month | Last Month | 3-Month Avg | Status |
| Return | +4.2% | +3.8% | +3.5% | ✓ Good |
| Drawdown | -8% | -12% | -10% | ✓ Normal |
| Win Rate | 62% | 65% | 64% | ✓ Consistent |
| Avg Risk | 1.8% | 1.5% | 1.6% | ⚠ Monitor |
This tracking reveals trends early, enabling proactive rather than reactive decisions.
Recognising Warning Signs
Certain behaviours signal deteriorating provider quality:
- Drawdown exceeding stated maximum by 50%+,
- Sudden leverage increases without explanation,
- Style changes contradicting original strategy, long periods without trading followed by frantic activity,
- Doubling position sizes to recover losses (martingale behaviour).
Example decision framework:
| Deviation Level | Description | Action Required |
| Minor Deviation | Within 20% of norms | Requires continued monitoring |
| Moderate Deviation | 20-50% variance | Suggests reducing allocation by 50% |
| Severe Deviation | 50%+ variance | Demands to stop copying immediately |
Building a Diversified Provider Portfolio
Rather than concentrating all capital with the right strategy provider, sophisticated followers build diversified portfolios across multiple providers with complementary characteristics.
Diversification Principles
Spread risk across trading styles:
- (Combine scalping, swing, and position traders),
- Market focus (mix forex specialists, equity traders, and commodity experts),
- Risk profiles (blend conservative, moderate, and selective aggressive providers),
- Geographic timing (include providers trading different session hours).
Example of a diversified portfolio:
| Provider | Style | Markets | Risk | Allocation |
| Provider A | Swing | Forex majors | Low | 30% |
| Provider B | Day | Indices | Moderate | 25% |
| Provider C | Position | Commodities | Low | 20% |
| Provider D | Scalp | Crypto | High | 15% |
| Provider E | Swing | Stocks | Moderate | 10% |
This allocation spreads capital across five distinct approaches, preventing single-provider failure from devastating the entire copy trading account.
Correlation Analysis
Avoid false diversification by checking provider correlation: Five forex scalpers trading EUR/USD aren’t truly diversified regardless of individual differences. Seek providers with under 40% position overlap for genuine diversification.
Rebalance quarterly: Reduce allocations to underperforming providers, increase allocations to consistent performers within risk limits, replace chronically poor performers, and maintain maximum 30-35% allocation to any single provider.
Practical Steps to Choose the Right Strategy Provider
Translating theory into action requires systematic evaluation process ensuring thorough assessment before committing capital.
Step 1: Define Your Requirements
Document available capital, risk tolerance, preferred trading style, time commitment, return expectations, and geographic/regulatory preferences.
Step 2: Screen Potential Providers
Use platform filters to identify candidates with minimum 6-12 months track record, maximum drawdown under your tolerance threshold, trading style matching preferences, minimum follower count, and positive risk-adjusted returns.
Step 3: Deep Due Diligence
Analyse month-by-month performance consistency, detailed trade history, strategy description clarity, risk management discipline, communication quality, and fee structure transparency.
Step 4: Start Small and Scale
Begin with minimum allocation (10-15% of copy trading capital), monitor for 1-2 months, verify actual performance matches statistics, assess your psychological comfort, and gradually increase if provider proves reliable.
Step 5: Ongoing Management
Conduct weekly position checks, monthly performance reviews, quarterly strategy assessments, annual provider portfolio rebalancing, and continuous improvement.
Common Mistakes to Avoid
Even experienced copy traders make recurring errors:
- Chasing Recent Winners: Providers showing 200% quarterly returns attract floods of new followers, often right before performance normalises.
- Ignoring Risk Metrics: Returns without context mislead. A provider with 60% annual return but 55% maximum drawdown offers terrible risk-adjusted performance.
- Overlooking Fees: Performance fees and management fees significantly impact net returns.
- Insufficient Diversification: Concentrating 80%+ of capital with one provider creates unnecessary concentration risk.
- Emotional Decision Making: Abandoning providers during normal drawdown periods or chasing hot performers typically produces poor results.
Why Choose VT Markets for Copy Trading
VT Markets offers comprehensive copy trading solutions designed for both new followers and experienced copiers seeking the right strategy provider matches.
Platform advantages:
- Begin copying from just USD 10, enabling proper diversification.
- Comprehensive provider statistics displayed, including:
- Estimated profitability over 6-12+ months
- Maximum drawdown
- Preferred instruments
- Leverage usage
- Trading frequency
- Switch between copying and providing roles, adjusting allocations instantly.
- Maintain complete control over risk parameters.
- Lightning-fast execution under 2 seconds.
- Micro-lot trading from 0.01.
- Seamless MetaTrader 4/5 integration.
Extensive resources:
- Articles, webinars, and platform tutorials supporting continuous learning.
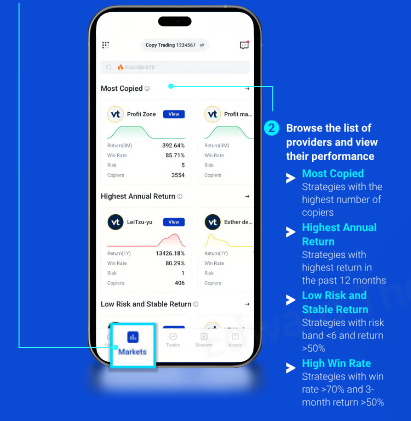
User-friendly provider filtering system:
- Available through the ‘Discover’ tab and ‘Community’ section.
- Allows sorting by:
- Trading metrics
- Ratings
- Returns
- Time periods
- Risk bands
- Simplifies the process of finding the right strategy provider for your specific requirements.
FAQs
- What’s the minimum track record I should look for in a provider?
Seek providers with at least 3-6 months of verified trading history. Longer histories of 6+ months offer even greater confidence, showing the provider survived multiple market cycles.
- How many providers should I copy simultaneously?
For accounts under $50, copy 2-3 providers to ensure meaningful allocation whilst maintaining basic diversification. Accounts of $100-500 work well with 4-6 providers. Larger accounts above $1,000 can effectively manage 6-10+ providers across different styles and markets.
- Should I choose providers with the highest returns?
Not necessarily. Highest returns often come with highest risks and frequently prove unsustainable. Focus on risk-adjusted returns, examining drawdown, consistency, and win rate alongside total returns. A provider with steady 25-30% annual returns and 15% maximum drawdown typically outperforms someone with volatile 80% returns but 50% drawdowns.
- How often should I review my copied providers?
Conduct quick position checks weekly to ensure nothing dramatically changed. Perform comprehensive monthly reviews analysing returns, drawdown, consistency, and strategy alignment. Execute deeper quarterly assessments to decide whether to maintain, adjust, or cease copying relationships.
- What fees should I expect when copying providers?
Fee structures vary significantly. Many providers charge performance fees (typically 10-30% of profits generated), some add management fees (1-3% annually), and platforms may apply spread mark-ups or commissions. Always calculate total cost impact on net returns. A provider with 20% performance fee producing 40% gross returns (32% net) might offer better value than a provider with 10% fee producing 25% gross returns (22.5% net).
Start Copy Trading with VT Markets Today
If you are ready to explore copy trading, VT Markets provides access to tools and platforms to help you get started. Trade on the robust VT Markets app, designed for speed, reliability, and advanced trading features.For ongoing support, our Help Centre offers resources and platform guidance to help you build confidence as you learn.
Open your account with VT Markets today and access secure, transparent, and competitive copy trading across some of the world’s most popular markets.


