





Key Takeaways:
- Volume spread analysis reads three things on every bar: volume, the spread from high to low, and where price closes.
- It shows whether professional money is buying or selling, rather than simply following price direction.
- It works on forex, gold and index CFDs using tick volume, which counts price changes instead of contracts traded.
- Signals only mean something in context. The same bar can be bullish or bearish depending on what came before it.
- VSA is a reading skill, not an automated system. Screen time matters more than any single tool.
Most traders watch price and ignore what is powering it. A candle closes green, so they assume buyers are in control. Often they are not.
Volume spread analysis exists to test that assumption. It compares how much activity took place on a bar with how far price actually travelled, then asks one question. Did the effort match the result?
This guide covers the logic, the core signals, and how to apply the method on MetaTrader 4 and MetaTrader 5. All this comes with worked calculations and a realistic learning path.
What Is Volume Spread Analysis?
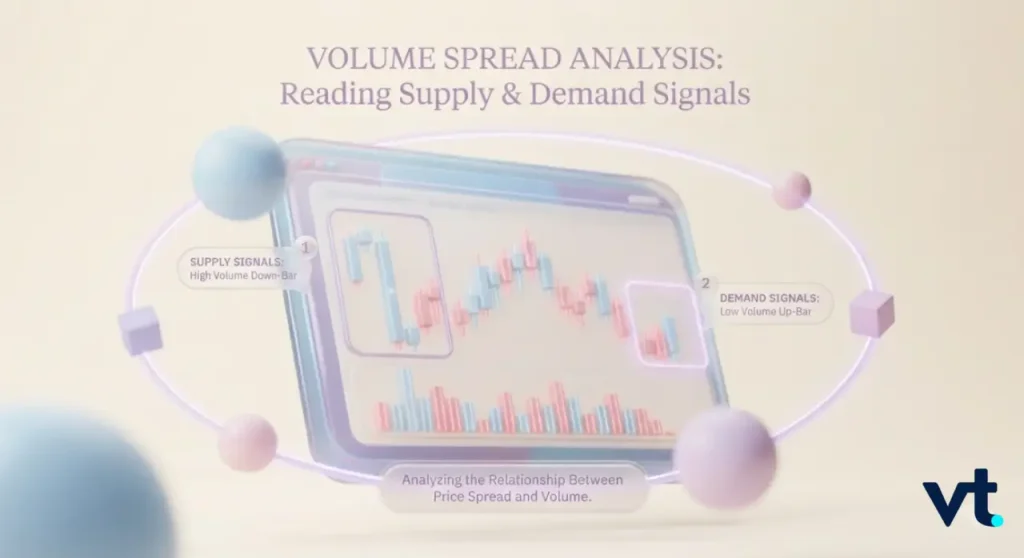
Volume spread analysis is a chart reading method. It studies the relationship between traded volume, the range of a bar, and the closing position inside that range. The aim is to judge whether supply and demand are shifting behind the scenes. It is interpretive rather than mechanical. You build a case, bar by bar.
The Three Data Points: Volume, Spread And Close
- Volume: activity during the bar, judged against a rolling average rather than an absolute number.
- Spread: the distance from high to low. A wide spread means price moves freely. A narrow spread means it met resistance.
- Close: It is where the price finished inside the bar. This is the tiebreaker, and the reading most traders skip.
Where VSA came from: Wyckoff to Tom Williams
VSA traces back to Richard Wyckoff, who studied how price and volume move together in the early 1900s. This study showed that markets cycle through accumulation and distribution driven by large operators.
Tom Williams, a former syndicate trader, built on this in Master the Markets, turning those broad phases into named, repeatable bar patterns.
How Volume Spread Analysis Differs From Standard Volume Indicators
On-balance volume and money flow tools aggregate across many bars, which hide the individual footprint. VSA treats each bar as a separate event with its own story.
Indicator readings lag by design. Bar reading does not. VSA always weighs volume against the range. Most volume tools ignore the range entirely.
The Core Assumption: Professional Money Leaves A Footprint
Large institutional orders cannot be hidden. Filling size takes time, and it distorts the relationship between volume and range in ways small orders never do.
So how do you know if volume is buying or selling? Raw volume is neutral, because every trade has a buyer and a seller. The close tells the story. Heavy volume closing near the low suggests sellers absorbed the buying. Heavy volume closing near the high suggests the reverse.
How Volume Spread Analysis Works
The mechanics rest on one comparison, repeated endlessly: effort against result.
Effort Versus Result Explained
Volume is the effort. The spread is the result. When they agree, the move is genuine. When they disagree, something absorbs pressure.
A worked example on EUR/USD:
- High 1.0850, low 1.0800, so the spread is 50 pips.
- The 20-bar average spread is 25 pips, making this bar twice the norm.
- Volume is 4,200 against a 20-bar average of 1,800, roughly 2.3 times average.
Effort and result match, so the move is credible. Now change one input. If that same 4,200 volume produced only a 12-pip spread, effort massively exceeded result. Someone was selling into the buying.
Reading The Spread Against The Volume
- High volume, wide spread: genuine participation, usually continuation.
- High volume, narrow spread: absorption, often a turning point.
- Low volume, wide spread: a thin market drifting, easily reversed.
- Low volume, narrow spread: disinterest, often a pause before the real move.
Why The Close Tells You Who Won The Bar
The close turns a range into a verdict. Work it out as a percentage.
Take a gold bar with a high of 2,400, a low of 2,380 and a close of 2,382:
- Range: 2,400 minus 2,380 equals 20 dollars.
- Close position: 2 divided by 20 equals 10 per cent.
- Verdict: a close in the bottom 10 per cent of a wide, high volume bar is a clear sign of weakness.
Background Context: Accumulation And Distribution Phases
No signal means anything without background context. Accumulation is a period where large buyers absorb supply inside a range, usually after a decline. Distribution is the mirror image after an advance.
A bullish bar inside accumulation is worth acting on. The same bar inside distribution is usually a trap.
Key VSA Signals And What They Mean
Treat these named patterns as vocabulary, not as rules.
Signs Of Weakness: No Demand, Upthrust, Buying Climax
- No demand bar: an up bar with a narrow spread and volume lower than the previous two bars.
- Upthrust: price pushes above a recent high, then closes near the low on heavy volume. Late buyers are trapped.
- Buying climax: an unusually wide up bar on the heaviest volume in weeks, typically ending a long advance.
Signs Of Strength: No Supply, Spring, Stopping Volume, Selling Climax
What are the signs of strength in VSA? They are bars where selling pressure appears but fails to produce further downside.
- No supply bar: a down bar with a narrow spread and unusually low volume. Sellers have run out.
- Spring or shakeout: price dips below support, then recovers to close back inside the range.
- Stopping volume: very high volume on a down bar closing in the middle or upper third of its range.
- Selling climax: panic selling on extreme volume, followed by a sharp recovery into the close.
Tests And Retests
A test bar revisits an earlier area of selling on light volume. Low volume with a strong close means the supply has gone. If volume returns, the area is still contested. Tests confirm, they do not trigger.
Volume And Spread Combinations At A Glance
| Volume | Spread | Close position | Likely reading |
| Very high | Wide | Near low, after an uptrend | Buying climax or upthrust |
| Very high | Narrow | Near high, after a decline | Stopping volume |
| Low | Narrow | Near high, in an uptrend | No supply, bullish |
| Low | Narrow | Near low, in a rally | No demand, bearish |
| Average | Wide | Near high, breaking resistance | Genuine breakout |
| High | Wide | Mid-range, at resistance | Absorption, wait |
How To Read A Volume Spread Analysis Chart Step By Step
How to read volume spread analysis? Work through the same five steps every time, in the same order. Jumping straight to step four is the most common beginner error.
Step One: Establish The Background
- Identify the prevailing trend on a higher timeframe.
- Mark obvious support, resistance and recent ranges.
- Decide whether the market has been accumulating or distributing.
Step Two: Measure The Spread Against Recent Bars
Compare the current range with the last 20 bars.
- Above 1.5 times the average: wide
- Below 0.7 times the average: narrow
Step Three: Compare Volume To Its Average
Apply a 20-period moving average to your volume histogram, then classify:
- Below 0.7 times average: low
- 0.7 to 1.3 times average: average
- 1.3 to 2 times average: high
- Above 2 times average: ultra high
Step Four: Locate The Close
Split the range into thirds.
- Upper third: buyers won the bar
- Lower third: sellers won the bar
- Middle third: unresolved, wait
Step Five: Wait For Confirmation On The Following Bars
One bar is a hypothesis. Confirmation usually arrives within one to three bars.
- After a sign of weakness, look for a no demand bar on the next rally attempt.
- After a sign of strength, look for a low volume test that holds.
- If the next bars contradict the reading, it was wrong. Move on.
Using Volume Spread Analysis In Forex, Indices And Commodities
Applying VSA well means knowing how the data behaves across instruments. Below explains forex tick volume versus real volume, VSA on gold and index CFDs, choosing the right timeframe, and why session timing is crucial.
Tick Volume Versus Real Volume In Forex
Forex is decentralised, so there is no consolidated volume figure. MetaTrader platforms display tick volume, which counts price changes rather than contracts traded.
Tick counts track real activity closely enough on major pairs for the method to work. VT Markets supports tick volume on MT4 and MT5, where the volume histogram reflects market activity through the number of price changes recorded in each period.
Applying VSA To Gold And Index CFDs
- XAUUSD: watch for upthrusts at round numbers, where stop clusters sit.
- Index CFDs: climactic volume often appears in the first hour of the cash session.
- Oil: inventory releases distort volume, so treat those bars as noise.
Choosing A Timeframe For Cleaner Signals
Higher timeframes aggregate more activity per bar, so readings carry more weight.
| Trading style | Context chart | Signal chart |
| Swing | Weekly | Daily |
| Day trading | Daily | 1 hour |
| Intraday active | 4 hour | 15 minute |
Below the 15-minute chart, tick volume becomes noisy and signal quality drops away quickly.
Session Liquidity And Why Timing Matters
Compare bars only with bars from the same session. Treat London and New York overlap as the highest quality reading window. Ignore spikes in the final minutes before the daily rollover. Remember that twice average volume in Asian hours may just be an early European desk.
Volume Spread Analysis Compared To Other Methods
VSA is one way to read the market. However, it’s worth seeing how it compares to other approaches. Let’s explore VSA versus volume profile, VSA versus order flow and footprint charts, and how VSA fits alongside price action trading.
VSA Versus Volume Profile
Volume profile maps how much volume traded at each price level over a period, so it is structural. VSA is behavioural, reading intent bar by bar. Many traders use profile to find the levels and VSA to time the reaction.
VSA Versus Order Flow And Footprint Charts
Order flow and footprint charts show executed bids and offers inside each bar. That is far more granular, but it needs exchange-traded data and specialist software. VSA gets a rougher version of the same insight from data every charting package already has.
How VSA Sits Alongside Price Action
VSA is not an alternative to price action trading. It is a filter for it. When a pin bar forms at resistance on ultra high volume with a weak close, the price signal and the volume signal agree. That agreement is what you are hunting.
Platforms, Charts And Volume Spread Analysis Indicators
Getting VSA onto your charts is mostly a setup problem. This section describes building a volume histogram and average, applying VSA on MetaTrader 4 and 5, doing the same on TradingView, and weighing manual reading against automated labelling.
Setting Up A Volume Histogram And Volume Average
- A candlestick or bar chart with no clutter.
- A volume histogram in the lower pane.
- A 20-period moving average applied to that volume.
- Horizontal lines marking recent swing highs and lows.
VSA On MetaTrader 4 And MetaTrader 5
Both platforms include tick volume as standard. Attach the built-in Volumes indicator, drag a moving average onto the histogram, then set the apply-to field to First Indicator’s Data. A MetaTrader 5 account at VT Markets gives you this in under a minute.
VSA On TradingView
TradingView offers a built-in volume study with an optional average, plus community scripts that label bars automatically. Chart the instrument you actually trade, and check the feed matches your broker’s pricing before drawing conclusions.
Manual Reading Versus Automated Labelling
A volume spread analysis indicator can flag textbook patterns, which speeds up learning. What it cannot do is judge background context, and that is where the edge lives:
- Use automated labels as a study aid in your first few months.
- Always check whether the flagged bar sits in accumulation or distribution.
- Expect a large share of labels to be contextually irrelevant.
- Move to manual reading once you can pre-empt them.
Limitations And Common Volume Spread Analysis Mistakes
VSA is useful, but easy to misuse. Let’s find out why bars need context, why readings are subjective, how news and gaps distort signals, over-trading textbook patterns, and where VSA fits in a wider strategy.
Why Signals Fail Without Background Context
The biggest cause of failure is reading a bar in isolation. A no demand bar inside a strong, well-supported uptrend is often just a quiet pause.
The Subjectivity Problem
Two skilled readers can disagree about the same bar. Wide and narrow are relative judgements. Writing down your thresholds, as in the five steps above, removes some of the guesswork.
News Events And Liquidity Gaps
- Volume spikes on data releases reflect positioning, not intent.
- Gaps break the spread calculation entirely.
- Thin holiday sessions produce false climaxes.
- Treat the first bar after a major release as unreadable.
Over-Trading Textbook Patterns
Beginners find upthrusts everywhere. The genuine ones are rare, appearing at meaningful levels after an extended move. If you are spotting several a day on one instrument, your criteria are too loose.
Where VSA Should Sit In A Wider Strategy
It is a decision filter, not a complete strategy. It belongs alongside a defined trend framework, a position sizing rule and a fixed risk limit per trade. Most professionals use it to veto trades as much as to find them.
How To Start Learning Volume Spread Analysis
Learning VSA is a gradual process built on structured practice. This last section talks about building a signal checklist, practising on a demo account, and setting a realistic timeline for progress.
Building A Signal Checklist
Write a one-page checklist and refuse to trade without it.
- What is the background, accumulation or distribution?
- Is the spread wide, average or narrow versus the last 20 bars?
- Is volume low, average, high or ultra high?
- Where did price close within the range?
- Does the next bar confirm or contradict?
Practising A Demo Account
Mark up 20 charts a week without placing a trade. Screenshot each signal, then review the outcome five bars later. A demo account lets you run this drill on live pricing at no cost, which matters because historical replay hides the hesitation you feel in real time.
A Realistic Learning Timeline
| Stage | Duration | Focus |
| Recognition | Weeks 1 to 4 | Naming bars correctly after the fact |
| Context | Months 2 to 3 | Placing bars within phases |
| Application | Months 4 to 6 | Demo trading with the checklist |
| Integration | Months 6 to 12 | Combining VSA with a full strategy |
Most traders need six to twelve months before the method meaningfully improves results. That is normal. It is a reading skill, and reading skills take repetition. Improve further before heading into live trading.
Link this :How to Know When You’re Ready to Move from Demo to Live
Frequently Asked Questions (FAQs)
Q1: What is volume spread analysis?
It is a technical method that reads three data points on each price bar: volume, the spread from high to low, and where price closes within that range. It aims to reveal whether professional money is accumulating or distributing, rather than simply following price direction.
Q2: Does volume spread analysis work in forex?
Yes, although forex is decentralised and has no consolidated volume figure. Most platforms display tick volume, which counts price changes rather than contracts traded. Tick volume correlates closely enough with real activity for the principles to remain usable on major pairs.
Q3: What is the difference between volume spread analysis and volume profile?
VSA reads bar by bar relationships between volume, spread and close to infer market intent. Volume profile maps how much volume traded at each price level over a period, showing value areas and high volume nodes. VSA is behavioural, volume profile is structural.
Q4: What timeframe is best for volume spread analysis?
Any timeframe works, but signals are cleaner on higher timeframes where each bar aggregates more activity. Many traders read the daily or four hour chart for context, then look for confirming signals on the one hour or fifteen minute chart.
Q5: Is volume spread analysis suitable for beginners?
It is accessible in principle, because it needs only a price chart and a volume histogram. However it is interpretive rather than mechanical, so beginners need screen time to judge signals in context. Practising on a demo account is the standard starting point.
Start Reading Supply And Demand With VT Markets
Volume spread analysis will not hand you signals. What it gives you is a way to question every candle before you commit capital to it. That habit alone separates traders who react from traders who anticipate.
Begin with one instrument and one timeframe. Add the volume histogram, apply the five-step checklist, and build a library of annotated screenshots. Within a few months, the same footprints will start to repeat in front of you.
Open a live or demo account with VT Markets. Practise on real spreads and real execution across forex, gold, index CFDs and others on MetaTrader 4 and MetaTrader 5.
This article is intended for informational and educational purposes only and does not constitute investment, financial, or professional advice. Trading Gold and other financial instruments involves significant risk, including the possible loss of capital. Past performance is not indicative of future results. Always conduct your own research and consider seeking independent professional advice before making any trading decisions.








