






Key Points
- The dollar index traded near 101 after advancing for two consecutive sessions.
- Escalating US-Iran tensions lifted oil prices and increased concerns about renewed inflation pressure.
- Cleveland Fed President Beth Hammack warned that persistent inflation remained the central bank’s main concern.
- The USDX daily chart places immediate resistance near 100.85, while 100.70 is the first support level to monitor.
The dollar index traded near 101 on Monday after rising for two consecutive sessions, supported by escalating tensions between the US and Iran.
Higher oil prices increased concerns that renewed energy-market pressure could keep inflation elevated and reinforce expectations that US interest rates may remain higher for longer.
The dollar also drew support from expectations of a possible Federal Reserve rate increase later this year, while continued weakness in the Japanese yen added to broader dollar demand.
Why Traders Are Watching the Dollar
The dollar remains sensitive to three main drivers: developments in the US-Iran conflict, Federal Reserve policy expectations and continued pressure on the Japanese yen.
Further escalation in the Middle East could keep oil prices elevated and intensify inflation concerns. This may make it more difficult for the Federal Reserve to consider lower interest rates and reinforce expectations that monetary policy will remain restrictive.
Japan’s inflation data on Friday is another important event. The result could affect expectations for the Bank of Japan’s next policy move and determine whether USDJPY can move above its year-to-date high.
US-Iran Conflict Lifts Safe-Haven Demand
The US military carried out fresh airstrikes against Iran on Sunday after the number of confirmed American military deaths in the renewed fighting rose to three.
The strikes came as the ceasefire between the US and Iran effectively broke down. Iran also said it had intercepted four vessels attempting to pass through the Strait of Hormuz over the weekend.
The escalation increased concerns about a wider conflict and potential disruption to energy supplies passing through the Strait of Hormuz.
Higher oil prices may support the dollar by strengthening safe-haven demand and increasing inflation expectations through higher energy costs.
If oil prices remain elevated, markets may become more cautious about expecting the Federal Reserve to ease monetary policy.
Persistent Inflation Supports Fed Rate Expectations
Cleveland Fed President Beth Hammack joined a growing number of Federal Reserve officials warning about persistent inflation on Friday.
Her comments reinforced concerns that price pressures remain above the central bank’s target and may require monetary policy to stay restrictive.
At the time of writing, market pricing placed the probability of a Federal Reserve rate increase in September at around 53%, up from 47% a day earlier.
The central bank is still widely expected to leave interest rates unchanged at its July meeting. However, the increase in expectations for a September move has provided additional support for the dollar.
Further warnings from Federal Reserve officials or another rise in energy prices could strengthen expectations that US interest rates will remain elevated.
Yen Weakness Adds to Dollar Support
The dollar was little changed against the Japanese yen at approximately 162.33, remaining close to its year-to-date high of 162.84.
CBA’s Global Economic & Markets Research expects USDJPY to remain close to its year-to-date high during the week.
Japan’s inflation data on Friday will be the main focus. Weaker-than-expected core inflation could delay expectations for the Bank of Japan’s next policy tightening.
This could place additional pressure on the yen and potentially push USDJPY through resistance near 162.84.
Stronger Japanese inflation, however, could support expectations of earlier Bank of Japan tightening and limit further dollar gains against the yen.
Key Trading Levels
| Price Level | What Traders Are Watching |
| 101.4 | Wider resistance near the previous consolidation area |
| 101.3 | Recent swing-high resistance |
| 101 | Psychological resistance |
| 100.85 | Immediate resistance near the latest session high |
| 100.77 | Current chart area |
| 100.7 | Immediate support near the latest consolidation |
| 100.5 | Short-term support and recent recovery base |
| 100.35 | Recent swing-low area |
| 100 | Deeper psychological support |
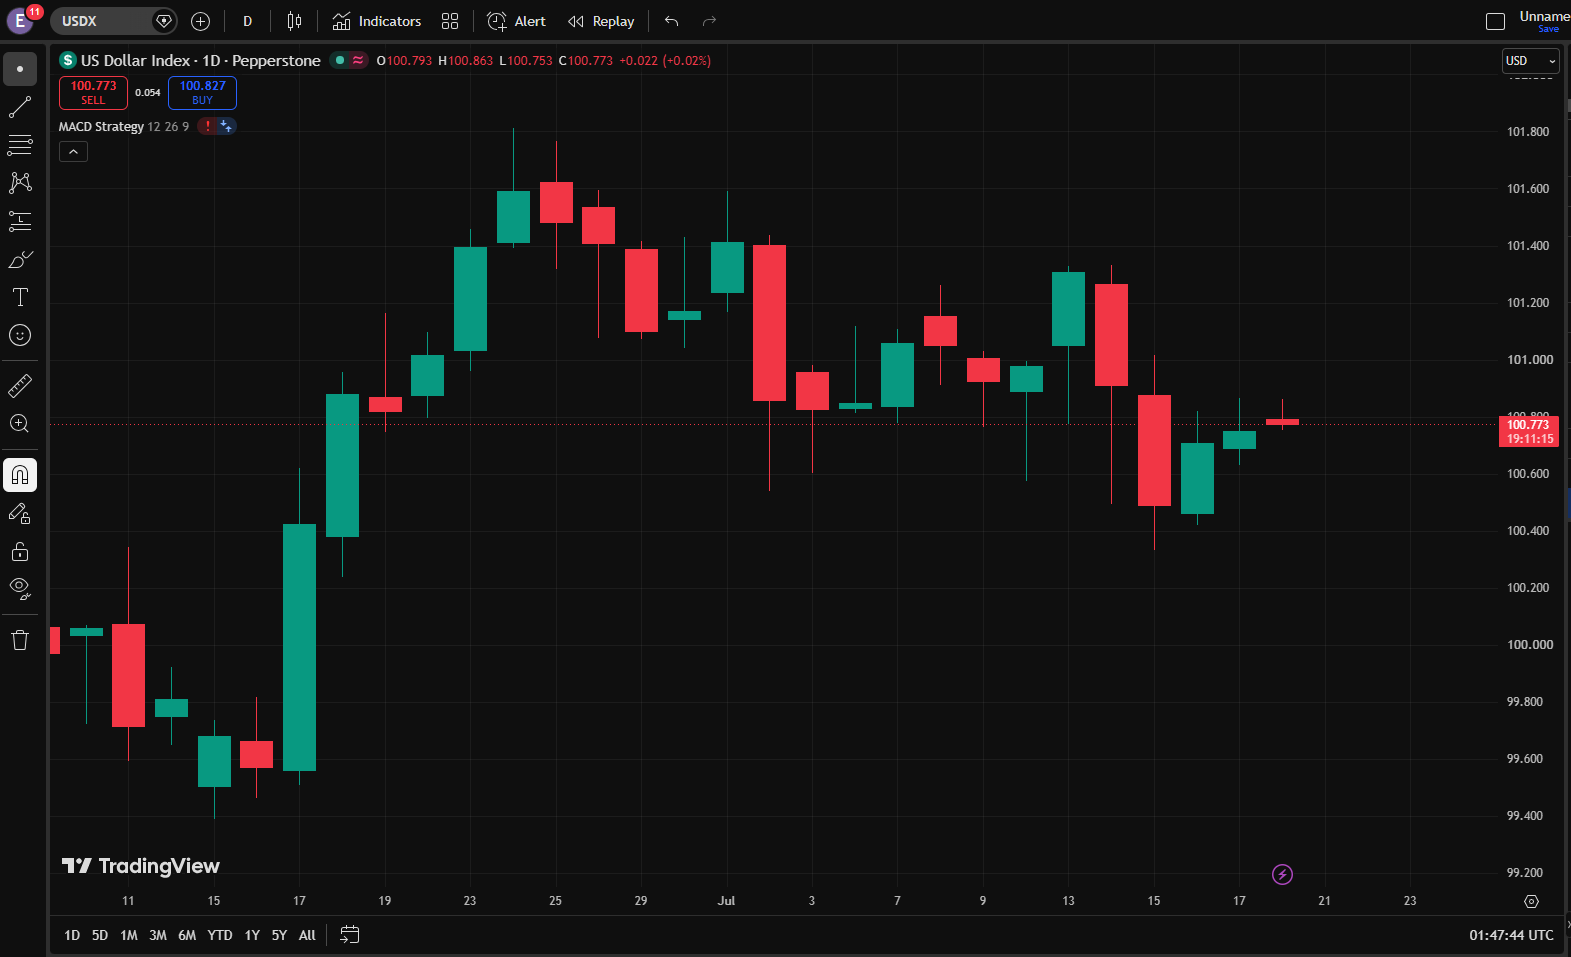
The US Dollar Index daily chart shows price trading near 100.77 after opening around 100.79. The latest session high stood near 100.86, while the low was approximately 100.75.
The index has recovered from its recent low near 100.35, but the latest candles suggest that upward momentum has slowed as price approaches resistance between 100.85 and 101.00.
Immediate resistance is located near 100.85. A sustained move above this level could bring the psychological 101.00 level into focus.
A confirmed break above 101.00 would strengthen the recovery and shift attention towards 101.30, followed by wider resistance near 101.40.
On the downside, 100.70 is the first support level to monitor. A break below this area could expose 100.50.
Bullish and Bearish Setups
| Setup | Trigger | Potential Market Reaction |
| Bullish Breakout | Move above 100.85 | USDX may test 101.00 |
| Bullish Extension | Sustained break above 101.00 | Attention may shift towards 101.30 |
| Stronger Upside Move | Break above 101.30 | The index may approach 101.40 |
| Range Consolidation | Remain between 100.70 and 100.85 | Traders may wait for clearer geopolitical or Fed signals |
| Bearish Pullback | Fall below 100.70 | USDX may retest 100.50 |
| Deeper Correction | Break below 100.50 | Price may decline towards 100.35 |
| Bearish Extension | Fall below 100.35 | The psychological 100.00 level may come into focus |
The bullish scenario depends on the dollar index breaking above 100.85 and holding above that level. This would indicate that dollar demand remains supported by geopolitical uncertainty, higher oil prices and restrictive Federal Reserve expectations.
A confirmed move above 101.00 would strengthen the bullish setup and bring 101.30 into focus. A further break above 101.30 could expose wider resistance near 101.40.
The neutral scenario is continued consolidation between 100.70 and 100.85. Range-bound movement may indicate that traders are waiting for clearer developments in the US-Iran conflict, oil prices or Federal Reserve policy expectations.
The bearish scenario strengthens if the index falls below 100.70. A confirmed break could bring 100.50 into focus.
Disclaimer
The price levels and market scenarios above reflect the author’s view at the time of writing and do not represent financial advice or an official recommendation from VT Markets. Traders should conduct their own analysis and manage risk carefully.
Trade USDX CFDs With VT Markets
USDX remains active when Federal Reserve policy, inflation expectations, oil prices, geopolitical risks and global currency flows move together.
With VT Markets, traders can access USDX CFDs alongside major forex pairs, gold, oil, indices, shares, ETFs and other global CFD markets on a single platform.
This allows traders to follow the broader dollar outlook while comparing movements across USDJPY, EURUSD, AUDUSD, XAUUSD and crude oil.
Use VT Markets’ charting tools to monitor support, resistance, moving averages and breakout behaviour as the next USDX setup develops.
Start trading indices with VT Markets today.
Why Trade USDX as a CFD?
USDX CFDs allow traders to take a view on rising or falling US dollar index movements without owning the underlying currency basket.
This flexibility can be useful when the dollar reacts quickly to Federal Reserve expectations, inflation signals, oil-price movements, geopolitical developments and safe-haven demand.
If USDX breaks above resistance, traders can monitor the market for bullish continuation. If momentum weakens or profit-taking increases, traders can assess potential downside setups.
With VT Markets, traders can follow USDX price action in real time and compare it with other major CFD markets through one account.
What to Watch Next
Developments in the US-Iran conflict remain the main near-term focus. Further military escalation or disruption around the Strait of Hormuz could push oil prices higher and strengthen demand for the dollar.
Federal Reserve communication will also remain important. Additional warnings about persistent inflation could reinforce expectations that interest rates will stay restrictive or that another rate increase may be considered later in the year.
Japan’s inflation data on Friday is another key event. Weaker core inflation could delay expectations for Bank of Japan tightening, place further pressure on the yen and push USDJPY towards or above its year-to-date high of 162.84.
Stronger Japanese inflation could support expectations of earlier Bank of Japan tightening and limit dollar gains against the yen.
For USDX, the 100.70 to 100.85 range is the main short-term area to watch. A confirmed move above 100.85 could bring 101.00 into focus, while a break below 100.70 may expose 100.50.
Frequently Asked Questions
Why is the dollar index trading near 101?
The dollar is supported by escalating US-Iran tensions, higher oil prices, persistent inflation concerns and expectations of a possible Federal Reserve rate increase.
Why do higher oil prices support the dollar?
Higher oil prices can increase inflation expectations and safe-haven demand. This may reduce expectations for lower US interest rates and support the dollar.
What is the market expecting from the Federal Reserve?
The Federal Reserve is widely expected to leave interest rates unchanged at its July meeting. At the time of writing, market pricing placed the probability of a September rate increase at around 53%.
Why does Japan’s inflation data matter for the dollar?
Weaker Japanese inflation could delay the Bank of Japan’s next policy tightening, weaken the yen and support further gains in USDJPY.
What are the main USDX levels to watch?
Immediate resistance is near 100.85, followed by 101.00 and 101.30. Immediate support is near 100.70, followed by 100.50 and 100.35.
What could push USDX higher?
Further US-Iran escalation, higher oil prices, stronger inflation concerns, tighter Federal Reserve expectations or continued yen weakness could push USDX higher.
What could push USDX lower?
Lower oil prices, reduced geopolitical tension, softer inflation expectations or a decline in expectations for Federal Reserve tightening could pressure USDX.
Start trading now — click here to create your real VT Markets account.








