






Key Points
- Bitcoin slipped below $74,000, declining around 2% over 24 hours as stronger-than-expected US inflation weighed on risk appetite.
- October CPI rose 0.4% month-on-month, exceeding the 0.3% forecast and reinforcing concerns about further Federal Reserve tightening.
- Traders are monitoring Treasury yields, the US dollar and Bitcoin’s performance alongside the Nasdaq.
Market Move
Bitcoin slipped below $74,000, declining around 2% over 24 hours as investors reacted to stronger-than-expected US inflation.
October’s Consumer Price Index increased 0.4% month-on-month on a seasonally adjusted basis, exceeding the 0.3% forecast and renewing concerns about further Federal Reserve rate hikes.
Treasury yields rose and the US dollar strengthened following the release, adding pressure to cryptocurrencies as investors reassessed the outlook for US monetary policy.
The inflation surprise left Bitcoin struggling to regain momentum, with the market response reflecting continued sensitivity to borrowing costs and demand for speculative investments.
Why Traders Are Watching
The inflation report challenges expectations that price pressures are easing sufficiently for the Fed to avoid further tightening. Traders are assessing whether policymakers will view the result as evidence that borrowing costs need to rise again.
For Bitcoin, higher Treasury yields increase the appeal of interest-bearing investments relative to assets that generate no contractual income. A stronger dollar can also tighten global financial conditions, making it harder for speculative demand to recover.
The persistence of these moves matters more than the initial response. If yields and the dollar continue rising, Bitcoin could face sustained pressure even without additional negative crypto news. A retreat would ease that pressure, although renewed buying would still be needed to support a recovery.
Bitcoin’s performance alongside the Nasdaq provides another indication of investor appetite. Continued weakness across both markets would suggest that monetary-policy concerns are driving investors away from risk assets. Bitcoin holding firm while technology shares struggle could indicate that crypto-specific factors are offsetting broader market pressure.
Key Trading Levels
| Price Level | Significance |
|---|---|
| $74,400–$74,500 | Earlier trading area and potential resistance above the rebound ceiling. |
| $74,000–$74,030 | Recent rebound ceiling and immediate resistance. |
| $73,350–$73,500 | Nearby support around the latest pullback area. |
| $73,000 | Round-number reference within the post-sell-off base. |
| $72,700–$72,800 | Approximate low area of the sharp decline. |
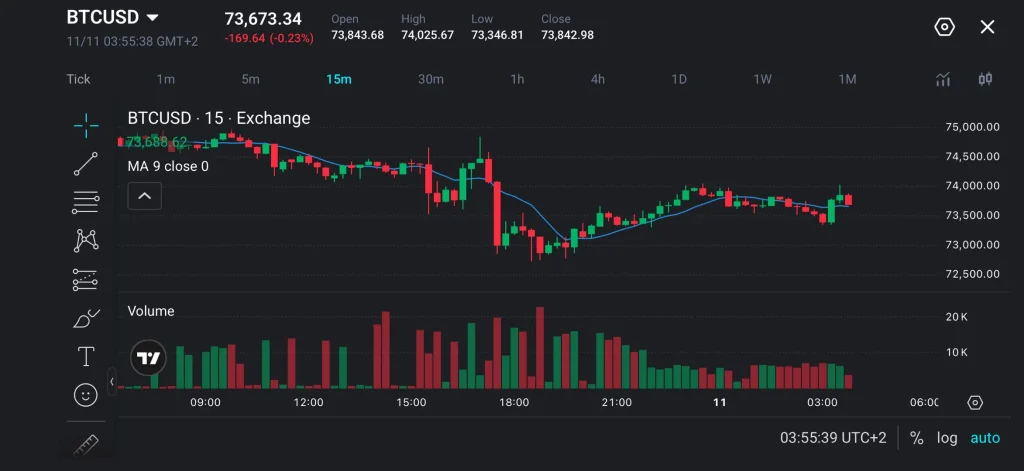
The chart shows a partial recovery from the sell-off lows, followed by consolidation beneath $74,000. Price is moving around a flattening nine-period moving average, suggesting that selling has paused without establishing a clear upward trend.
Volume increased during the decline and generally eased during the recovery. The rebound therefore remains tentative, with the latest pullback area providing an early indication of whether buyers can maintain support.
Bullish and Bearish Setups
| Scenario | Confirmation/ Trigger | Potential Levels |
|---|---|---|
| Bullish recovery | Sustained break above $74,030, followed by a successful retest and higher low. | $74,400–$74,500 |
| Bearish continuation | Sustained break below $73,350, followed by a failed recovery into $73,350–$73,500. | $73,000, then $72,800–$72,700 |
For the bullish setup, buyers need to defend $74,000 after clearing the rebound ceiling. Stronger volume would add conviction, while a return below the retest low would weaken confirmation.
For the bearish setup, renewed selling on a retest of $73,350–$73,500 would suggest that support has turned into resistance. A quick reclaim of that area would weaken the breakdown signal.
Bitcoin Prediction: What Could Drive BTCUSD Up or Down?
Bitcoin’s near-term outlook depends on whether the inflation surprise leads to a lasting shift in expectations for US monetary policy.
Further pressure could develop if Fed officials signal a stronger willingness to raise rates and bond markets continue adjusting to that prospect. A more measured policy response, accompanied by stabilising yields and a softer dollar, could give buyers room to return.
The main developments to monitor are:
- Federal Reserve commentary: Whether policymakers reinforce expectations for another hike or emphasise the need for more evidence.
- Treasury yields and the dollar: Whether the post-inflation gains persist or begin to reverse.
- Nasdaq performance: Whether technology stocks stabilise, helping restore demand for risk assets.
- Bitcoin buying demand: Whether rebounds attract sustained spot buying rather than fading after the initial move.
Beyond the immediate chart structure, a sustained recovery above $75,400 would indicate improving short-term sentiment. If selling extends beneath the recent low area, the psychological $70,000 level could become a broader downside focus. Both are wider scenario references outside the displayed chart range.
Trade Bitcoin with VT Markets
Follow Bitcoin alongside technology indices, forex and other global CFD markets with VT Markets. Use charting tools and market insights to assess how economic releases affect price movements and trading conditions.
Create a live VT Markets account to access trading tools and educational resources. Review the instrument’s trading hours, contract specifications and margin requirements before opening a position.
CFDs are leveraged products and carry a high risk of loss.
Frequently Asked Questions
Why did Bitcoin fall below $74,000?
Stronger-than-expected US inflation renewed concerns about further Federal Reserve rate hikes. Rising Treasury yields and a stronger dollar added pressure to speculative assets.
What did the October US inflation report show?
Headline CPI increased 0.4% month-on-month on a seasonally adjusted basis, exceeding the 0.3% forecast.
Does stronger inflation guarantee another Fed rate hike?
No. Inflation influences the decision, but policymakers also consider employment, economic activity and financial conditions.
Why do traders compare Bitcoin with the Nasdaq?
Their relative performance helps indicate whether Bitcoin is responding to broad changes in risk appetite or developments specific to cryptocurrencies.
What would strengthen Bitcoin’s technical recovery?
A sustained break above $74,030, followed by buyers defending the breakout area, would improve the immediate chart structure.
Start trading now — click here to create your real VT Markets account.



