





Key Takeaways
- AI Market Overview brings together market summaries, sentiment indicators and technical analysis to help traders understand current market conditions.
- Traders can explore potential bullish and bearish opportunities across selected financial instruments.
- Popular long and short positions provide insights into how traders are positioned across different markets.
- Technical analysis offers market-specific insights, including key price levels, potential targets and trading scenarios.
- The AI Market Questions feature provides AI-generated explanations of specific market conditions, price levels and potential trading scenarios.
Keeping up with financial markets involves monitoring price movements, analysing technical indicators and assessing market sentiment across different asset classes. With multiple markets moving at different speeds, gathering and interpreting relevant information can take time.
Access to relevant market insights can help traders assess market conditions and identify areas that may warrant further attention.
In this guide, we take a closer look at VT Markets AI Market Overview, its key features and the insights it provides.
What Is VT Markets AI Market Overview?
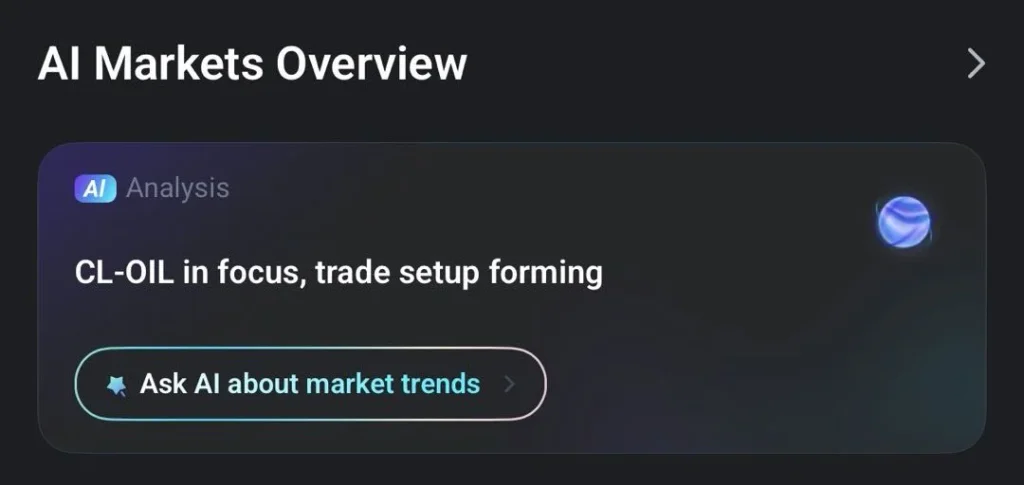
VT Markets AI Market Overview is an AI-powered feature within the VT Markets App that brings together market information and analysis in one place.
It helps traders review different aspects of the financial markets, from overall market sentiment and potential trading opportunities to popular market positions and technical analysis. This provides a more organised way to follow market developments and assess potential trading scenarios.
Key Features of AI Market Overview
1. Market Summary
The Market Summary provides a concise overview of the broader market environment, highlighting key developments that may influence market sentiment.
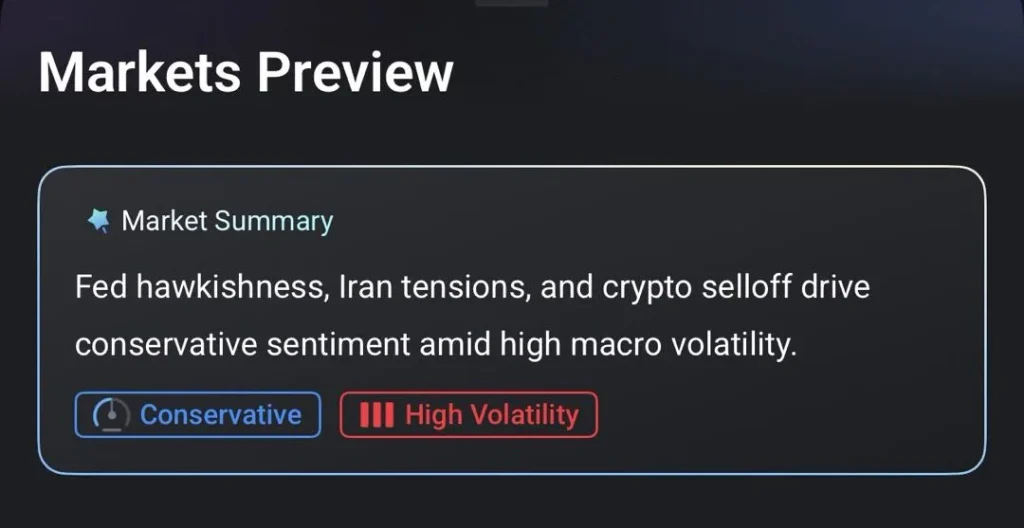
For example, the summary may identify Federal Reserve policy expectations, geopolitical tensions or cryptocurrency market movements as factors shaping investor sentiment.
It also includes two indicators:
- Market Sentiment – Highlights the prevailing market stance, such as Conservative, helping traders gauge the broader market mood.
- Market Volatility – Indicates the prevailing volatility environment, such as High Volatility, providing an indication of potentially more active market conditions.
2. Market Opportunities
The Market Opportunities section highlights selected instruments with either a bullish or bearish outlook, based on the available market analysis.
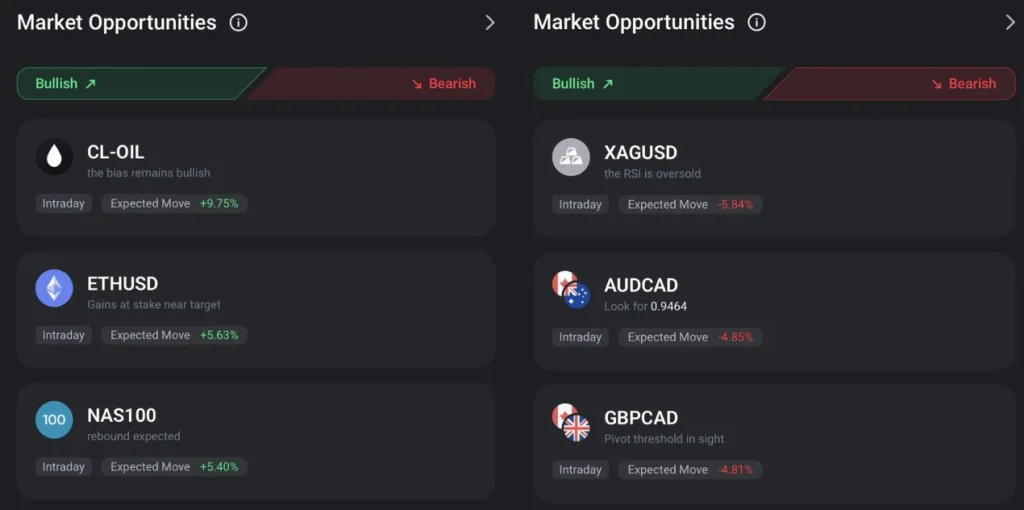
- Bullish indicates potential upward price movement. For example, CL-OIL is shown with a bullish outlook and an Expected Move of +9.75%, while NAS100 is highlighted for a potential rebound with an Expected Move of +5.40%.
- Bearish indicates potential downward price movement. For example, XAGUSD is shown with a bearish outlook and an Expected Move of -5.84%, while AUDCAD has an Expected Move of -4.85%.
Each instrument also features a short market commentary and an estimated Expected Move percentage, indicating the potential direction and scale of price movement identified by the analysis.
Note: Expected Move figures are estimates based on the available analysis and do not guarantee actual price movements.
3. Popular Long and Short Positions
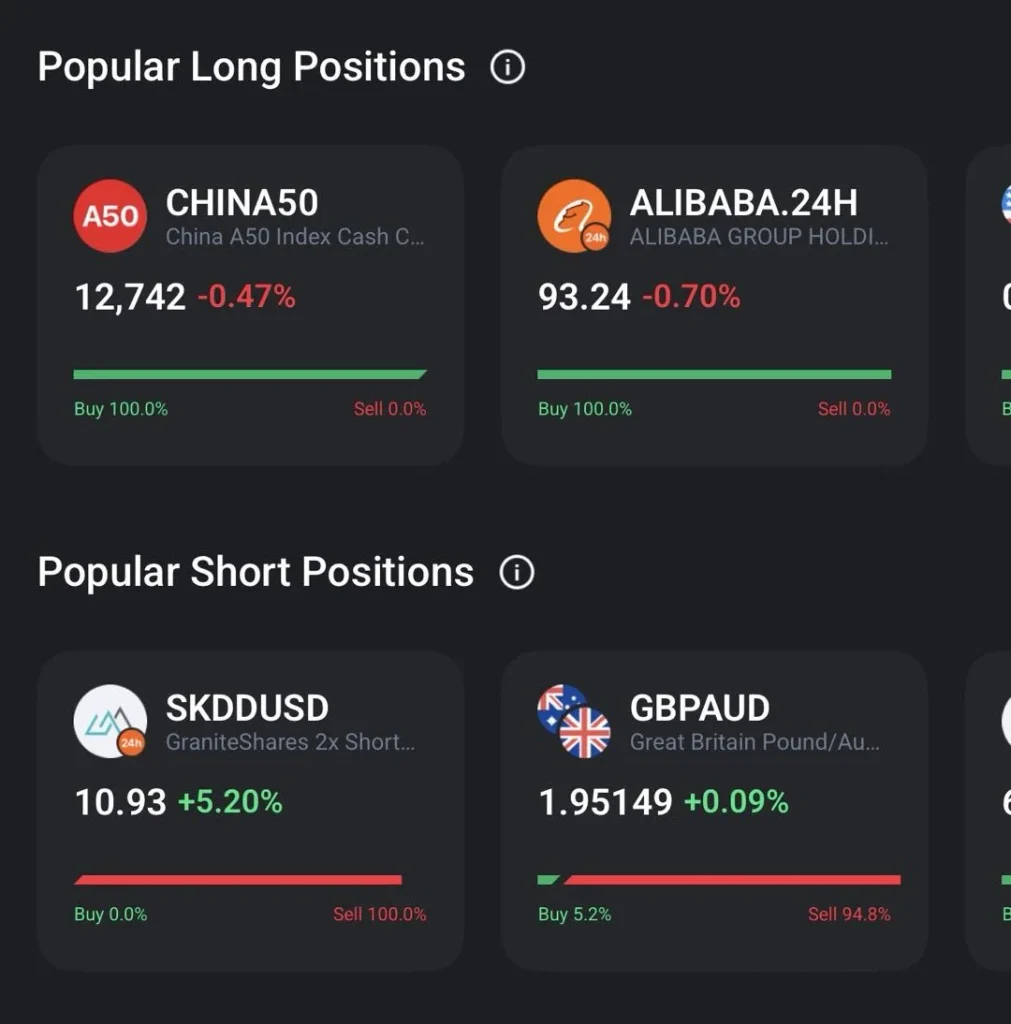
AI Market Overview also provides a snapshot of buy and sell positions across selected instruments, grouped into two categories.
Popular Long Positions
Highlights instruments with a higher proportion of buy positions. For example, Buy 100% and Sell 0% indicates that all positions represented in the displayed data are buy positions.
Popular Short Positions
Highlights instruments with a higher proportion of sell positions. For example, Buy 5.2% and Sell 94.8% indicates that sell positions account for the majority of the displayed data.
Each instrument card also displays its current price and percentage change, providing additional context on recent price performance.
Note: These figures provide insight into displayed market positioning but should not be interpreted as an indication of future price direction.
4. Technical Analysis
The Technical Analysis section provides detailed insights into individual instruments across different asset classes.
Traders can explore analysis across categories such as:
- Indices
- Forex
- Metals
- Share CFDs
- Commodities
- Cryptocurrencies
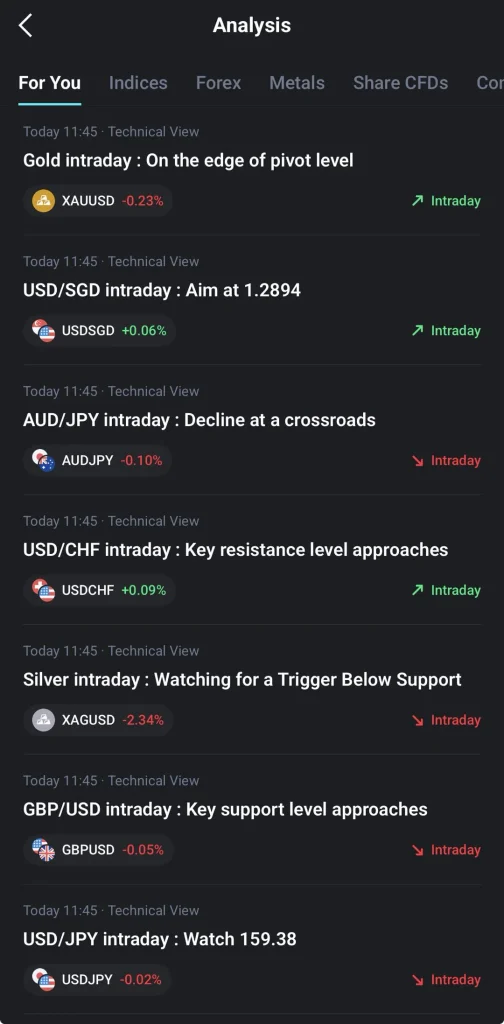
Each analysis entry includes the instrument, its latest price movement, a directional indication such as an intraday bullish or bearish outlook, and a short headline highlighting relevant market developments or technical levels, such as pivot, support or resistance levels.
Understanding an Individual Analysis Report
Selecting an analysis entry opens a detailed report, which may include a technical chart, Trading Strategy and additional commentary.
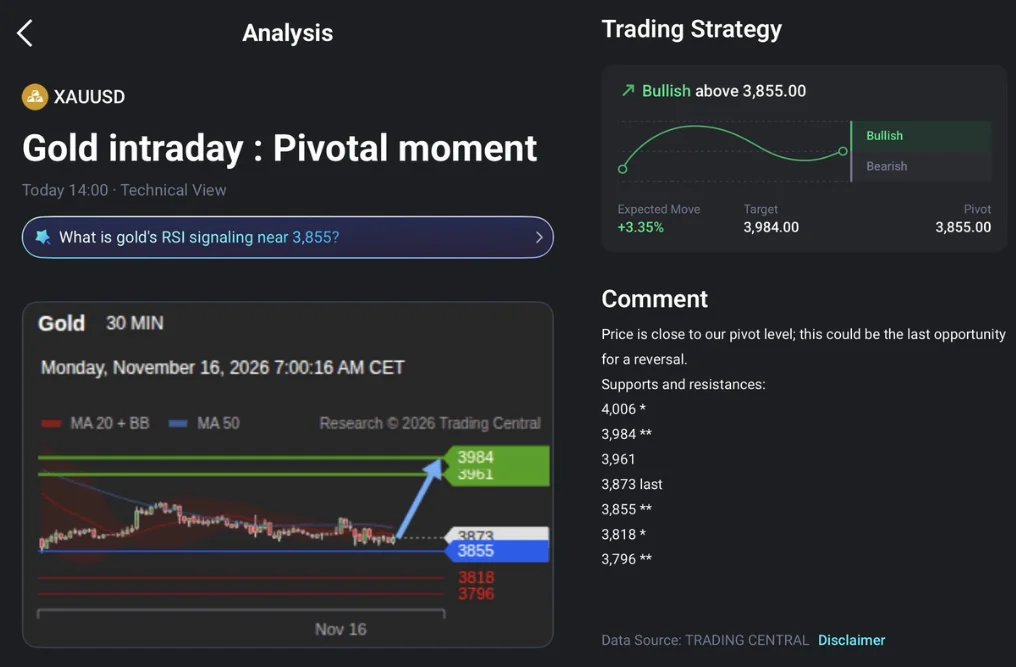
Key components include:
- Technical Chart – Displays the instrument’s price movements over a selected timeframe, alongside technical indicators and key price levels.
- Trading Strategy – Presents potential bullish and bearish scenarios based on a key pivot level. It also highlights the Expected Move and potential price target.
- Commentary – Provides further technical observations, including indicator readings, market momentum and potential support and resistance levels to monitor.
For example, the gold analysis shown presents a potential bullish outlook above the pivot level of 3,855, with an Expected Move of +3.35% and a potential target of 3,984. The accompanying commentary also identifies additional support and resistance levels to monitor.
Together, these components provide a detailed view of the instrument’s technical conditions and potential price scenarios.
5. AI Market Questions
AI Market Questions provides AI-generated explanations through suggested questions within individual analysis reports. Traders can select questions related to an instrument’s price movements, technical levels and market outlook to gain further insights.
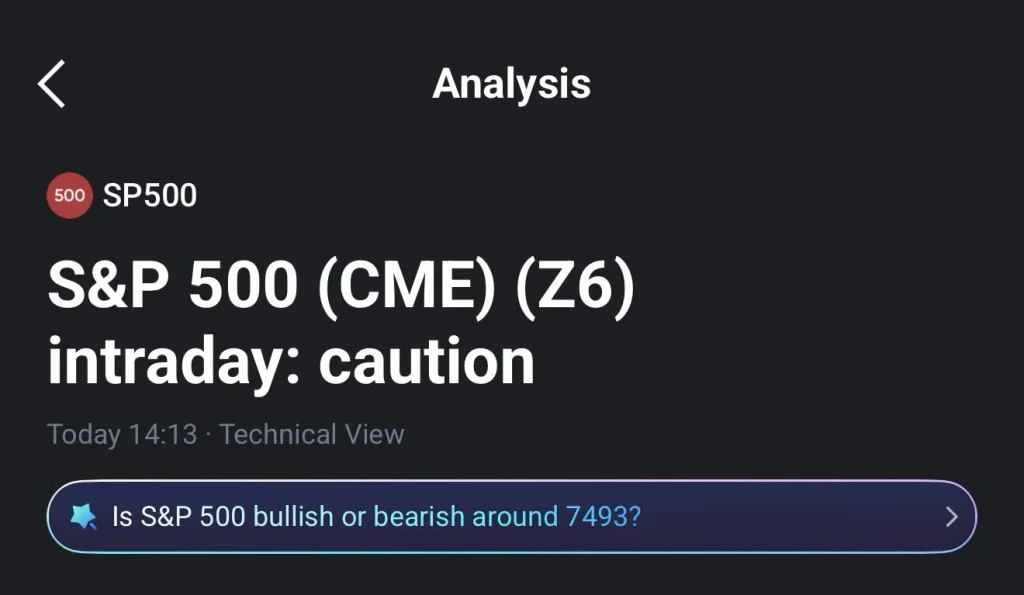
For example, an S&P 500 analysis may present the suggested question: “Is S&P 500 bullish or bearish around 7,493?”
The AI-generated response explains the current market outlook and outlines potential price scenarios based on the available analysis.
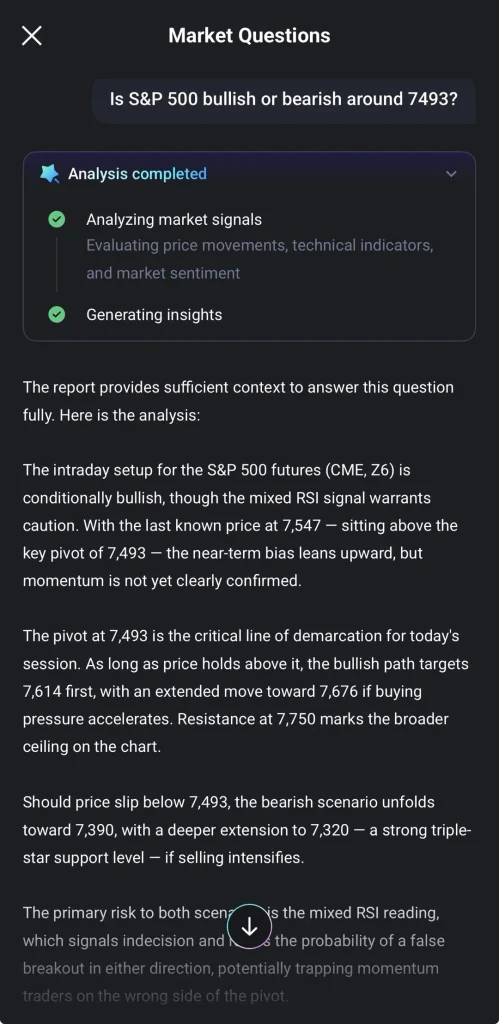
The response is organised into four areas:
- Market Outlook – Explains the current market direction and the significance of the 7,493 pivot level.
- Bullish Scenario – Shows potential upside levels if the S&P 500 stays above the pivot, including 7,614 and an extended target of 7,676.
- Bearish Scenario – Outlines potential downside levels if the index falls below the pivot, including 7,390 and 7,320.
- Key Risks – Highlights factors that could affect the outlook, such as mixed RSI signals that may indicate uncertainty in market direction.
This helps traders understand the potential market scenarios and the factors that could influence price movements.
Note: AI-generated explanations are based on available market analysis and should be treated as informational insights, not guarantees of future price movements or trading outcomes.
Things to Consider When Using AI Market Overview
While AI Market Overview can help organise market information and provide additional analytical context, traders should keep several considerations in mind.
- AI-generated insights are not guarantees: Expected Moves, price targets and directional scenarios are estimates based on available analysis. Actual market conditions may change.
- Market conditions can evolve quickly: Economic announcements, geopolitical developments and unexpected events may affect prices and invalidate existing scenarios.
- Popular positions do not predict market direction: High buying or selling participation does not necessarily mean prices will continue in the same direction.
- Conduct independent research: Consider combining AI-generated insights with your own technical and fundamental analysis, risk management and trading objectives.
AI Market Overview is designed to support market research and decision-making, rather than replace independent analysis.
Get a Clearer View of the Markets with AI
Create a live VT Markets account today and try AI Market Overview for fresh insights into market sentiment, price movements and potential trading scenarios.
Frequently Asked Questions
What is VT Markets AI Market Overview?
VT Markets AI Market Overview is an AI-powered feature within the VT Markets App that brings together market summaries, potential trading opportunities, market positioning data and technical analysis. It also provides AI-generated insights to help traders better understand market conditions and potential trading scenarios.
What information does AI Market Overview provide?
It provides insights into market sentiment and volatility, potential bullish and bearish opportunities, Expected Move estimates, popular long and short positions, and technical analysis across selected asset classes.
How does the AI Market Questions feature work?
The feature provides suggested questions related to available market analysis. Traders can click on the question to receive an AI-generated explanation of the market outlook, potential price movements and relevant technical levels.
What does Expected Move mean?
Expected Move represents the estimated percentage of potential price movement identified by the market analysis. A positive percentage indicates potential upward movement, while a negative percentage indicates potential downward movement. These estimates do not guarantee actual price movements.
What do Trading Strategy and Commentary show?
Trading Strategy presents potential bullish or bearish scenarios, including key pivot levels, Expected Move estimates and potential price targets. Commentary provides additional technical observations, such as indicator readings and support and resistance levels, to explain the market outlook.
Are AI Market Overview insights guaranteed to be accurate?
No. AI-generated insights, Expected Move estimates and trading scenarios are based on available market analysis and do not guarantee future price movements or trading outcomes. Traders should conduct their own research before making trading decisions.



