






Bitcoin’s decline below $69,000 has brought the cryptocurrency market to a critical point, leaving traders divided over whether the recent sell-off presents an opportunity to buy at lower prices or signals the beginning of a deeper correction. Having fallen more than 20% from its October highs near $87,000, Bitcoin is now facing renewed pressure as persistent US inflation and expectations of further Federal Reserve interest rate hikes weigh on market sentiment.
The latest decline has also triggered widespread liquidations, with approximately $1.47 billion in cryptocurrency positions liquidated over 24 hours on 13 November. Much of the selling accelerated after Bitcoin broke below the psychologically important $70,000 level, forcing leveraged traders out of their positions and adding momentum to the downturn.
Why Is Bitcoin Falling?
Bitcoin’s weakness largely reflects a shift in US monetary policy expectations, as stronger-than-expected inflation figures have increased the possibility of further Federal Reserve interest rate hikes.
Persistent price pressures, particularly those linked to elevated energy costs and geopolitical tensions in the Middle East, have complicated the inflation outlook. With policymakers maintaining a hawkish stance, expectations of higher borrowing costs have supported US Treasury yields and the dollar, highlighting how interest rate expectations can influence cryptocurrency markets.
Unlike interest-bearing assets such as government bonds, Bitcoin does not generate income, making it potentially less attractive when investors can earn higher returns elsewhere. Institutional demand has also weakened, with US-listed spot Bitcoin ETFs recording more than $2.5 billion in net outflows since 30 October, adding to concerns about whether the cryptocurrency can sustain a meaningful recovery.
Bitcoin Technical Analysis: Key Support and Resistance Levels
Bitcoin’s daily chart suggests that bearish momentum has strengthened following its breakdown below the 200-day simple moving average (SMA) and the neckline of a potential head-and-shoulders formation, both of which are commonly monitored in technical analysis to identify changes in market trends.
The pattern developed as Bitcoin struggled to sustain its recovery towards $87,000, with subsequent rallies failing around $81,000–$82,000. The eventual breakdown below the rising neckline near $76,000 indicates that sellers have gained greater control over the market, leaving Bitcoin vulnerable to further downside.
With prices now trading below the 200-day SMA near $73,040, attention has shifted towards the next major daily demand zone around $63,120. Should this level fail to hold, the lower support region near $58,540 could become the next area of interest.
| Price level | Technical significance |
| $76,000 | Broken neckline resistance |
| $73,040 | 200-day SMA resistance |
| $63,120 | First major demand zone |
| $58,540 | Next major demand zone |
Buying the Bitcoin Dip or Shorting the Decline
For traders considering buying the dip, the $63,120 demand zone could become an important area to monitor for renewed buying interest. However, understanding the difference between market capitulation and temporary rebounds is particularly important during sharp corrections, as lower prices do not necessarily indicate that selling pressure has ended.
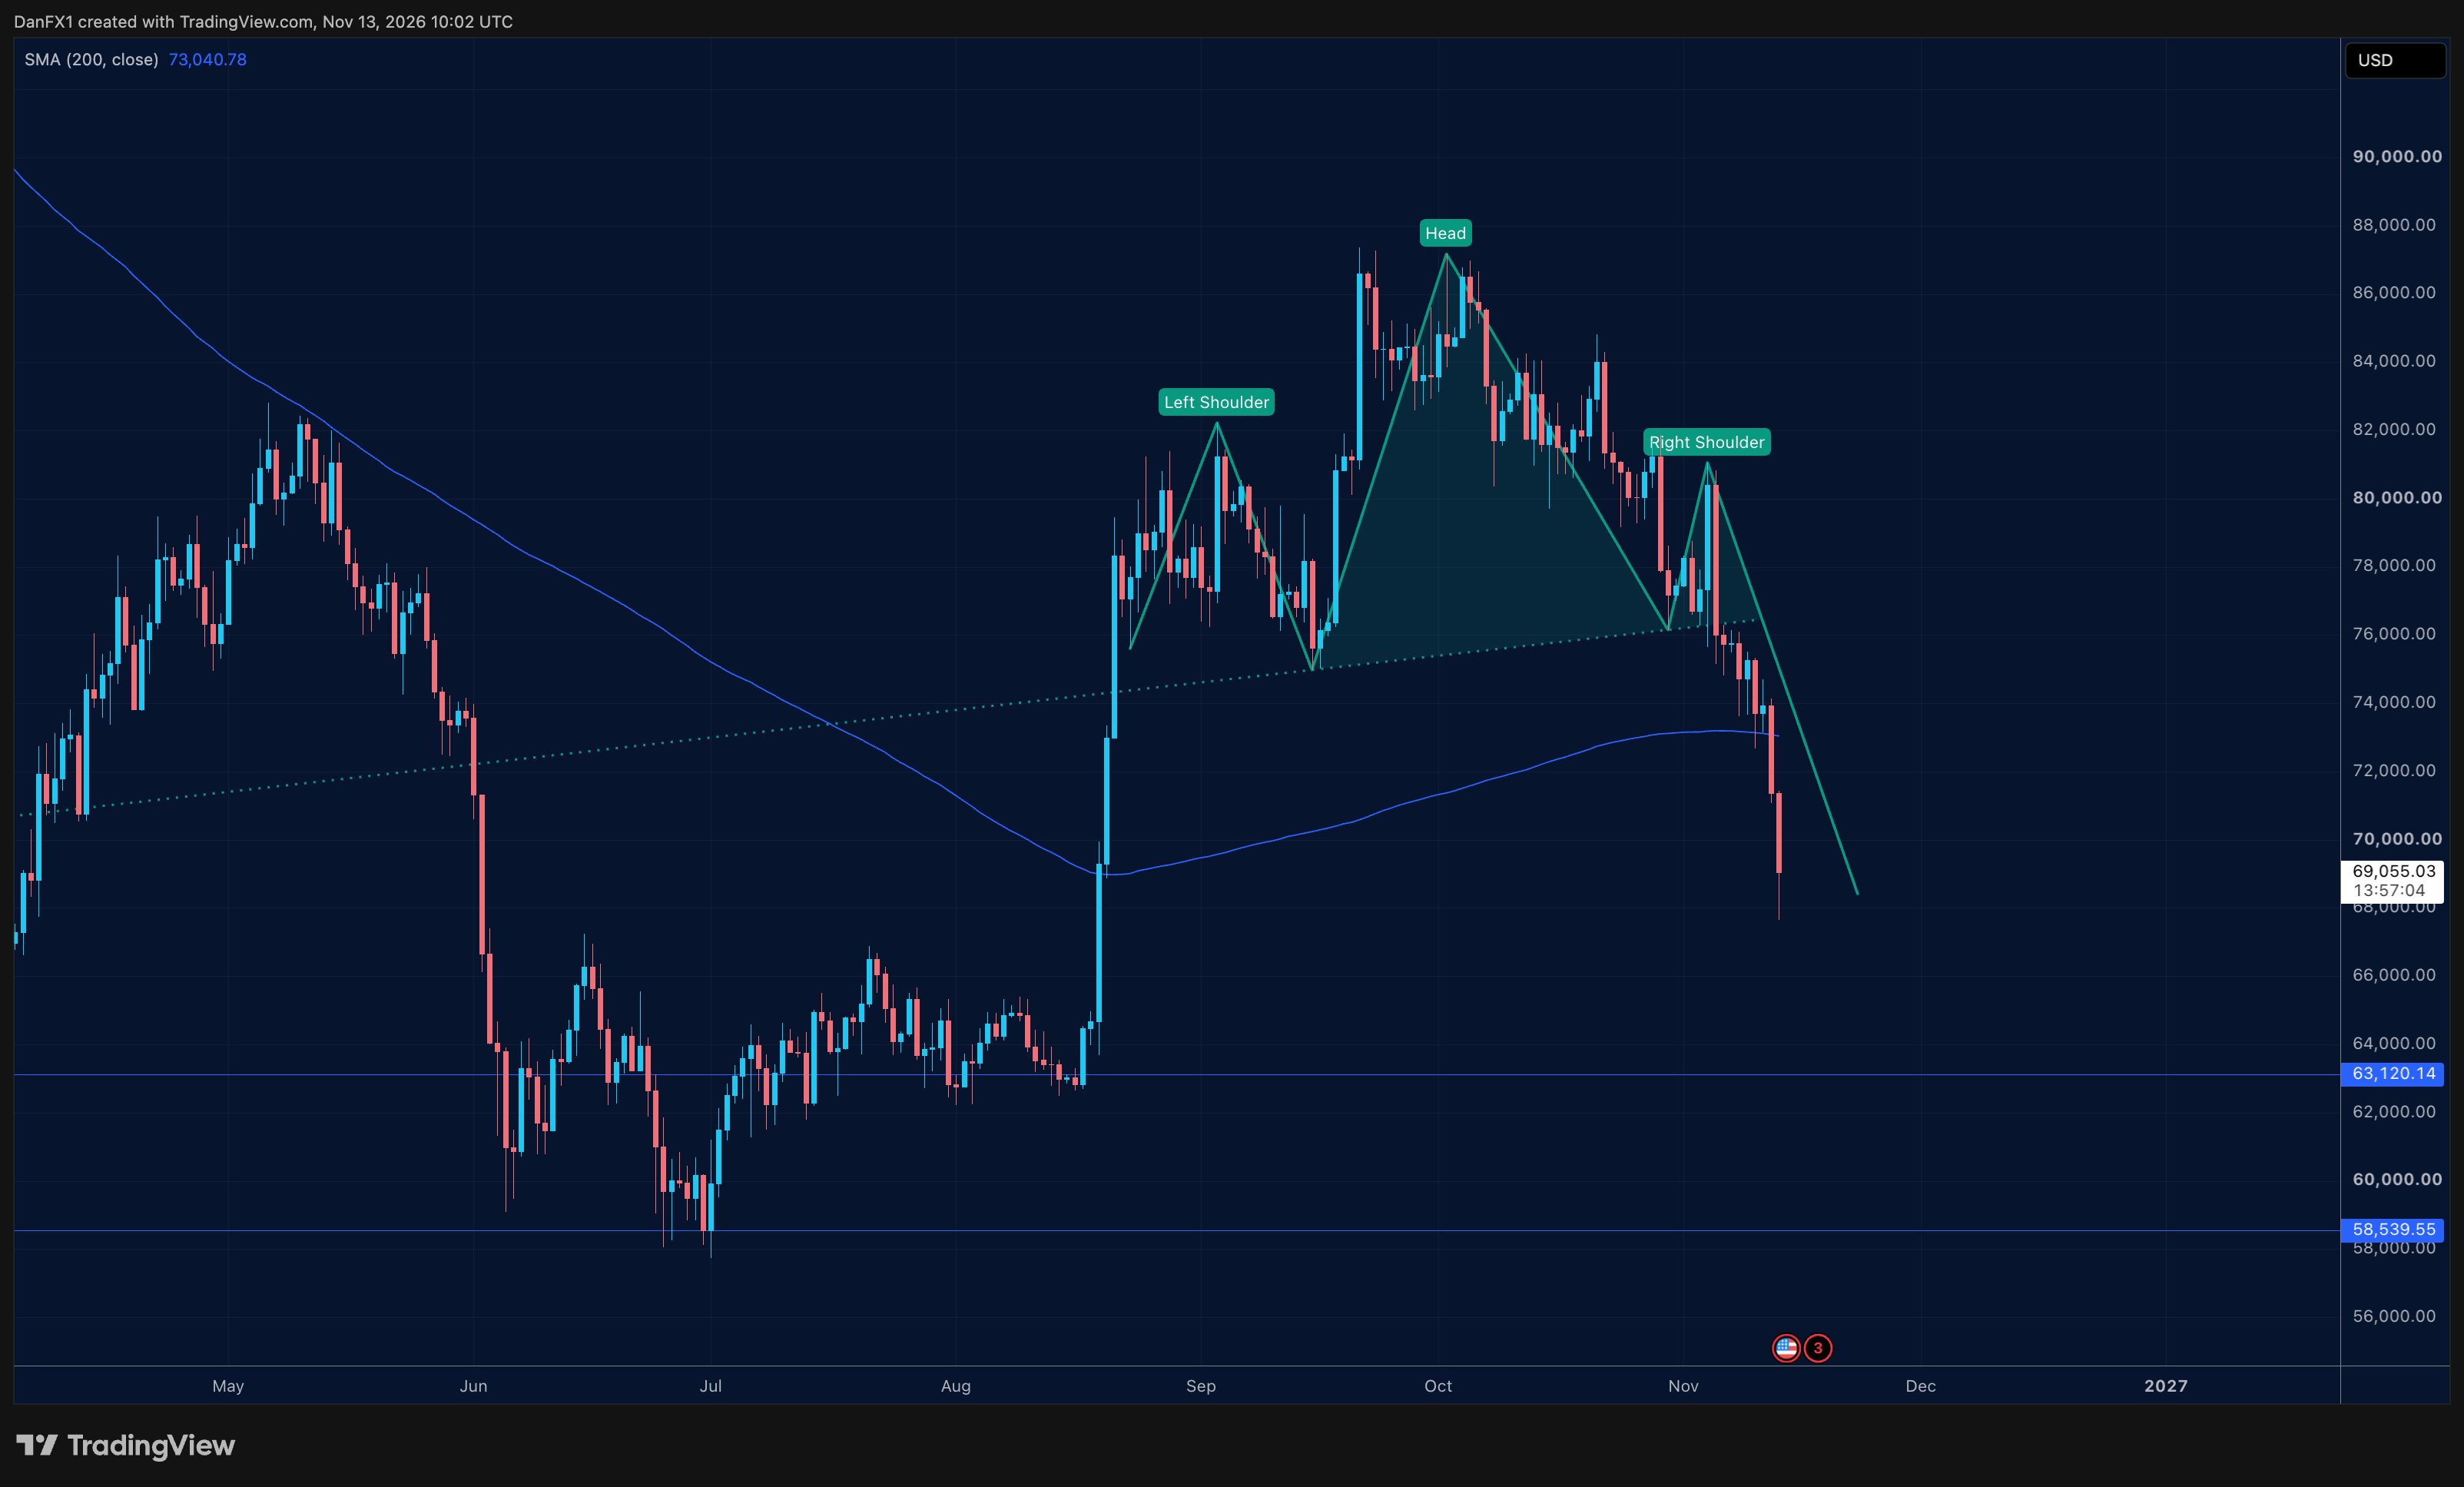
If Bitcoin manages to establish support and recover towards $73,040, a successful break above its 200-day moving average could improve the short-term outlook, potentially opening the way for a retest of the broken neckline around $76,000.
For traders anticipating further declines, these same resistance levels could provide opportunities to assess whether selling pressure remains intact. A failed recovery towards $73,040 or $76,000 would reinforce the bearish technical structure, while a decisive breakdown below $63,120 could expose the lower demand zone near $58,540.
Nevertheless, both approaches carry considerable risks, particularly during periods of heightened volatility when sharp rebounds and sudden price reversals can occur.
What’s Next for Bitcoin?
Bitcoin’s next significant move will likely depend on upcoming US economic data and the Federal Reserve’s monetary policy outlook. Further evidence of persistent inflation could strengthen expectations of additional tightening, potentially extending pressure on cryptocurrencies, while softer inflation figures may provide some relief for market sentiment.
The Federal Reserve’s 8–9 December meeting will be particularly important as traders assess policymakers’ updated interest rate projections.
For now, Bitcoin’s technical structure remains bearish, although the approaching demand zones could attract renewed buying interest. Whether the correction develops into a recovery or extends further will largely depend on Bitcoin’s ability to defend $63,120 and eventually reclaim resistance near $73,040.
Trade Bitcoin with VT Markets
Follow Bitcoin alongside technology indices, forex and other global CFD markets with VT Markets. Use charting tools and market insights to assess how economic releases affect price movements and trading conditions.
Create a live VT Markets account to access trading tools and educational resources. Review the instrument’s trading hours, contract specifications and margin requirements before opening a position.
CFDs are leveraged products and carry a high risk of loss.
Frequently Asked Questions (FAQ)
- Why is Bitcoin falling below $69,000?
Bitcoin has fallen below $69,000 as persistent US inflation, expectations of further Federal Reserve interest rate hikes and weakening institutional demand weigh on market sentiment. Higher Treasury yields and a stronger US dollar have also increased pressure on cryptocurrencies.
- Is now a good time to buy the Bitcoin dip?
Bitcoin’s decline could attract buyers seeking lower entry prices, although further downside remains possible. Traders may monitor the $63,120 demand zone for signs of stabilisation, while a recovery above $73,040 could indicate improving bullish momentum.
- How low could Bitcoin fall in 2026?
Based on the current technical structure, Bitcoin’s next major support sits around $63,120. A sustained breakdown below this level could expose the lower daily demand zone near $58,540, particularly if macroeconomic conditions remain unfavourable.
- Can traders profit when Bitcoin prices fall?
Traders can speculate on declining Bitcoin prices through instruments such as cryptocurrency CFDs, which allow short positions without owning the underlying asset. However, leveraged trading increases risk, and unexpected price rebounds can result in significant losses.
- What could trigger a Bitcoin price recovery?
A recovery could be supported by softer US inflation data, reduced expectations of Federal Reserve rate hikes and renewed institutional demand. Technically, reclaiming the 200-day moving average near $73,040 would be an important early signal of improving market momentum.
Start trading now — click here to create your real VT Markets account.



