GlobalAsiaEuropeMiddle EastLatin AmericaNorth America
Select your Language
What Is PPP? Purchasing Power Parity Explained
by VT Markets/
Sep 21, 2026
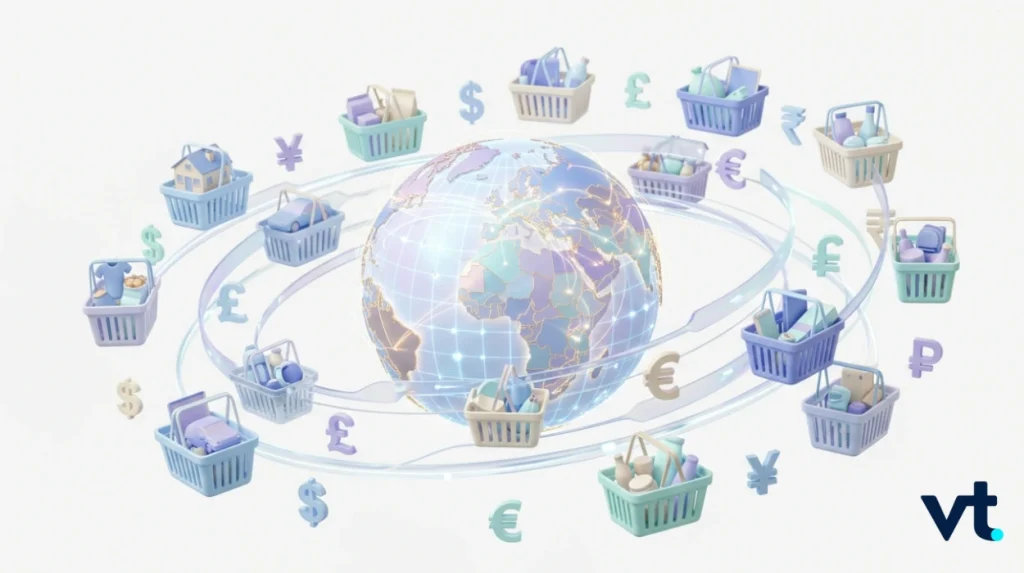
Take a $10 note. In Bangkok it buys roughly ten scoops of ice cream. In Zurich it buys two. Same note, same day, same amount of money, wildly different outcome. Purchasing power parity (PPP) is the economic idea used to measure that gap: the exchange rate at which the same basket of goods and services would cost the same amount in two different countries, showing how much your money can actually buy from one place to another.
People literally search “what is P P P”, letter by letter, which tells you how opaque the abbreviation still feels. For readers trying to make sense of economics, traders comparing currencies, researchers working with cross-country data, or anyone sizing up cost of living and living standards, this guide explains the purchasing power definition, the purchasing power parity formula, what GDP PPP actually means, the 2026 numbers that matter, how PPP differs from market exchange rates, where the calculations come from, and the limits worth noting before you lean on purchasing power parity for anything real. Once you understand PPP, it becomes much easier to compare real GDP, productivity, currency value, and living standards across countries without being misled by nominal exchange rates alone.
Key takeaways
Purchasing power parity (PPP) is an economic theory that compares price levels in different countries using one standardised basket of goods and services, converted into a common currency.
The PPP exchange rate and the market exchange rate are not the same thing, and they can diverge for years at a time.
GDP PPP restates a country’s economy in international dollars, which is why China leads world output on a PPP basis in 2026 while the United States leads on nominal GDP.
PPP calculated figures depend heavily on which basket is chosen, so treat PPP estimates as approximations rather than precise readings.
Transport costs, taxes, non-traded services and local wages all pull real prices away from parity, which is a reminder that PPP works best as a long-run compass.
What is PPP (purchasing power parity)?
Purchasing power parity is the exchange rate at which the same basket of goods and services costs the same amount in two different countries. Strip out the market noise and purchasing power parity asks one plain question: if you converted your money at today’s exchange rate, could you buy the same goods abroad?
Split the term to make it stick. Purchasing power is what your money buys inside your own country, in your own currency. Parity is the point where two things are equal. Put together, purchasing power parity (PPP) is the exchange rate that equalises actual purchasing power across borders, not the exchange rate the market happens to quote.
A worked example. A loaf of bread costs $2 in the United States and 10 yuan in China. Divide 10 by 2 and the PPP exchange rate is 5 yuan per US dollar. At that rate, one dollar buys the same loaf in both places, so the purchasing power of the two currencies is level. That is power parity purchase comparison in its simplest form, and it scales up to hundreds of items when statisticians compare one country with another.
Take note: “PPP” also stands for Public-Private Partnership and, in the US, the Paycheck Protection Program. This article covers purchasing power parity only.
Purchasing power definition in one line
Purchasing power is the quantity of goods and services a unit of currency can buy at a given moment. Inflation erodes it. A stronger national currency abroad extends it. Purchasing power parity is simply the tool that lets you compare purchasing power between one country and another on a like-for-like basis, which no raw exchange rate can do on its own.
How PPP works: baskets, price levels and a common currency
Statisticians price hundreds of everyday items in each economy, then build comparable indices. A typical basket covers:
Food, beverages and tobacco
Clothing and footwear
Rent, utilities and housing prices
Transport and fuel
Healthcare and education
Restaurants, recreation and household goods
From those surveys come price level indices. Set one economy at 100 and every other reading tells you how expensive that place is by comparison. The purchasing power parity rate is then derived by dividing the cost of the same goods in one national currency by the cost in another.
All purchasing power parity work is converted into a common currency, usually the US dollar or a synthetic unit called the international dollar, so that figures from many countries sit on one scale. That common currency step is what makes a meaningful comparison between one country and another possible at all, and it is why international trade statistics and global poverty counts both lean on it.
PPP exchange rate vs market exchange rate
The PPP exchange rate and the market exchange rate rarely match, and nobody should expect them to. One is a calculated benchmark for a whole economy, the other is a live exchange rate you can actually deal at.
Market rates are set by supply and demand on the foreign exchange market. Capital flows, interest rate differentials, speculation, policy and geopolitical risk push nominal exchange rates around by the second, and exchange rate fluctuations of 1% in a session are ordinary.
PPP exchange rates move at a completely different speed. They reflect underlying price levels and the relative cost of living, so the purchasing power parity exchange rate shifts only as inflation rates and consumption patterns evolve.
Feature
PPP exchange rate
Market exchange rate
Set by
Price surveys of goods and services
Trading on financial markets
Update frequency
Benchmark rounds, then extrapolated
Continuous
Driven by
Price level differences
Capital flows, policy, sentiment
Best used for
Long-run comparison across other countries
Actual conversion and trade execution
India makes the gap concrete. On 4 September 2026 the actual exchange rate sat near 94.4 rupees per dollar, while India’s purchasing power parity conversion factor runs in the mid-20s. Goods and services in India are far cheaper in local terms than official exchange rates imply, which is why the country’s economy looks so much larger once you switch from market pricing to PPP.
The PPP formula: absolute and relative purchasing power parity
Purchasing power parity theory comes in two versions, and they answer different questions. Both rest on price level comparisons, but only one of them tries to pin down the exchange rate itself.
Absolute purchasing power parity formula
The absolute version says an identical basket should cost the same in two countries once converted. The purchasing power parity formula:
S = P1 / P2
Where S is the PPP exchange rate, P1 is the price level in country one and P2 is the price level in country two.
A basket costs $200 in the United States and €160 in the euro area:
S = 200 / 160 = 1.25 USD per EUR
So $1.25 carries the same purchasing power as €1 in their respective domestic markets. In practice absolute PPP almost never holds exactly, because identical goods are not identically priced anywhere.
Relative PPP and the inflation gap
Relative PPP links movements in nominal exchange rates to inflation differences between two economies:
%ΔS ≈ Inflation₁ − Inflation₂
If US inflation runs at 3% and a trading partner’s runs at 7%, relative PPP predicts that partner’s currency depreciates by roughly 4% a year against the dollar. Relative PPP is the more useful of the two for long-horizon thinking, because it deals in direction rather than absolute levels. In any single year, capital flows and policy shocks can easily swamp the inflation gap and drag the exchange rate the other way.
Who calculates PPP rates?
Purchasing power parity data comes from statistical programmes, not from banks or brokers. The backbone is the International Comparison Program, launched in 1968 with the University of Pennsylvania and the United Nations, which surveys prices across participating countries to support international comparison and economic cooperation.
Body
What it covers
Cadence
World Bank (ICP)
Broadest global coverage, poverty analysis
Benchmark rounds
International Monetary Fund
Macro policy, World Economic Outlook
Twice yearly
OECD
High income countries, detailed breakdowns
Monthly and annual
Eurostat
European Union member states
Annual
St. Louis Federal Reserve Bank
Free access to PPP series via FRED
Continuous
The OECD measures price level differences monthly among member countries. The ICP 2021 round, published in May 2024, covered 176 economies and put world output at $152.4 trillion in PPP terms. That World Bank dataset now underpins most of the purchasing power parity figures quoted by international organizations and by national statistics offices. Researchers who want the raw series without a subscription usually pull them from the World Bank databank or the St. Louis Federal Reserve Bank’s FRED platform.
What is GDP PPP, and what does GDP PPP mean in practice?
“What is GDP PPP mean” and “what is GDP purchasing power parity” are two of the most common searches on this topic, and the answer is simpler than the phrasing suggests. Gross domestic product measures the total value of goods and services an economy produces. GDP PPP converts that gross domestic product using purchasing power parity (PPP) conversion factors instead of market pricing, stripping out price level differences to show real volume rather than currency strength.
Nominal GDP, measured at market rates, flatters countries with strong currencies and understates those with weak ones. A country’s GDP can appear to shrink simply because its own currency fell against the dollar. GDP PPP removes that distortion, which is why it is the preferred lens for comparing economic productivity and living standards across other countries.
GDP PPP in 2026: the world’s largest economies
Rank
Economy
GDP PPP 2026 (bn int. $)
Share of world output
1
China
44,295
19.9%
2
United States
32,384
14.5%
3
India
18,902
8.5%
4
Russia
7,525
3.4%
5
Japan
7,262
3.3%
6
Germany
6,408
2.9%
Source: IMF World Economic Outlook projections for 2026.
The trend matters as much as the ranking. On the ICP 2021 benchmark China held 18.9% of the world economy and the United States 15.5%. By 2026 those shares read 19.9% and 14.5%, while India climbed from 7.2% to 8.5%. On nominal GDP the ordering flips and the United States stays first, which is why analysts quote both. Neither figure is wrong: nominal GDP shows spending power on world markets, GDP PPP shows domestic economic productivity and volume.
PPP and cost of living across different countries
Purchasing power parity is how you compare purchasing power for the average person rather than for balance sheets. Price level indices assign each economy a number against a base, and the spread across other countries is enormous.
Eurostat’s June 2026 release put 2025 household consumption price levels in the European Union between 63% and 140% of the EU average:
Denmark 140, Ireland 136, Luxembourg 132
Bulgaria 63, Romania 65, Poland 73
That means the same shopping trip costs more than twice as much in Copenhagen as in Sofia. Salary converters use exactly this logic. Earn $80,000 where the index is 100 and move somewhere the index is 50, and roughly $40,000 buys a comparable standard of living.
A precaution worth taking: PPP works on national averages that blend urban and rural, luxury and basic. Your personal costs depend on your neighbourhood, your housing choice and how much of your budget goes on imported goods rather than local services. Two households in one country can face very different real prices. Treat converter outputs as a starting point, not a settlement figure.
PPP, poverty and developing countries
Purchasing power parity is the machinery behind global poverty counting. Without it there is no way to compare deprivation across different countries currencies, because a poverty line set in one country’s money means nothing in another’s.
In June 2025 the World Bank moved its international poverty line to $3.00 a day in 2021 PPP terms, up from $2.15 in 2017 PPP. The lower-middle-income line moved to $4.20 and the upper-middle-income line to $8.30. The revision was not cosmetic: the estimated number of people in extreme poverty in 2022 rose from 713 million to 838 million, an upward revision of about 125 million, driven largely by new price data and Indian household surveys.
That revision shows how much rests on PPP methodology. Critics also note that PPP baskets can over-represent urban and discretionary items, so they may misstate the relative cost of necessities for the poorest households in developing countries and other countries with large informal sectors.
Using PPP for currency valuation
Analysts use purchasing power parity (PPP) as a rough anchor for whether different currencies look cheap or expensive against long-run fair value. The comparison is always between the PPP exchange rate and the prevailing exchange rate, and the price level ratio is the usual shorthand for it.
If a currency trades 30% below its PPP rate it looks cheap. If it trades 20% above, it looks expensive. Undervalued currencies can nonetheless stay undervalued for a decade when capital controls, risk premiums or weak investment flows keep money away, and different currencies respond to the same gap in very different ways.
A reminder for traders: PPP is a valuation reference, not a trade signal. Positioning around major currency pairs on a PPP gap alone ignores carry, policy and liquidity. Most desks pair it with scheduled catalysts from an economic calendar and releases such as non-farm payrolls before acting.
Why real prices depart from PPP
Several frictions stop parity from holding, even over long horizons.
Transport costs, tariffs and transaction costs
Imported goods rarely arrive at the same price, and even internationally traded goods with deep supply chains carry local mark-ups. Transportation costs cover fuel, shipping, insurance and handling. Tariffs and quotas add a further layer, and indirect taxes add more again: VAT across the European Union frequently exceeds 20%, while other economies levy far less. Transport costs and transaction costs together explain a large share of the gap between identical goods in different places.
Non-tradable goods, services and market power
Many prices simply cannot cross a border. Rent, haircuts, restaurant meals, local transport, childcare and domestic services are priced by local supply and demand.
The Balassa-Samuelson effect covers the rest. In poorer countries, lower wages hold non-traded service prices down permanently. A plumber in Nairobi and a plumber in Oslo do similar work for wages that differ by a factor of ten, because local input costs differ. Richer countries therefore carry structurally higher service prices while poorer countries carry lower ones, which is a real feature of the world rather than a measurement error. Add brand pricing power and pricing-to-market strategies, and deviations persist even where transport costs are trivial.
The Big Mac Index in 2026
The Economist’s Big Mac Index, launched in 1986, is the most quoted shortcut in international economics, and for most people it is the first encounter with purchasing power parity (PPP). It compares one burger across many countries to flag over- and undervaluation.
Market
Big Mac price (July 2026)
Implied signal
Switzerland
US$9.04 (CHF 7.30)
Most expensive globally
United States
US$6.22
Benchmark
Indonesia
US$2.38
Most affordable globally
The Swiss burger costs 45% more than the American one. Strip out non-tradable components such as local labour, rent and tariffs and that premium falls to roughly 16%, a neat illustration of why one product cannot stand in for a full national basket. Burgernomics is a teaching tool, not a measurement standard.
A short history of purchasing power parity theory
Swedish economist Gustav Cassel formalised purchasing power parity after the First World War, arguing that the exchange rate between two currencies should gravitate towards the ratio of their national price levels. John Maynard Keynes and others then argued over how PPP should guide fixed exchange rates under Bretton Woods. The International Comparison Program turned the theory into measurable data from 1968, and by the 2000s PPP sat inside nearly every major economic database.
Explain purchasing power like I am five
You have $10.
In Thailand it buys ten scoops of ice cream.
In the United States it buys three.
In Switzerland it buys two.
PPP checks how big your basket is in each place instead of just changing the name on the money. If the same amount buys more, that country is cheaper and your purchasing power is higher there.
Frequently asked questions
Is the PPP rate the same as the rate my bank gives me?
No. Your bank quotes a market exchange rate driven by live supply and demand on financial markets. The purchasing power parity rate is a calculated figure based on price levels, and it moves slowly. Gaps between the two routinely last for years because of capital controls, risk premiums and investor sentiment.
What does parity power mean when comparing salaries?
It means adjusting income for local prices rather than converting at market rates. Convert both salaries into international dollars, then compare. A $500 monthly salary in one country can support living standards similar to $1,500 in a high income economy. Personal factors such as schooling, healthcare and housing can move your real outcome well away from the national average, so treat it as guidance on economic well being rather than a precise answer.
How often are PPP figures updated, and can they be wrong?
Benchmark rounds run roughly every four to six years, with interim years estimated from inflation data. Figures are revised when new rounds land: the 2021 cycle revised earlier 2017 results under improved methodology. Coverage is thinner where data is scarce or informal trade dominates, so PPP should always be read as an approximation.
Which PPP source should I use?
All the main purchasing power parity (PPP) sources draw on the same ICP foundation but differ in coverage years and extrapolation method. Use World Development Indicators for broad global work, IMF data for macro and policy analysis, and OECD or Eurostat series for granular comparisons among advanced economies.
Start online CFD trading with VT Markets today
If you are ready to put your understanding of purchasing power parity and exchange rate behaviour to work in live markets, VT Markets provides access to tools and platforms to help you get started.
Trade on MetaTrader 4 (MT4) and MetaTrader 5 (MT5), built for speed and advanced charting, which matters when inflation prints and policy decisions move the US dollar and its crosses.
New to trading? Practise with a VT Markets demo account before committing capital, then open your live account with VT Markets for transparent, competitive CFD trading across the world’s most popular markets.
Trading CFDs carries risk. Please take note of your own circumstances and objectives before trading.
In this Article
❯
Key takeaways
❯
What is PPP (purchasing power parity)?
❯
How PPP works: baskets, price levels and a common currency
❯
PPP exchange rate vs market exchange rate
❯
The PPP formula: absolute and relative purchasing power parity
❯
Who calculates PPP rates?
❯
What is GDP PPP, and what does GDP PPP mean in practice?
Our Telegram app is currently under maintenance, we apologize for the inconvenience. For immediate assistance, please contact us via our website live support or by email at [email protected].