US stocks declined for the first time in four days as investors assessed the outlook for the path of interest-rate hikes after a minute of Federal Reserve’s last meeting noted officials saw risks from tightening more than necessary. Moreover, the stock market rallied on signs of peaking inflation and an earnings reporting season that saw four out of five companies meeting or beating estimates. However, prospects of the Fed continuing to raise rates to cool inflation and tip the economy into recession have weighed on market sentiments.
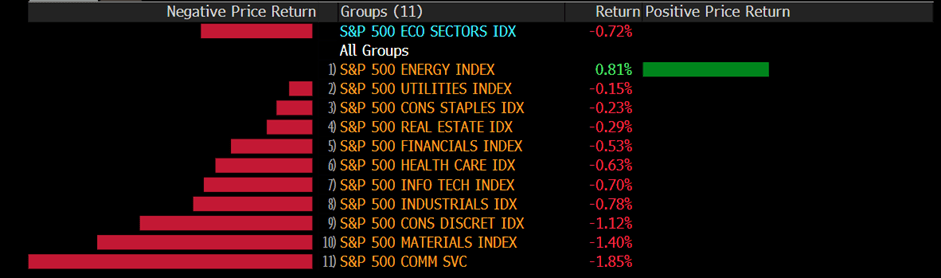
The benchmarks, both S&P 500 and Dow Jones Industrial Average slid on Wednesday, as Fed minutes note it may be appropriate to slow increases. Ten out of eleven sectors of S&P 500 stayed in the negative territory, as Communication Service and Material sectors performed worst among all groups, falling 1.40% and 1.85% on daily basis respectively. Energy is the only section in positive territory, rose with a 0.81% gain for the day. The Dow Jones Industrial Average decreased 0.5%, the Nasdaq 100 dropped 1.2%, and the MSCI World index fell 0.6% on Wednesday.
Main Pairs Movement
The US dollar little advanced on Wednesday, as the minutes from Federal Reserve’s July meeting, showed that Fed officials are concerned the US central bank could raise interest rates too far as part of its commitment to get inflation under control. The DXY index witnessed fresh transactions during the UK trading session and touched a daily high level of nearly 106.9 level, however, paring most gains and reached a daily low level below 106.4 after the FOMC minute.
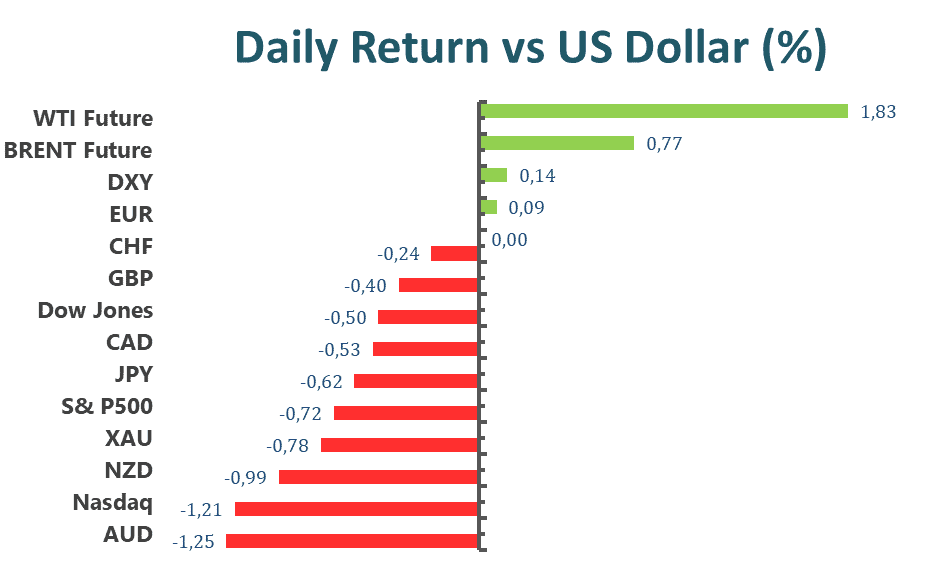
The GBP/USD dropped with a 0.40% loss on daily basis after a volatile day, as UK’s 40-year high inflation propelled recession woes and the minute of the Federal Reserve. The cables were under heavy selling pressure during the UK trading session amid a pessimistic market mood towards economic growth. However, GBP/USD rebounded after the Fed minute and oscillate around the 1.2045 level. Meanwhile, EUR/USD touched a daily-high level above 1.020 after the minute by Fed. The pair rose 0.09% for the day.
Gold dropped on Wednesday, and remains under pressure around a two-week low, down for the fourth consecutive day. XAU/USD edged lower since the UK trading session as a strong greenback across the board and touched a daily low below $1,760 in the middle of the US trading session.
WTI and Brent oil advanced for the day, rising 1.83% and 0.77% respectively.
Technical Analysis
EURUSD (4-Hour Chart)
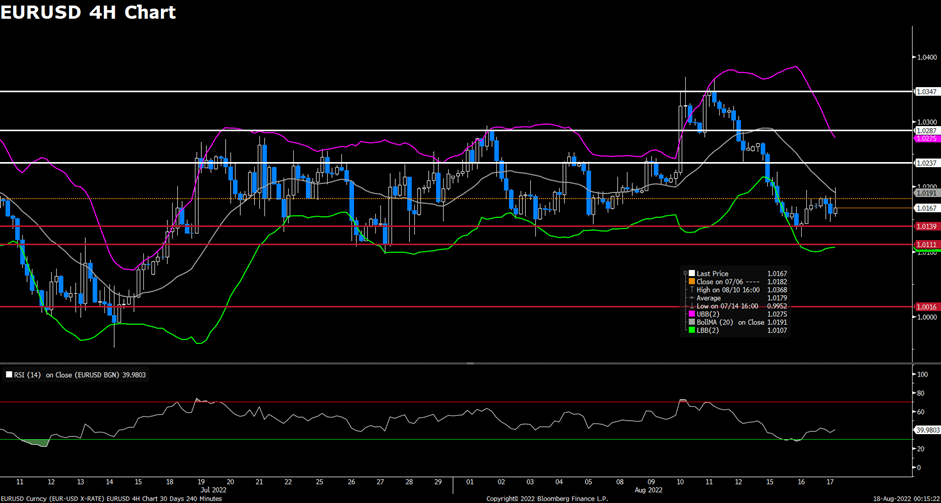
The EUR/USD pair edged lower on Wednesday, remaining under pressure and surrendered most of its daily gains after touching a daily high above the 1.019 mark amid a soured market mood. The pair is now trading at 1.0164, posting a 0.08% loss daily. EUR/USD stays in the negative territory amid renewed US dollar strength, as global stocks turned sharply lower ahead of the release of the latest FOMC Meeting Minutes and lend support to the safe-haven greenback. The US Retail Sales stay unchanged in July and came in slightly weaker than the market expectation of +0.1%, which failed to provide impetus to the markets as the focus now shifts to FOMC minutes. For the Euro, the Eurozone GDP expanded by 0.6% QoQ in the second quarter of this year, but the markets react little to the economic data.
For the technical aspect, the RSI indicator is 39 as of writing, suggesting that the downside is more favoured as the RSI stays below the mid-line. As for the Bollinger Bands, the price retreated and failed to cross above the moving average, therefore some downside traction can be expected. In conclusion, we think the market will be bearish as the pair might head to test the 1.0139 support. The risk is also skewed to the downside as the pair is developing below all of its moving averages.
Resistance: 1.0237, 1.0287, 1.0347
Support: 1.0139, 1.0111, 1.0016
GBPUSD (4-Hour Chart)
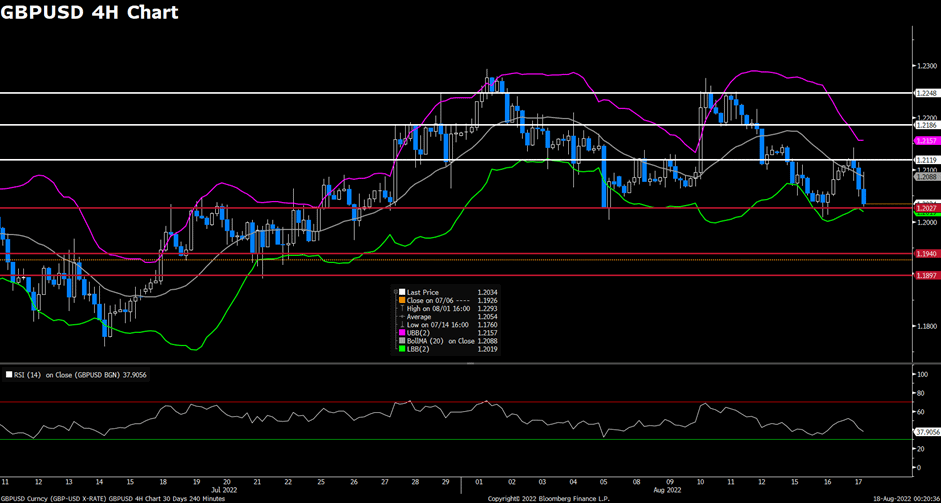
The GBP/USD pair declined on Wednesday, failing to preserve its upside traction that was witnessed earlier in the Asia session and refreshed its daily low below 1.205 level ahead of FOMC meeting minutes. At the time of writing, the cable stays in negative territory with a 0.53% loss for the day. The speculations that the Fed would stick to its policy tightening path have been fueled by the recent hawkish remarks by several Fed officials. On top of that, the rising US Treasury bond yields also helped the US dollar to find demand and undermined the GBP/USD pair. For the British pound, the UK Consumer Prices Index (CPI) rose to 10.1% YoY in July, which came in hotter-than-expected but failed to provide strong support to the cable as the US economic data have lifted bets for a larger Fed rate hike move at the September meeting.
For the technical aspect, the RSI indicator is 37 as of writing, suggesting the pair’s bearish outlook in the near term as the RSI keeps heading south. As for the Bollinger Bands, the price witnessed fresh selling and dropped toward the lower band, therefore a continuation of the downside trend can be expected. In conclusion, we think the market will be bearish as the pair is testing the 1.2027 support. A break below that level could open the door for additional losses and the falling RSI also reflects bear signals.
Resistance: 1.2119, 1.2186, 1.2248
Support: 1.2027, 1.1940, 1.1897
XAUUSD (4-Hour Chart)

Gold slumps below $1,770 on Wednesday, dropping to its two weeks low. Rising yields and a stronger US dollar are weighing on the gold price. The benchmark 10-year US Treasury bond yield is up nearly 3% on the trade of the day, forcing XAU/USD to come under more bearish pressure.
For the technical aspect, XAU/USD drifts in negative for the third successive day forming a clear downward trend and slumps below the $1,770 level in the European session. The price continued to drop in the early US session. At the time of writing, the price is $1,760 level testing the support level at $1,757. The RSI indicator is 33 as of writing, suggesting that the price is still under downside pressure. For the Bollinger Bands, the price tumbled but still maintained slightly above the lower bound, indicating that the price is not yet dropped below oversell zone. In conclusion, we think the market is still in bearish mode as the RSI indicator keeps in a downtrend and the price keeps edging low.
Markets are now pricing in at least a 50 bps rate hike at the September FOMC meeting. As such, clues about the possibility of a larger 75 bps move will play a key role in influencing the recent USD price and determining the next move for gold. For more price action, eye on the tier 1 US economic data.
Resistance: 1783, 1803, 1857
Support: 1757, 1714, 1685
Economic Data
| Currency | Data | Time (GMT + 8) | Forecast |
| AUD | Employment Change (Jul) | 09:30 | 25.0k |
| EUR | CPI (YoY) (Jul) | 17:00 | 8.9% |
| USD | Initial Jobless Claims | 20:30 | 265k |
| USD | Philadelphia Fed Manufacturing Index (Aug) | 20:30 | -5.0 |
| USD | Existing Home Sales (Jul) | 22:00 | 4.89M |

This site uses cookies to provide you with a great user experience.
By using vtmarkets.com, you accept our
cookie policy.

اختر نوع الحساب وأرسل طلبك


موّل حسابك باستخدام مجموعة واسعة من طرق الإيداع

الوصول الى أكثر من 1000 أداة عبر جميع فئات الأصول.


![]()
Follow us on:


![]()


