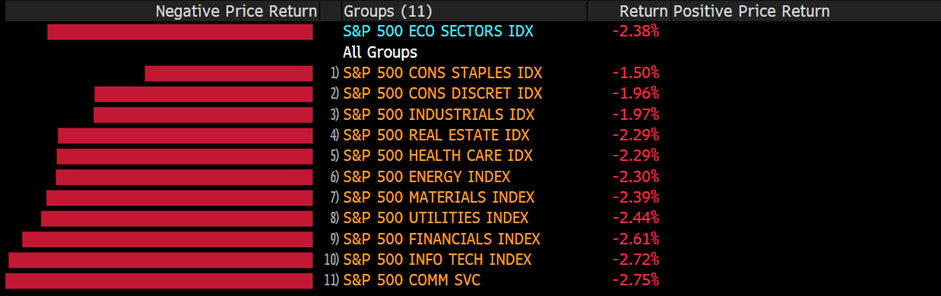
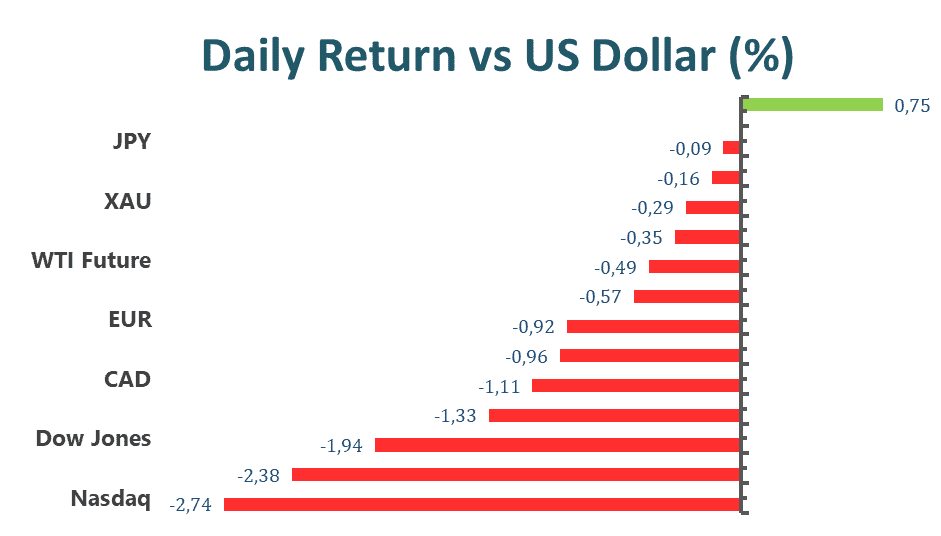
US stocks market fell sharply ahead of a key inflation report as investors worried about the overall US economy. The Dow Jones Industrial Average slid 1.94% while the S&P 500 fell 2.38%. And the Nasdaq Composite shed 2.75%, finishing with 11,754.23. Major technology companies struggled on Thursday as investors were concerned if the CPI figure still holds high, then the Fed has more reasons to be more aggressive on the rates. Meta Platform slid 6.4% and Amazon dropped more than 4% while Apple fell 3.6%.
Following the ECB meeting on Thursday, major European indices closed down lower as the ECB announced that it intends to increase the rates by 25 basis points at its meeting in July, and it expects to raise another one in September. In the meantime, the ECB downgraded its economic growth forecasts and upgraded and revised its inflationary projections.
Alibaba shares slid more than 8% on Thursday after its financial affiliate Ant Group mentioned it at the moment has no plan to IPO. However, according to Bloomberg, Chinese financial regulators have claimed that they have commenced early-stage discussions about reviving the IPO, meaning that the Chinese government has potentially given the green light for a listing.
Main Pairs Movement
USD/JPY climbed to a new 20- year high, heading toward 135.00. The Japanese Yen continued to depreciate against the greenback as the Bank of Japan defies global trends and keeps its monetary policy loose.
Gold was down 0.29% as the market mood turned firmly on the ECB monetary policy decision. Despite the ECB keeping its rates unchanged as expected, gold turned downside following the news that the hike will possibly happen in July and September.
EUR/USD was once hitting 1.07737 but wrapped up with nearly 1% lower, 1.06147. After the ECB meeting, the 25 basis point increments in July seemed to shift the ECB’s stance from a hawkish decision to a dovish one, thus dragging the euro dollar down against the greenback.
Technical Analysis
EURUSD (4-Hour Chart)
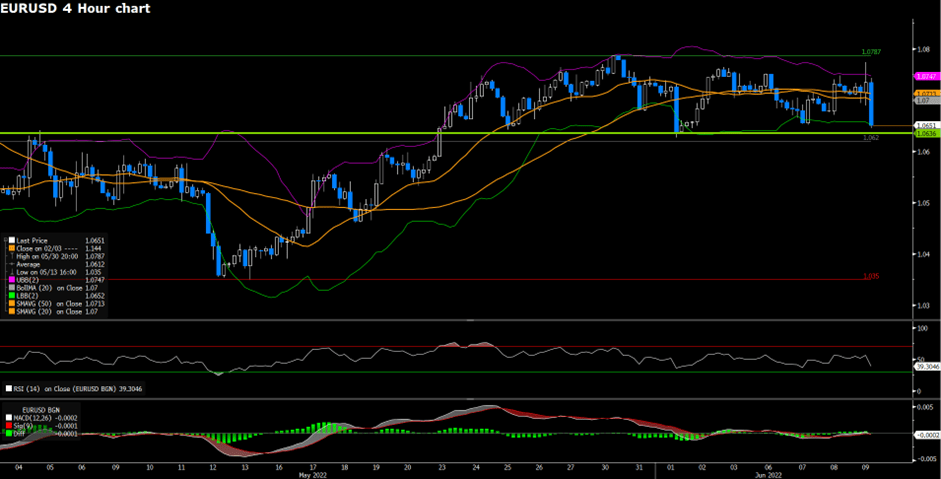
EURUSD experienced strong volatility as the ECB announced its monetary plans for the rest of the year. Thursday’s ECB conference saw a shift towards a hawkish ECB, the council has announced that it intends to raise its key interest rates by 25 basis points at the July meeting; furthermore, the central bank sees further interest rate increases in order to keep pace with its 2% medium-term target. The Eurozone has experienced soaring inflation as multiple constituents turned in a higher than 8% CPI increase for the month of May. During their press conference, the ECB also projected a slower growth of the economy as supply chain issues and geopolitical concerns still loom large across the European region.
The Euro soared at the initial announcement of an interest rate hike, but the Euro soon lost steam and entered a sharp spiral as the ECB announced gloomy forward guidance. RSI for the pair is indicating 48.07, as of writing. On the four hour chart, EURUSD is trading below its 50, 100, and 200 days SMA.
Resistance: 1.07691
Support: 1.06477
GBPUSD (4-Hour Chart)
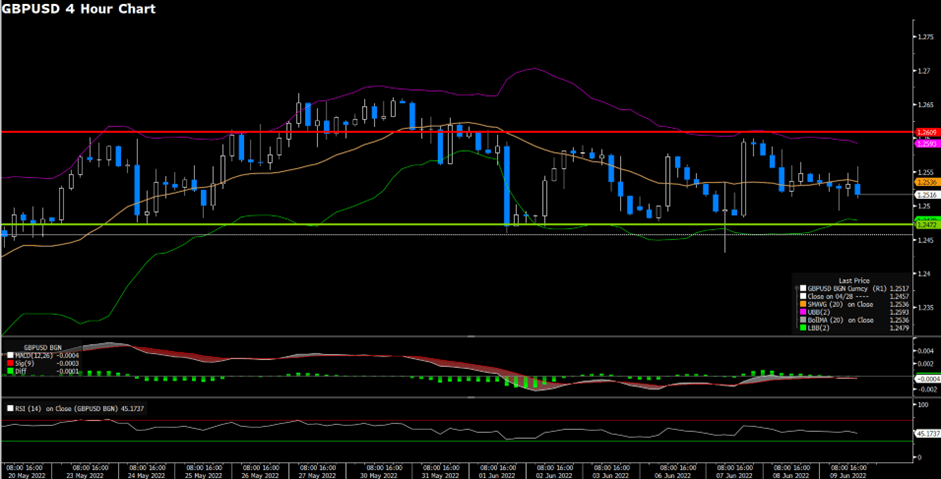
The British Pound traded lower against the U.S. Dollar over the course of Thursday’s trading. The strong Dollar was assisted by the soaring short term treasury yield, which has once again traded past the key 3% level. Market participants continue to price in further interest rate hikes by the Fed as they await the key May CPI data, which will be released during the American trading session tomorrow. On the other hand, the U.K. Gilt broke above 2.3%, but the BoE could be stuck between a rock and a hard place as the British economy has slowed significantly since the previous rate hike.
On the technical side, Cable has been consolidating around the 1.25 price region for the past two weeks. The narrowing credit spread has delivered a relatively calm environment for Cable. Near term resistance at the 1.259 price region remains strong. RSI for Cable sits at 47.44, as of writing. On the four hour chart, Cable is trading below its 50, 100 and 200 day SMA.
Resistance: 1.25691, 1.26539
Support: 1.24539
USDJPY (4-Hour Chart)
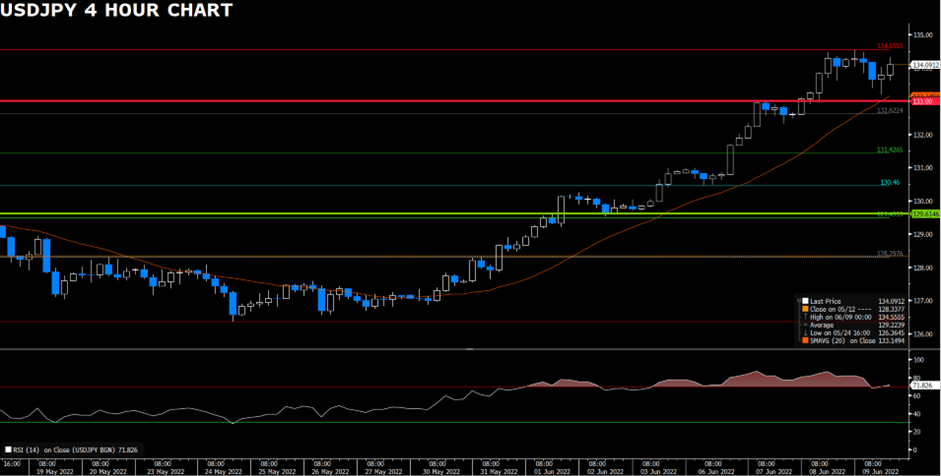
USDJPY traded mostly sideways around the 134 price region for Thursday. Despite the rising U.S. 10 year treasury yield, Yen bulls have found their footing and defended the Yen from slipping further. However, as interest rates between the two countries continue to widen as the year progresses, USDJPY could rise further still. Market participants will focus on the U.S. May CPI data set to be released during the American trading session today.
On the technical side, USDJPY continues to trade higher into the historical territory. Near term, resistance exists around the 134.56 price region, while support levels could be found along the 132.5 price region and the 133.5 price region. RSI for the pair sits at 71.98, slightly above overbought territory. On the four hour chart, USDJPY is trading above its 50, 100, and 200 days SMA.
Resistance: 134.56
Support: 133.5, 132.5
Economic Data
| Currency | Data | Time (GMT + 8) | Forecast |
| RUB | Interest Rate Decision (Jun) | 18:30 | 10% |
| USD | Core CPI (May) | 20:30 | 0.5% |
| CAD | Employment Change (May) | 20:30 | 30K |
| EUR | ECB President Lagarde Speaks | 21:45 | – |

This site uses cookies to provide you with a great user experience.
By using vtmarkets.com, you accept our
cookie policy.

اختر نوع الحساب وأرسل طلبك


موّل حسابك باستخدام مجموعة واسعة من طرق الإيداع

الوصول الى أكثر من 1000 أداة عبر جميع فئات الأصول.


![]()
Follow us on:


![]()


