Market Focus
Wall Street’s three major stock indexes closed higher on Tuesday, with the S&P 500 and the tech-heavy Nasdaq recovering early losses and rising late in the session, with Amazon up 2.2% and Apple and Microsoft both up more than 1%. Also, as the 10-year U.S. Treasury yield hit its highest level since November 2019, the S&P 500 banks index rose 1.9%. At the end of the market, the Dow Jones Industrial Average rose 1.06% to 35,462.78 points, the S&P 500 index gained 0.84% to 4,521.52 and the Nasdaq Composite Index added 1.28% to 14,194.46 points
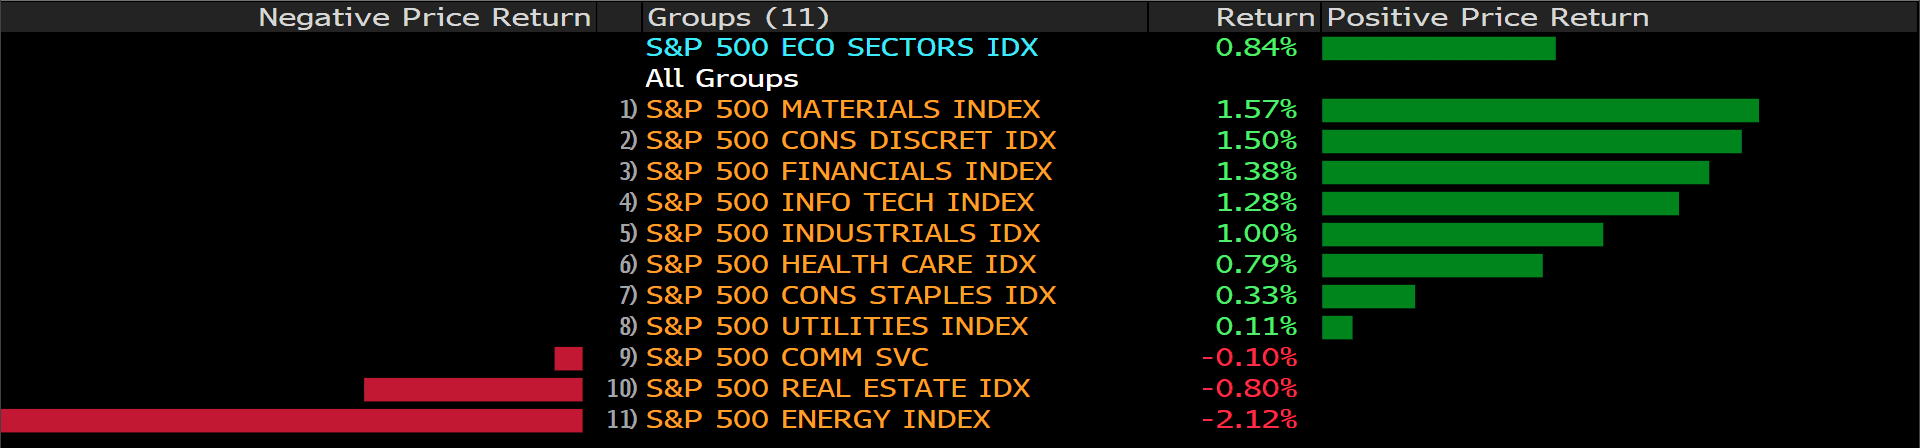
Of the 11 sectors of the S&P 500, 3 ended lower, with the energy sector falling the most, down 2.12%. The biggest winner was materials sector, up 1.57%, followed by the consumer discretionary sector, which rose 1.50%. The energy sector fell as investors worried that a resumption of indirect talks between the United States and Iran could revive an international nuclear deal and allow OPEC producers to boost oil exports. On the other hand, earnings were mixed on Tuesday, with Pfizer falling after the drugmaker’s full-year sales forecast for its COVID-19 vaccine and antiviral pill fell short of expectations. Amgen surged nearly 8% after the company announced up to $6 billion in buybacks and forecast earnings to double by 2030. Meta fell 2.1% after billionaire investor Peter Thiel decided to step down from the company’s board, sending the stock down for a fourth straight day after last week’s bleak forecast wiped out billions in market value.

Main Pairs Movement:
The major currency pairs continued to lack direction, staying within a consolidation range on Tuesday. The dollar finally found some support amid a surge in government bond yields, with the U.S. 10-year yield hitting 1.97%. However, the strength in yields was not enough to make up for the dollar’s decline over the past week.
Sterling and the euro edged lower as the dollar strengthened, with sterling flat against the dollar, up 0.02% in late trade, while the euro edged down 0.24% against the dollar. The main pressure on the euro came from comments from ECB member François Villeroy, who said that markets may have overreacted to President Christine Lagarde’s remarks.
USD/CAD edged higher and is hovering around 1.2700 as lower oil prices dampen demand for the Canadian dollar.
Gold soared to a fresh two-week high of $1,828.36 an ounce and settled near $1,825. Meanwhile, oil prices faced a two-day losing streak, with WTI closing at $89.75 a barrel and Brent at $91.16 a barrel.
Technical Analysis:

The EUR/USD pair declined on Tuesday, continuing to edge lower amid ECB President Christine Lagarde’s dovish comment. The pair saw heavy selling at the start of the day and touched a daily low below 1.140 mark in early European session, now ebounding slightly to eliminate some of its intraday losses. The pair was last seen trading at 1.1405, posting a 0.33% loss on a daily basis. EUR/USD stays in the negative territory amid stronger US dollar across the board, as the benchmark 10-year US Treasury bond yield rose toward 2%, helping the greenback outperform its major rivals. Meanwhile the expectations for a Fed tightening might keep weighing on EUR/USD. In Europe, ECB’s Lagarde said that inflation is expected to remain stable and there is no need for major policy tightening, pulling ECB out of the previous hawkish stance.
For technical aspect, RSI indicator 54 figures as of writing, suggesting that the upside is more favored as the RSI stays above the midline. But looking at the Bollinger Bands, the price is approaching the lower band, which indicates that the pair could remain its downside traction. In conclusion, we think market will be bearish as long as the 1.1479 resistance holds. Further declines should favor bears and extend toward the 1.1260 region.
Resistance: 1.1479, 1.160
Support: 1.1386, 1.1284, 1.1132
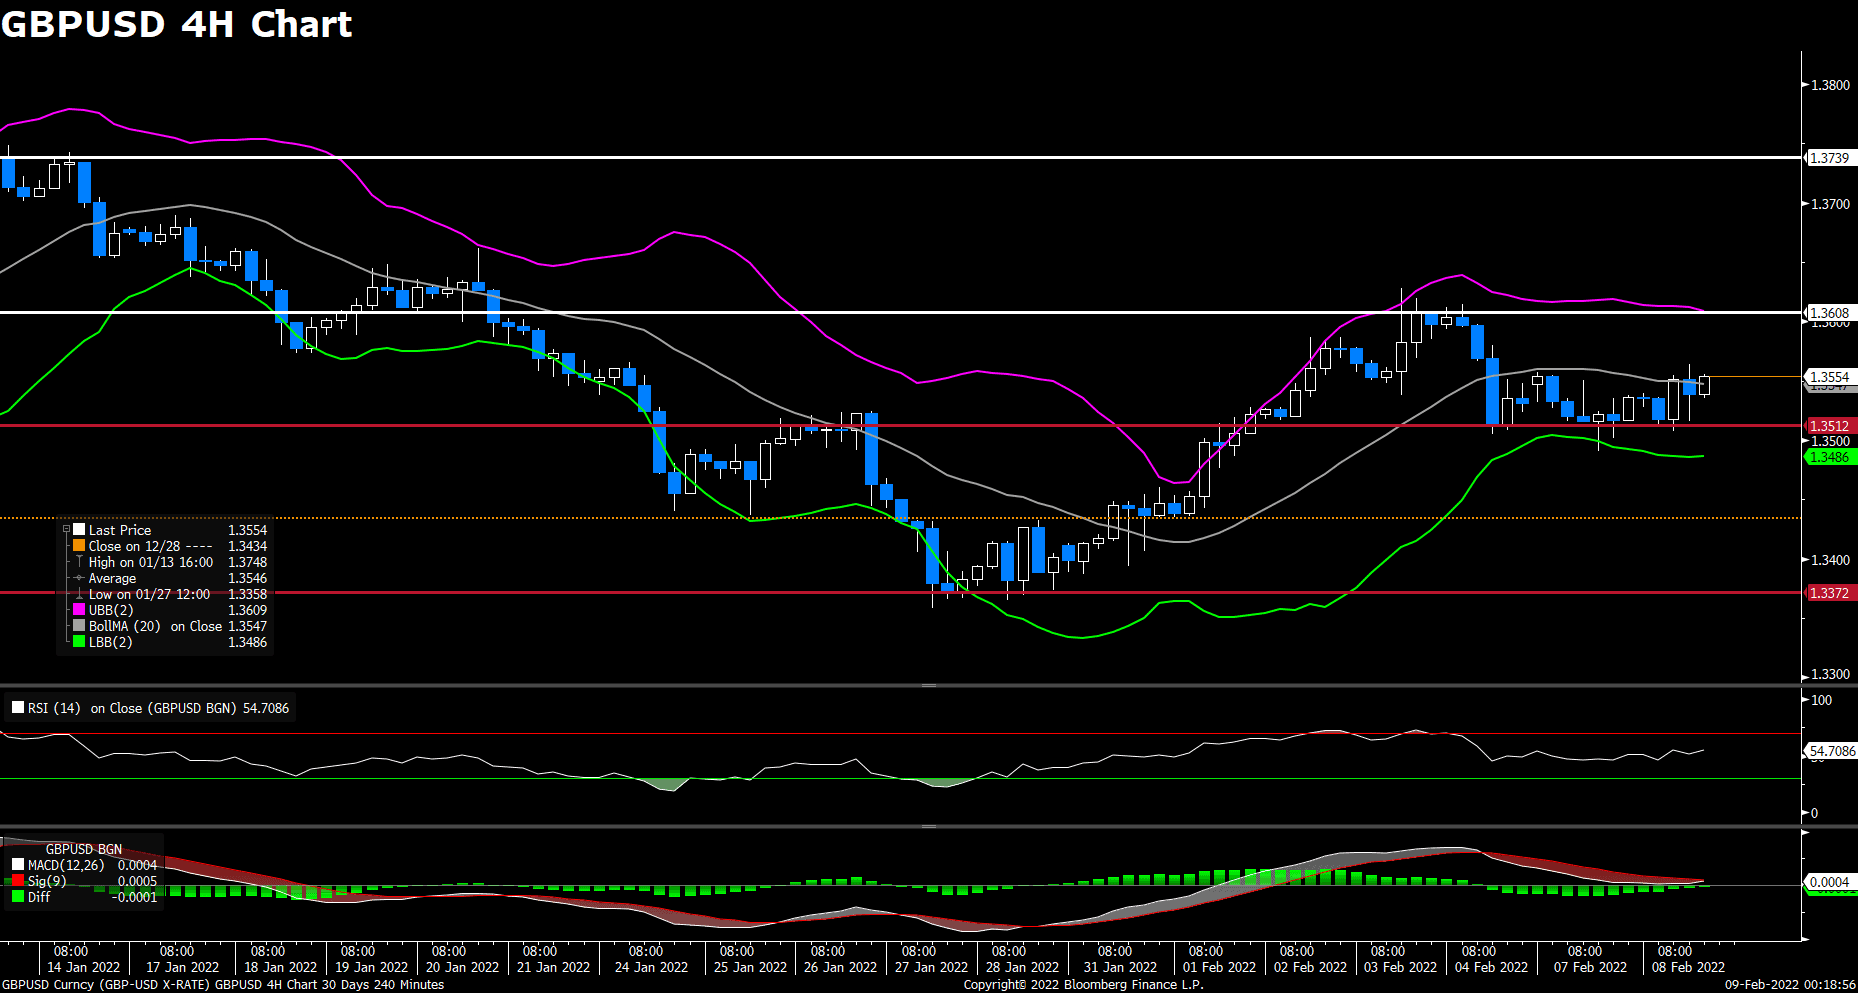
The pair GBP/USD edged higher on Tuesday, attracting some dip-buying and bounce back amid risk-on market sentiment. The pair started to witness bullish momentum in early European session and rallied to a daily high above 1.3560 level, but lacked recovery strength. At the time of writing, the cable stays in positive territory with a 0.13% gain for the day, flirting with the 1.3500~1.360 area with no obvious direction. The risk-on market mood lend support to the British pounds, but the expectations that the Fed would tighten its policy at a faster pace and a rate hike in March might keep a lid on any further upside for the cable. As for now, investors awaits Thursday’s US CPI data, which could adds pressure on the Fed to tighten monetary policy and weigh on GBP/USD pair.
For technical aspect, RSI indicator 54 figures as of writing, suggesting tepid bull movement ahead. For the MACD indicator, a golden cross is forming on the histogram, showing potential upside momentum. The Bollinger Bands is also indicating bull signals as the pair is crossing above the moving average. In conclusion, we think market will be slightly bullish as the pair failed to break below the 1.3512 support. The pair needs to rise above 1.3560 in order to regain its bullish momentum and target 1.3608 resistance.
Resistance: 1.3608, 1.3739
Support: 1.3512, 1.3372
USDCAD (4-Hour Chart)
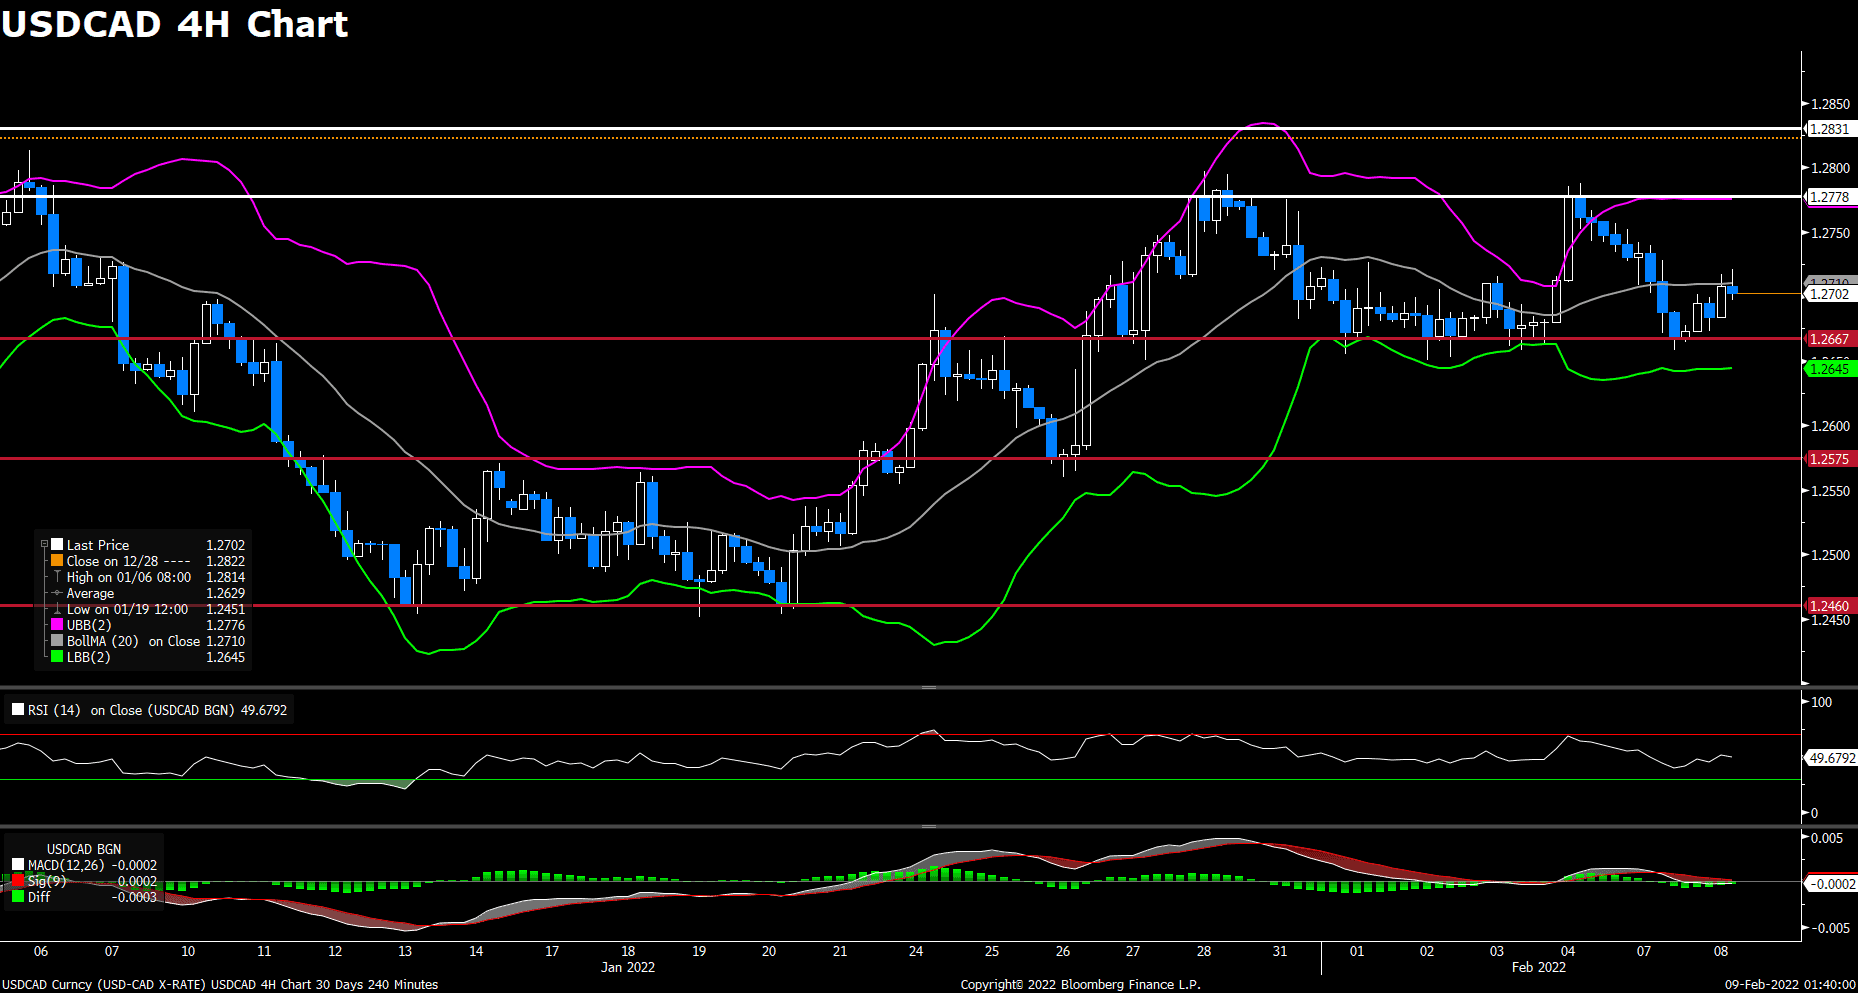
After previous day’s slide to 1.2670 area, the pair USD/CAD staged a goodish rebound towards 1.2700 level today amid modest US dollar strength. The pair was surrounded by bullish momentum most of the day and reached a daily top near 1.2720 mark during American session, rising 0.27% on a daily basis. The speculations for a faster policy tightening by the Fed bolstered the benchmark 10-year US Treasury bond yield, therefore pushing the greenback and USD/CAD pair higher. On top of that, the falling crude oil price also acted as a headwind for the the commodity-linked loonie, as WTI pulled back from seven-year highs to $89.00 amid profit-taking. But the conflict between Russia and Ukraine should limit losses for oil prices.
For technical aspect, RSI indicator 50 figures as of writing, suggesting that the pair lacks obvious direction now. As for the Bollinger Bands, the pair might crosses above the moving average as prices have a tendency to bounce within the bands’ envelope. In conclusion, we think market will be bullish as long as the 1.2667 support line holds. If the US and Iran can agree on the 2015 nuclear pact deal, this would help ease upward pressure on crude oil markets.
Resistance: 1.2778, 1.2831
Support: 1.2667, 1.2575, 1.2460
Economic Data:
|
Currency |
Data |
Time (GMT + 8) |
Forecast |
|
|
USD |
Crude Oil Inventories |
23:30 |
0.369M |
|

This site uses cookies to provide you with a great user experience.
By using vtmarkets.com, you accept our
cookie policy.

اختر نوع الحساب وأرسل طلبك


موّل حسابك باستخدام مجموعة واسعة من طرق الإيداع

الوصول الى أكثر من 1000 أداة عبر جميع فئات الأصول.


![]()
Follow us on:


![]()